Scholarship@Western
Scholarship@Western
Electronic Thesis and Dissertation Repository
12-13-2013 12:00 AM
Computational Molecular Coevolution
Computational Molecular Coevolution
Russell J. Dickson
The University of Western Ontario
Supervisor
Dr. Gregory B. Gloor
The University of Western Ontario Graduate Program in Biochemistry
A thesis submitted in partial fulfillment of the requirements for the degree in Doctor of Philosophy
© Russell J. Dickson 2013
Follow this and additional works at: https://ir.lib.uwo.ca/etd
Part of the Bioinformatics Commons
Recommended Citation Recommended Citation
Dickson, Russell J., "Computational Molecular Coevolution" (2013). Electronic Thesis and Dissertation Repository. 1798.
https://ir.lib.uwo.ca/etd/1798
This Dissertation/Thesis is brought to you for free and open access by Scholarship@Western. It has been accepted for inclusion in Electronic Thesis and Dissertation Repository by an authorized administrator of
(Thesis format: Integrated Article)
by
Russell Dickson
Graduate Program in Biochemistry
A thesis submitted in partial fulfillment
of the requirements for the degree of
Doctor of Philosophy
The School of Graduate and Postdoctoral Studies
The University of Western Ontario
London, Ontario, Canada
c
A major goal in computational biochemistry is to obtain three-dimensional structure
informa-tion from protein sequence. Coevoluinforma-tion represents a biological mechanism through which
structural information can be obtained from a family of protein sequences. Evolutionary
rela-tionships within a family of protein sequences are revealed through sequence alignment.
Statis-tical analyses of these sequence alignments reveals positions in the protein family that covary,
and thus appear to be dependent on one another throughout the evolution of the protein family.
These covarying positions are inferred to be coevolving via one of two biological mechanisms,
both of which imply that coevolution is facilitated by inter-residue contact. Thus, high-quality
multiple sequence alignments and robust coevolution-inferring statistics can produce structural
information from sequence alone. This work characterizes the relationship between
coevo-lution statistics and sequence alignments and highlights the implicit assumptions and caveats
associated with coevolutionary inference. An investigation of sequence alignment quality and
coevolutionary-inference methods revealed that such methods are very sensitive to the
system-atic misalignments discovered in public databases. However, repairing the misalignments in
such alignments restores the predictive power of coevolution statistics. To overcome the
sen-sitivity to misalignments, two novel coevolution-inferring statistics were developed that show
increased contact prediction accuracy, especially in alignments that contain misalignments.
These new statistics were developed into a suite of coevolution tools, the MIpToolset. Because
systematic misalignments produce a distinctive pattern when analyzed by coevolution-inferring
statistics, a new method for detecting systematic misalignments was created to exploit this
phe-nomenon. This new method called “local covariation” was used to analyze publicly-available
multiple sequence alignment databases. Local covariation detected putative misalignments in a
database designed to benchmark sequence alignment software accuracy. Local covariation was
incorporated into a new software tool, LoCo, which displays regions of potential misalignment
during alignment editing assists in their correction. This work represents advances in multiple
sequence alignment creation and coevolutionary inference.
covariation, protein family curation, Mutual Information
Chapter 1 was written with helpful editorial comments from GBG.
Chapter 2 is presently in-press to be published in the journal Methods in Molecular
Biol-ogy as “Bioinformatics Identification of Coevolving Residues” with my supervisor Gregory
B. Gloor (GBG). The workflow was designed with contributions from GBG. GBG provided
editorial comments.
Chapter 3 is publicly available on arxiv.org as “The MIp Toolset: an efficient algorithm for calculating Mutual Information in protein alignments” co-authored by GBG, who provided
helpful editorial comments.
Chapter 4 is under review at the journal Bioinformatics as “Gambling on Gaps: An
Expla-nation of the Alignment-Coevolution Relationship”. It is co-authored by GBG who provided
helpful editorial comments and assisted with experimental design for Figure 3.
Chapter 5 is published in the journal PLoS One as “Identifying and Seeing beyond Multiple
Sequence Alignment Errors Using Intro-Molecular Protein Covariation”. I am the first author
of this manuscript with Lindi M. Wahl (LMW), Andrew D. Fernandes (ADF), and GBG as
co-authors. The experiment that is featured in Figure 5.8 was designed and conducted by LMW.
ADF provided a more formal reformulation of an earlier version of the∆Z pstatistic. The new coevolution statistics were created with GBG. Software that was used to conduct experiments
for this chapter was co-written by GBG. The manuscript was written predominantly by me
with GBG. Supplementary figures and data for Chapter 5 is available at plosone.org.
Chapter 6 is published in the journal PLoS One as “Protein Sequence Alignment Analysis
by Local Covariation: Coevolution Statistics Detect Benchmark Alignment Errors”. It is
co-authored by GBG who provided helpful editorial commentary.
Chapter 7 was written with helpful editorial comments from GBG.
Foremost, I would like to thank my supervisor, Dr. Gregory Gloor for his guidance, support,
patience, and help throughout my studies. I would not be where I am today if it was not for
his generous investment of time and effort. I learned a great deal about what it means to be a Professor from him. Being his teaching assistant was an eye opening experience for how to
provide an ideal learning environment for students. I also learned the importance scientific and
intellectual integrity. I truly appreciate the time I had to learn from him and was a part of his
group.
I also wish to thank my thesis advisors Dr. Stan Dunn and Dr. Chris Brandl. During my
time at Western I had the pleasure of taking classes with both of these esteemed professors and
learned a great deal from both. Notably, a fateful conversation with Dr. Dunn after a 3rd-year
biochemistry class led me to the topic of this PhD thesis and Dr. Gloor’s lab. I appreciate them
taking the time to contribute so profoundly to my graduate education.
Also I must thank members of the Gloor lab, past and present. Especially (future Drs.) Jean
Macklaim, Tom McMurrough, and Dr. Andrew Fernandes, whose hard work and friendship
are very much appreciated. As well, thanks to Dr. Ardeshir Goliaei from Dr. Dunn’s lab. It has
been a pleasure working with all of you.
Thanks also to Dr. David Edgell for his mentoring, guidance and support, Dr. Lindi Wahl
for her thought provoking insights, and Dr. Mark Daley for his motivating conversations and
advice. I deeply appreciate the time that these mentors invested in me.
I would also like to thank Dr. Heather Gordon at Brock University for my first exposure to
Bioinformatics in high school that started me on a path to this PhD thesis.
I want to thank my family, especially my parents for their love and support, and for fostering
in me a love of science. And to my friends, who endured my attempts to explain coevolution
at social gatherings.
Most importantly, I want to thank my loving wife, Jackie. Her love, support, and sense of
or more supportive partner than her.
I have been supported by an NSERC PGS-M and an NSERC CGS-D scholarships, as well
as from The University of Western Ontario, and an NSERC Discovery Grant to Gregory Gloor.
Abstract ii
Co-Authorship Statement iv
Acknowlegements v
List of Figures xiii
List of Appendices xv
List of Abbreviations, Symbols, and Nomenclature xvi
1 General Introduction 1
1.1 Open Problems in Bioinformatics . . . 1
1.2 Protein Molecular Evolution . . . 2
1.2.1 Homology . . . 2
1.2.2 Orthology and paralogy . . . 3
1.2.3 Protein families and superfamilies . . . 5
1.3 Multiple Sequence Alignments . . . 5
1.3.1 Sequence alignment overview . . . 5
1.3.2 Challenges in multiple sequence alignment evaluation . . . 6
1.3.3 Alignment scoring matrices . . . 8
1.3.4 Local and global alignment . . . 11
1.3.5 Global multiple sequence alignment methods . . . 12
1.3.7 The role of gaps in an alignment . . . 16
1.3.8 Assessing alignment quality . . . 18
1.4 Intra-Molecular Protein Coevolution . . . 19
1.4.1 Positional non-independence . . . 19
1.4.2 Coevolution . . . 21
1.4.3 Coevolution inference statistics . . . 22
1.4.4 Mutual Information-based covariation . . . 23
1.5 Summary . . . 28
2 Methods 41 2.1 Introduction . . . 42
2.2 Materials . . . 44
2.2.1 Computer and general-purpose software . . . 44
2.2.2 Sequence collection tools and databases . . . 45
2.2.3 Sequence alignment tools . . . 45
2.2.4 Alignment curation tools . . . 46
2.2.5 Coevolution analysis . . . 46
2.3 Methods . . . 46
2.3.1 Building and installing bioinformatics tools . . . 46
2.3.2 Collecting protein sequences and structures . . . 47
2.3.3 Building a structure-guided sequence alignment (Alternately, use 2.3.4 for a sequence-only alignment if no structure is available.) . . . 48
2.3.4 Creating a sequence-only alignment (Alternately, use 2.3.3 for a structure-guided alignment.) . . . 52
2.3.5 Curating and validating an alignment . . . 53
2.3.6 Coevolution analysis . . . 55
2.3.7 Visualizing and interpreting results . . . 56
3 The MIp Toolset Algorithm 72
3.1 Abstract . . . 72
3.2 Introduction . . . 73
3.3 Algorithm . . . 74
3.3.1 Mutual Information . . . 74
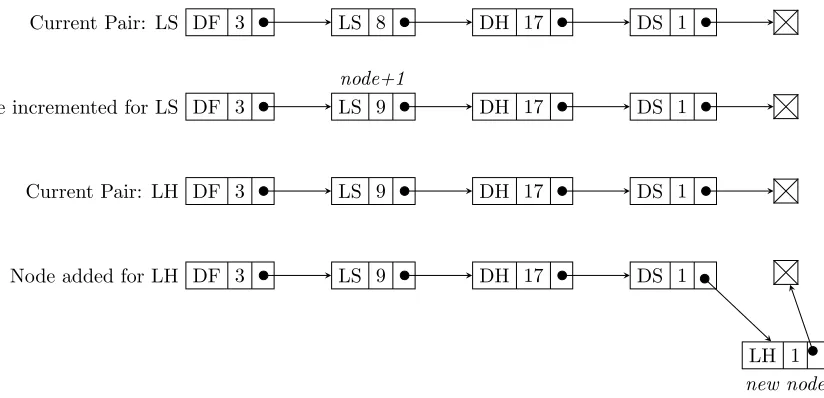
3.3.2 Storage of sparse matrix in linked list . . . 75
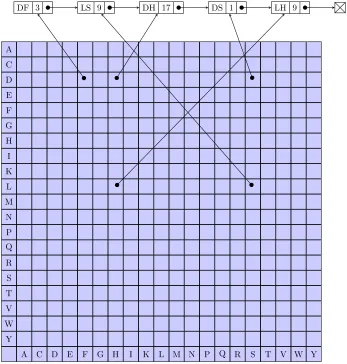
3.3.3 Direct access to linked list improves speed . . . 76
3.3.4 Integration in the MIpToolset . . . 77
3.4 Conclusions . . . 78
4 The alignment-coevolution relationship 83 4.1 Abstract . . . 83
4.1.1 Motivation . . . 83
4.1.2 Results . . . 83
4.2 Introduction . . . 84
4.3 Methods . . . 85
4.3.1 Synthetic alignment demonstration . . . 85
4.3.2 Correspondence of gap positions and covarying pairs shown across alignment methods . . . 86
4.3.3 Database-wide covariation accuracy analysis . . . 86
4.4 Results . . . 87
4.4.1 Coevolution analysis of synthetic alignment reveals gap effects . . . 87
4.4.2 Gap positions show high covariation in real alignments . . . 91
4.4.3 Database wide screen demonstrates low contact prediction accuracy in gapped positions . . . 92
4.5 Discussion . . . 93
5 Multiple sequence alignment errors and coevolution 102
5.1 Abstract . . . 102
5.1.1 Background . . . 102
5.1.2 Methodology/Principal Findings . . . 103
5.1.3 Conclusions/Significance . . . 103
5.2 Introduction . . . 103
5.3 Results . . . 106
5.3.1 Systematic sources of error . . . 106
5.3.2 Systematic misalignments in CDD . . . 111
5.3.3 Comparison of sensitivity . . . 116
5.3.4 ∆Z pandZpxemphasize pairwise covariation . . . 118
5.4 Discussion . . . 118
5.5 Materials and Methods . . . 123
5.5.1 Modeling Systematic Misalignment . . . 123
5.5.2 Alignment curation and criteria for contact prediction . . . 123
5.5.3 cd00300-based alignments . . . 124
5.5.4 Covariance statistic calculations . . . 124
5.5.5 Screening for misalignments using increased local MIp . . . 127
5.5.6 Synthetic coevolution dataset . . . 127
6 Coevolution statistics detect benchmark alignment errors 132 6.1 Abstract . . . 132
6.2 Introduction . . . 133
6.3 Results . . . 136
6.3.1 Illustrating How Covariation Identifies Sequence Shifts . . . 136
6.3.2 Identifying Alignments with High Local Covariation . . . 138
6.3.4 Realigning a BAliBASE Structure Alignment . . . 141
6.3.5 Local Covariation Identifies Active Site Residues . . . 143
6.4 Discussion . . . 146
6.5 Materials and Methods . . . 149
6.5.1 Demonstrating Local Covariation Rationale . . . 149
6.5.2 Algorithm Overview . . . 150
6.5.3 The LoCo Alignment Curation Tool . . . 151
6.5.4 The LoCo Alignment Curation Procedure . . . 151
6.5.5 Automated Search of CDD and BAliBASE . . . 152
6.5.6 Structure Validation . . . 152
7 Discussion 159 7.1 Improvements to multiple sequence alignment . . . 159
7.1.1 Putative misalignments in benchmark alignment databases . . . 159
7.1.2 Alignment reliance on conservation . . . 160
7.1.3 Supporting alternative alignments . . . 161
7.1.4 Local covariation is not dependent on conservation . . . 161
7.1.5 Local covariation as an alternative to GBLOCKS . . . 162
7.2 Improvements to structure prediction and coevolutionary inference . . . 163
7.2.1 Sequence alignment improvement critical to application of coevolu-tionary methods . . . 163
7.2.2 Misalignment as a source of false-positive covariation . . . 164
7.2.3 Development of new coevolution-inferring statistics . . . 164
7.2.4 Gaps are not the 21st amino acid . . . 165
7.3 Validating coevolution predictions . . . 166
7.3.1 Active site variation constraints from a coevolving network of positions 166
kinase . . . 166
7.4 Software development . . . 167
7.4.1 The MIpToolset for rapid calculation of covariation statistics . . . 167
7.4.2 LoCo for alignment curation based on both conservation and local co-variation . . . 168
7.5 Future work . . . 168
7.5.1 Improving multiple sequence alignment benchmarks . . . 168
7.5.2 Towards a universal benchmark for coevolutionary inference . . . 169
7.5.3 Creating one consensus statistic from many Mutual Information-based methods . . . 170
7.5.4 Towards the detection of paralogous contamination . . . 170
7.6 Final conclusions . . . 171
A Reprint permissions 177 A.1 Chapter 2 . . . 177
A.2 Chapter 3 . . . 178
A.3 Chapter 4 . . . 179
A.4 Chapters 5 and 6 . . . 179
Bibliography 177
Curriculum Vitae 181
1.1 Alignment of triosephosphate isomerase created using Cn3D [40] and drawn
using Jalview [80] . . . 7
1.2 Structure alignment of triosephosphate isomerase created and rendered in Cn3D [40] . . . 14
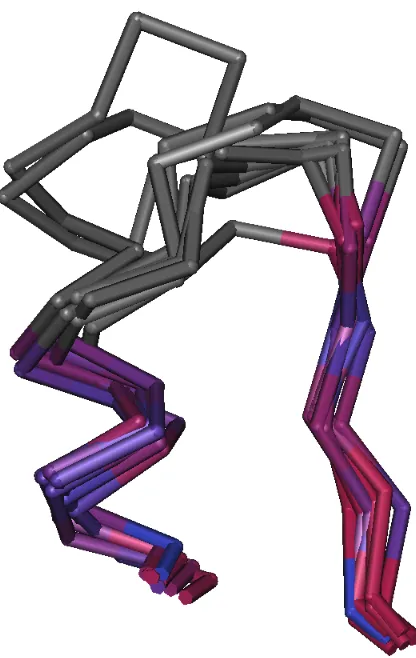
1.3 Structure alignment of a structurally-divergent surface loop (grey) connecting a structurally-conservedα-helix andβ-sheet (coloured) in triosephosphate iso-merase. . . 17
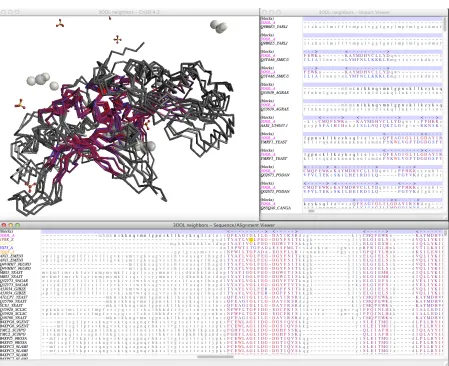
2.1 Screenshot of the three windows comprising the Cn3D workspace showing an analysis of the LAGLIDADG Homing Endonuclease family. . . 49
2.2 An example of a shift error added to a segment of a LAGLIDADG alignment. . 51
2.3 Realigning sequences using LoCo. . . 54
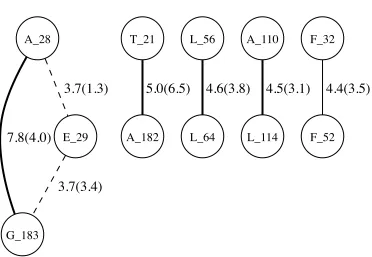
2.4 A network representation of coevolving residues. . . 56
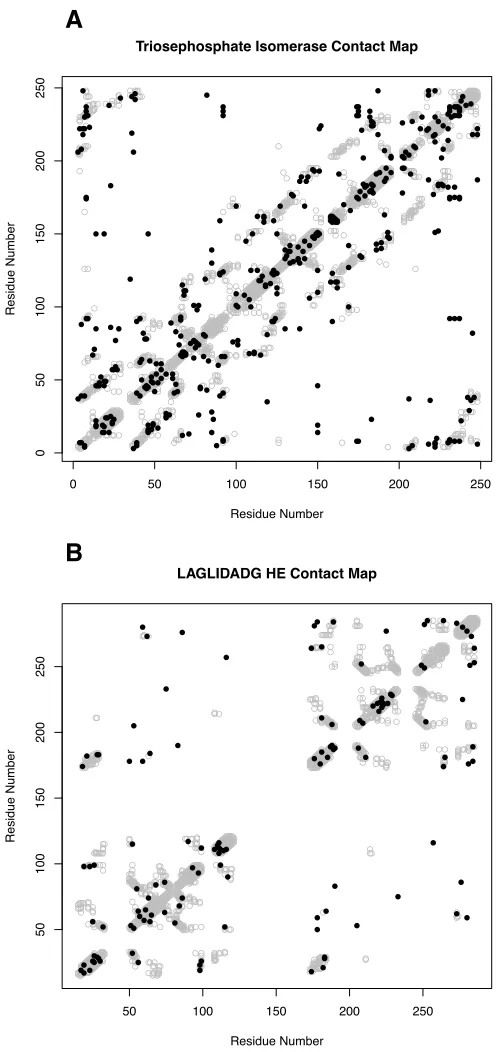
2.5 Contact Map representations of coevolution predictions. . . 66
3.1 Linked list storage of amino acid pair counts. . . 75
3.2 Direct-access array of pointers to growing linked list. . . 77
4.1 Illustrative alignments of a small hypothetical protein segment. . . 87
4.2 Pairwise covariation scores shown as heatmaps compared to the percentage of gaps at each position from four different alignment methods. . . 90
4.3 Contact prediction accuracy byMIpof pairs with no gap characters and pairs within a single contiguous gap. . . 94
5.2 Systematically misaligned regions have high localZpvalues. . . 109
5.3 Positions with shift error have high markedly increased covariation scores. . . . 110
5.4 ∆Z pandZpxare less affected by sequence misalignments thanZp. . . 112
5.5 Predicted contact map shows repaired cd00300 alignment is more informative than the original. . . 114
5.6 The effect of alignment quality on contact identification. . . 115
5.7 Zp,∆Z p, andZpxfind different subsets of contacting positions. . . 117
5.8 The effect of covariation probability and covarying group size on covariation measures. . . 119
6.1 Local covariation identifies alignment shift errors. . . 136
6.2 Alignments with high local covariation found in alignment databases. . . 138
6.3 Realigning serine protease using LoCo. . . 139
6.4 Realigning serine protease using LoCo. . . 142
6.5 Local covariation identifies active site residues. . . 144
Appendix A Reprint permissions . . . 177
a priori: from an understanding of mechanism rather than empirical observation. APC: Applied Product Correction. Used to computeMIpfromMI.
BAliBASE: Benchmark Alignment dataBASE. A collection of sequence alignments for
evaluating sequence alignment methods.
bHLH: basic Helix Loop Helix. A family of proteins.
BLOSUM: BLOcks SUbstitution Matrix. A scoring matrix used in sequence alignment.
CAPS: Coevolution Analysis using Protein Sequences. A coevolutionary-inference method.
CLUSTALW: Progressive multiple sequence alignment software.
CMA: Correlated Mutation Analysis. A coevolutionary-inference method.
Cn3D: “See in 3D”. Software for viewing and generating structure-based sequence
align-ments.
covarion: Concomitantly variable codon.
DCA: Direct Coupling Analysis. A coevolutionary-inference method.
de novo: Starting from first principles.
ELSC: Explicit Likelihood of Subset Covariation. A coevolutionary-inference method.
GBLOCKS: Software that removes putatively-unreliable positions from a protein
align-ment prior to phylogenetic inference.
H: Information entropy, a measure of the uncertainty of a random variable.
HMMER: A Hidden Markov Model-based tool for inferring homology.
LAGLIDADG HE: A Homing Endonuclease protein family.
LDH: Lactate Dehydrogenase. A protein family.
LoCo: Local Covariation-based sequence alignment curation tool.
MAFFT: Multiple Alignment using Fast Fourier Transform. A global sequence alignment
method.
McBASC: McLachlan-BAsed Substitution Correlation. A coevolutionary-inference method.
MDH: Malate Dehydrogenase. A protein family.
MIpToolset: Software for calculating Mutual Information-based coevolution statistics from
protein family alignments.
MSA: Multiple Sequence Alignment.
MUSCLE: A global sequence alignment tool.
OMES: Observed Minus Expected Scores. A coevolutionary-inference method.
OXBENCH: A database for benchmarking sequence alignment methods.
PAM: Point Accepted Mutation. A type of substitution scoring matrix for global alignment.
PRANK: A sequence alignment tool that is phylogeny-aware.
PREFAB: A database for benchmarking sequence alignment methods.
PSI-BLAST: A tool for inferring sequence homology.
PSSM: Position-Specific Scoring Matrix. A substitution scoring matrix applied uniquely
to each position in an alignment.
SABMARK: A database for benchmarking sequence alignment methods.
SCA: Statistical Coupling Analysis. A tool for inferring coevolution.
SP: Sum of Pairs. A scoring method for evaluating a multiple sequence alignment.
T-COFFEE: A sequence alignment method.
TIM: Triosephosphate Isomerase. A protein family.
VAST: A protein structure alignment method.
Zp: The MIp coevolution statistic converted into Z-scores.
Zpx: A coevolutionary statistic based on Zp.
∆Z p: A coevolutionary statistic based on Zp.
General Introduction
1.1
Open Problems in Bioinformatics
Intra-molecular protein coevolution represents the confluence of the two largest open
prob-lems in bioinformatics, multiple sequence alignment and protein structure prediction. Protein
structure prediction has long been a major goal of bioinformatics because of the utility of
accu-rate three-dimensional protein structure models and the comparatively high financial and time
investment required to generate such models usingin vitrorather thanin silicomethods. Co-evolution represents a biological mechanism through which multiple sequence alignments can
generate structural information.
It is theoretically possible (yet, at present, computationally intractable) to generate a full,
accurate three-dimensional model of a protein using only the primary amino acid sequence
from which the protein is composed [6]. Because of the computational challenges associated
with protein structure prediction, many groups have attempted to limit the massive protein
structure prediction “search space” with supplemental data too coarse for accurate modelling
by itself. These coarse experimental methods include the incorporation of cryoelectron
mi-croscopy and partial nuclear magnetic resonance data [1]. As well, sequence analysis-based
methods generate predictions based on models of evolution and multiple sequence alignments
[20].
The potential to produce accurate predictions of the three-dimensional structure of proteins
is one example of the vast utility of Multiple Sequence Alignment (MSA). The ability to
gen-erate rapid and accurate sequence alignments is one of the largest contributions of the field
of computational biology. When conducted properly, sequence alignments identify homology
at the molecular level, and thus are possibly the most clear and explicit piece of evidence of
evolution itself. Therefore, multiple sequence alignment is fundamental to all of molecular
biology as it is a way of exploring homology.
1.2
Protein Molecular Evolution
1.2.1
Homology
Homology is the similarity we see in the natural world that is due to the common descent of
organisms; it is one of the most fundamental and important concepts in biology [17, 41]. Two
traits are said to be homologous if they show similarity due to ancestral relatedness. If one was
to use traits as evidence of relatedness between two organisms, homologous traits would be
examples of “signal”.
But not all biological similarities can be attributed to shared ancestry; for example, a bat
wing and bird wing appear to share superficial similarity in structure, but arose independently.
Bat and bird wings are only homologous as the forelimbs of tetrapods, but not as wing
struc-tures themselves [70]. The similarity between bird and bat wings is an example of the
conver-gence to a similar solution and is called analogy. If homologous traits are metaphorical
“evo-lutionary signal” as outlined previously, traits that are analogous but not homologous would be
“noise”.
One of the greatest insights in the history of science was that the history of all living
organ-isms could be represented as a phylogenetic tree with extant organorgan-isms represented as terminal
a universal common ancestor residing at the root of the tree [17]. A phylogenetic tree is inferred
by identifying shared characteristics that define related groups of organisms called
synapomor-phies and symplesiomorsynapomor-phies. The distinction between the two classes is that
symplesiomor-phies refer to a shared ancestral character state, and synapomorsymplesiomor-phies refer to a shared derived
character state. These two phylogenetic terms are contrasted by homoplasy, character states
whose similarity exists because of convergent evolution. Thus, homoplasies are analogous, but
not homologous.
These concepts are often discussed at the organism level, but also apply at the protein
level. The evolutionary history of a protein can be represented by a phylogenetic tree and the
amino acid identity at the various positions within the protein represent character states that
can be synapomorphic, symplesiomorphic, or homoplasic. The phylogenetic tree representing
a protein may differ greatly from the phylogenetic tree of its host organism. For example, in the case of horizontal gene transfer between bacteria, the phylogenetic tree of the protein encoded
by the gene would more closely resemble that of the transferring organism than it would the
recipient organism. These are called xenologous proteins, homologous proteins related by a
horizontal transfer[49]. The type of homology between proteins affects the inference of intra-protein coevolution, as outlined below.
1.2.2
Orthology and paralogy
The concept of homology can be subdivided further as we discuss protein molecular evolution.
Homologous proteins are similar because of shared ancestry, but this distinction is not suffi -cient to generate high-quality coevolutionary data. The relationship between the homologous
proteins is important and can be divided into several subtypes [49]. Orthologous proteins are
related by direct linear descent from a common ancestral protein that were separated by
speci-ation events. Paralogous proteins are proteins that have been separated by a gene duplicspeci-ation
where multiple copies of a protein exist in the same genome [29]. Unlike orthologous
functional divergence over evolutionary time [29]. It is important to remember that both
or-thology and paralogy are subtypes of homology and can be distinguished from analogy, which
is relatedness because of common function.
While it is algorithmically possible to infer gene duplication and speciation events from a
complete gene tree [83], there exists no automated way to determine whether two sequences
are orthologues or paraloguesa priori, given only their sequences. However, one major goal of sequence alignment is to create a protein family consisting of orthologous proteins. Thus one
challenge of sequence collection through local alignment is to distinguish orthologues from
paralogues. There are numerous reasons why a protein family should ideally contain only
orthologues depending on the perspective of the user of the protein family. The phylogenetic
tree of an orthologous protein family closely resembles the topology of the species tree by
definition, and thus the orthologous character of a protein family is useful for phylogenetics;
in fact, the consensus of multiple putatively-orthologous protein family trees is the basis for
the Tree of Life project [12]. From a functional perspective, it is logical to classify proteins
by their utility. The conservation of function between orthologues combined with their shared
ancestry makes them colloquially the “same” protein in two different species. Orthologous proteins with ancient origin typically show a conservation of function across the tree of life
[26]. When trying to make structural and functional inferences about a specific protein based
on the information in a protein family alignment, it is important to include only orthologues
because the structural and functional divergence that occurs as the paralogue acquires new
function would interfere with the ability to obtain information from regarding the orthologous
family of interest.
By contrast, paralogous sequences are the source of novel function because the presence
of a second copy of the protein provides the evolutionary freedom to explore new sequence
space without interfering with the function of the original orthologous protein. Superfamilies
1.2.3
Protein families and superfamilies
As a practical example, malate dehydrogenase (MDH) is an enzyme that is part of the citric
acid cycle. There are many difference specific sequences from as many organisms that we con-sider to be part of the MDH family. Based on sequential, structural, and functional analysis, we
know that malate dehydrogenase and lactate dehydrogenase (LDH) are homologous and thus
we can infer that the two families are paralogous, originating from an ancient gene duplication
event [59]. Thus the Conserved Domain Database contains a superfamily that contains a
fam-ily called “LDH MDH like”, containing all paralogous members of both families [59]. The
decision to include a sequence in an orthologous protein family must ultimately reside with the
expert opinion of a curator using evidence like sequence similarity, the number of putatively
homologous sequences found in a search, functional annotation, experiment, etc.
The important concept of homology and analogy extends to both the sequence and structure
of the protein. Structural and sequential motifs or even positions can be said to be homologous
or analogous. However, sequential misalignments are commonly based on the alignment of
two analogous sequence motifs, or even analogous residues. Two protein structures may be
homologous, as the two folds may be super-imposable for many structurally-conserved
fea-tures. Structural analogy exists but is comparatively very rare [11].
1.3
Multiple Sequence Alignments
1.3.1
Sequence alignment overview
The concept of homology is the fundamental theoretical underpinning of multiple sequence
alignment. DNA and protein sequences are biological traits, just like skeletal wing structure.
The major advantage of using biological sequences over other morphological traits is that they
are universal and thus can be used to make evolutionary inferences across all known organisms.
a nucleotide for a DNA alignment or amino acid for protein, is aligned into a putatively
homol-ogous column [19]. Figure 1.1 shows a graphical representation of an alignment for the protein
family triosephosphate isomerase. Residues in this alignment are coloured by amino acid
prop-erty where similar colours represent similar properties, revealing homologous columns visually
[74]. The goal of multiple sequence alignment is to assign each biological character in the
se-quence to these homologous positions such that the similarity between sese-quence positions in
that column, often manifesting as similar identity or properties, is due to the shared ancestry of
the sequences. However, there is the potential for much analogy on a position-by-position basis
in sequence alignment because biological characters (nucleotides or amino acids) occur many
times and therefore there is often low information content relative to the number of hypotheses
tested.
Ideally, a multiple sequence alignment is a grid where every row is a biological sequence
and every column is a homologous position. This problem is trivial when aligning
near-identical sequences with no insertions or deletions; such a case exists when creating alignments
of orthologous sequences from closely-related organisms. However, such ideal conditions are
impossible to meet when sequence similarity diverges. When building a protein family model,
the goal is to collect all members of the protein family spanning the entire tree of life. This
means that the protein family model contains unknown ancient, extinct protein members that
cannot be sequenced.
1.3.2
Challenges in multiple sequence alignment evaluation
Unfortunately, there is no deterministic experimental alignment method that provides a
defini-tive solution against which computational solutions can be benchmarked. For a comparison,
consider the in silico structure prediction problem: Structure predictions generated in silico
A
B
that can generate the “correct” protein multiple sequence alignment because such a
hypothet-ical experiment would involve actually observing mutational and speciation events that have
already occurred over the entire history of life on earth. Only extant data can be collected and
extinct sequence data is lost to history. While there are methods that attempt to infer the
iden-tity of extinct ancestral sequences [65, 38], these methods are hypothesis-generating just like
sequence alignment methods.
Robert Edgar, the creator of the widely-used MUSCLE sequence alignment tool [25],
pub-licly declared Multiple Sequence Alignment a “dead field” in 2010. He credited the stagnation
of the field to the fact that new ideas in sequence alignment didn’t seem to produce noticeable
improvements in benchmark datasets. The publication of the original BAliBASE dataset in
1999 [76], of which there are several iterations [9, 77], catalyzed a decade of advancement, as
competing groups published work demonstrating that their method provided the highest
bench-mark scores. BAliBASE was a dataset of carefully constructed alignments that were curated by
hand and were structurally-supported; this careful human intervention is what gave confidence
in BAliBASE’s correctness.
However, there is still no physical experiment that establishes the correctness of BAliBASE
or other “benchmark-quality” datasets and thus a potential explanation for the stagnation of the
alignment field is that the benchmark alignments are not correct. While the assumed
correct-ness of BAliBASE was necessary for the field to proceed at the inception of the database, it may
ultimately have lead to the stagnation of the field a decade later; perhaps the lack of progress
in alignment accuracy was due to errors in the database rather than errors in the alignment
procedures themselves.
1.3.3
Alignment scoring matrices
The simplest sequence alignment problem involves only two sequences. The algorithmic goal
of the two-sequence problem is to maximize a scoring function that is designed with the goal
pro-gramming approach is used to reuse calculated information efficiently [63]. Matched (or mis-matched) residues are given a score according to values in a matrix based on the observable
frequency with which such substitutions are seen in alignments relative to the expected
fre-quency background substitutions based on independent positional evaluation [19].
Insertions and deletions are accounted for by inserting one or more “gap characters”,
typ-ically a dash, and assessing an affine gap penalty, that acknowledges that a single insertion or deletion event can cover many alignment positions and thus penalizes the creation of a gap
more strongly than its extension [2]. The first multiple sequence alignments were
necessar-ily made by hand and involved closely-related sequences [19]. Closely-related sequences are
said to have high identity because there are few sequence differences between them. Regions that show high identity are said to show conservation, a measure of the extent to which
iden-tical amino acids appear in the columns in the alignment [68]. Such hand-made alignments of
similar homologous sequences were the basis of the Point Accepted Mutation (PAM) scoring
matrices [19]. Entries in a substitution matrix are scaled log-odds scores. They are
calcu-lated by taking the log ratio of the empirically observed amino acid substitution frequencies
versus the observed marginal frequency of each amino acid, ie. the probability the
substitu-tion occurred by accepted mutasubstitu-tions versus the probability the amino acids were aligned by
chance. If the substitution is empirically favourable, a positive score is assigned to the
substi-tution. PAM matrices are ideal for global alignments of known homologues because of their
end-to-end nature and the largely highly conserved alignments due to sequence similarity.
The BLOSUM matrices, developed later, were based on an analysis of more diverged
pro-teins than the PAM matrices [39]. Henikoffet al. analyzed short, highly-conserved segments called blocks and observed amino acid substitution rates. BLOSUM matrices are developed to
infer homology between two dissimilar sequences, which is in contrast to PAM matrices that
are used to align sequences for which homology has been asserted. Henikoffet al. developed a method to encourage inference between dissimilar sequences. All sequences that are within
calculating positional frequencies and accepted mutations.
A scoring matrix provides an empirical method for evaluating more distantly-related
se-quences. The initial hand-made alignments were based on the concept of identity, where
columns were aligned such that as many matching residues were super-imposed in the same
column as possible [19]. With the inclusion of scoring matrices, alignments could be measured
by similarity, where empirically-derived favourable mutations could contribute positively to the
alignment. A completed alignment is usually evaluated based on conservation. Two protein
sequences with high identity show conservation. Protein sequences with low similarity show
little conservation. Typically, a multiple sequence alignment will show varying degrees of
con-servation across its length. The most conserved regions are inferred to be important because
something is fighting the natural tendency for sequences to diverge in this region [10, 69].
Both PAM and BLOSUM are designed to be general-purpose scoring solutions for their
respective problems. However, a better solution can be built for a specific protein family. A
Position-Specific Scoring Matrix (PSSM) is similar to the aforementioned scoring matrices
except it is calculated on a position-by-position basis for the specific protein family being
analyzed [5]. As new sequences are added to a growing alignment, the PSSM is recalculated for
each position, expanding the accepted mutations for each position and increasing the likelihood
of inferring homology between divergent sequences. A PSSM is an effective alignment tool because it will empirically derive the underlying “rules” of accepted substitutions for each
position in a protein family. Whereas a BLOSUM matrix may suggest that two amino acids
are fairly interchangeable in the general case, the same substitution may not be allowed at all
at a specific position in the protein family being analyzed. If a PSSM is built from a diverse
enough collection of sequences, it can be a powerful tool for inferring homology between
1.3.4
Local and global alignment
The distinction must be made between local and global alignment, with the former being
de-signed for finding putatively homologous sequences, and the latter for creating an end-to-end
alignment that encompasses the evolutionary relationships of a protein family only once
ho-mology between all sequences can be assumed.
Local alignment is used for sequence collection, since no a prioriassumption of homol-ogy is made. The most common tool, BLAST, uses matrices and affine gap scores, but ac-celerates search speed by pre-processing its database in order to increase search-time speed
[3]. PSI-BLAST is an iterative approach to local alignment with increased accuracy in
col-lecting distantly-related sequences [5, 4]. In PSI-BLAST, Position-Specific Scoring Matrices
(PSSM) are used to increase sensitivity to the empirically observed substitution frequencies
at each position in the protein individually. Each position in the growing alignment has its
own empirically-derived scoring matrix that is recalculated as new putatively-homologous
se-quences are added to the growing alignment. The presence of an intermediate sequence
be-tween two dissimilar members of the same protein family will improve the algorithm’s ability
to assert homology between the three.
Because PSI-BLAST only uses affine gap penalties [2] for insertion and deletions place-ment, some choose to use Hidden Markov Model-based tools like HMMER [28, 23], which
allows for a more sophisticated gap model at the cost of complexity of the alignment model.
A Markov Model is a graph such that each node is a state and each edge contains a
probabil-ity that the edge will be traversed. A Hidden Markov Model is a Markov Model where the
current state is unknown. A Hidden Markov Model can be used to generate an alignment by
determining the alignment with the highest probability according to the model.
Once sequences are collected by local alignment, they are built into a protein family model
commonly called a multiple sequence alignment (MSA) by using global alignment. Local
algorithm, the most important issue is in what order, and in what way, each sequence is aligned
to the rest.
1.3.5
Global multiple sequence alignment methods
Sequence-based alignment methods are distinguished from structure-based multiple sequence
alignment methods in that they are “all-to-all” methods, where there is no obvious sequence or
group of sequences that are considered more importanta priori. Conversely, structure-based alignment is a “master and slave” strategy, where new sequences are aligned to a “master”
structure alignment that is based on structural rather than sequential similarity. The sum of
pairs (SP) scoring function involves summing all the pairwise alignment scores implied by the
alignment, and is the simplest method for evaluating a multiple sequence alignment. While
simple, it is computationally intractable to find a near-optimal solution in this search space
using a global search strategy, as there are too many possible alignments to evaluate each one.
A strategy is necessary to generate an alignment in reasonable time.
The most common strategy is the progressive strategy, used by CLUSTALW [75] and
T-COFFEE [64]. In progressive alignment, sequences are evaluated by a precomputed similarity
function and aligned in order such that the most similar sequences are aligned together first.
The order that the sequences will be aligned forms a guide tree that controls the flow of the
alignment process. As the algorithm continues, more sequences are added sequentially to the
growing alignment until all the sequences have been added to the alignment.
This strategy has the major drawback that early errors are propagated as the alignment
grows. Sometimes two alternative alignment choices score equally well and thus the algorithm
selects one of the two alternatives arbitrarily. If such a decision is made incorrectly due to insufficient information early in the alignment process, new sequences added to the alignment may also be aligned incorrectly and a systematic misalignment is produced.
Early choices have significant impact on the final alignment, which is why similar
align-ment, used by MUSCLE [25] and MAFFT [46, 45], strategy was designed to compensate for
systematic errors by adding an iterative refinement step: After the progressive strategy has
pro-duced an alignment, the iterative strategy searches for alternative alignments that may have a
higher optimum score than the current progressive alignment. This post-processing step can
eliminate some of the systematic errors generated by the progressive strategy.
Finally, a more sophisticated sequence-based alignment method is the phylogeny-aware
strategy used by PRANK [57, 58]. This method attempts to infer synapomorphic insertions
and deletions. Phylogeny-aware algorithms use an adjoining phylogenetic tree to attempt to
align homologous residues in gap regions. This results in much longer alignments since a gap
may be composed of multiple independent insertion or deletion events. The important corollary
to this observation is that most alignment methods that do not incorporate a phylogeny aware
strategy will maximize alignment scores by aligning homoplasic positions especially in gap
regions.
1.3.6
Structure-guided multiple sequence alignment
One of the most effective strategies for improving MSA quality is structure-guided alignment. Members of the same protein family show strong conservation of structure in the catalytic core.
Figure 1.2 is a structure alignment of triosephosphate isomerase that shows the strong structural
superimposition of the protein backbone through the core of the protein family. It is possible
to infer homology between very sequentially-dissimilar proteins using structural information
[42]. Thus structure is a powerful tool for creating alignments in diverse protein families.
Structure-based strategies involve collecting all members of a protein family for which there is
structural data and super-imposing each structurally-homologous residue.
The VAST structure alignment tool [32] is notable because it serves as the structure
align-ment software for the Cn3D alignalign-ment tool [40] that is used to curate the Conserved Domain
Database [59]. VAST is able to rapidly identify structural homology and align protein
Figure 1.2: Structure alignment of triosephosphate isomerase created and rendered in Cn3D [40]. Aligned regions are coloured by the rainbow colouring scheme to assist in visualizing the contiguous protein chain. Structurally divergent regions are coloured grey and are not aligned.
order to reduce the search space. VAST attempts to align the conserved core secondary
struc-tural elements and ignores unstructured surface loops. The structure alignment can be used to
generate a sequence alignment by analyzing inter-α-carbon distances.
errors [47]. The structure alignment may largely superimpose two secondary structural
ele-ments, but the α-carbon superimposition may incorrectly imply a sequence alignment that is
shifted one or more residues towards the N- or C-terminus. From a structural inference
per-spective, these errors are minor and fairly acceptable; from a sequence alignment perper-spective,
it is a serious error that can be difficult to detect in downstream analyses.
The inferred sequence alignment is the basis for a growing sequence alignment [40]. A
PSSM is calculated from the structurally conserved regions and it is used to align new
se-quences to the structure alignment. As each sequence is added to the original structure
align-ment, the PSSM is recalculated allowing for greater confidence when aligning dissimilar
se-quences. When a diverse protein family has multiple structures from divergent organisms, it is
possible for the PSSM to be calculated such that the diversity of the alignment can be taken into
account and a high quality alignment is made from sequences that would not be alignable from
sequence alone. This strategy is, as mentioned, “master and slave” because new sequences are
aligned to an established structure-based alignment that is assumed to be correct.
When done correctly, structure-based alignments are considered to be of the highest quality
[76]. However, great care must be taken to align the structures carefully, because structure
alignment methods place a much higher emphasis on this original alignment than sequence
alignment methods, which should function more as an all-to-all method. As well, structure
alignment is hampered by the fact that structure is comparatively rare and is expensive to
produce. Furthermore, using structure alignment is not possible if the protein alignment is
being made to create protein structure predictions.
While it is typical to benchmark coevolution methods using structure-based alignments,
be-cause structure is necessary to test contact prediction accuracy and structure-based alignments
are generally considered to be of optimal quality, such alignments are clearly not viable for use
in coevolution-based structure prediction analyses. The presence of a homologous structure
in a high quality structure-based multiple sequence alignment does not preclude coevolution
analysis for obtaining novel insights about residue positions important to the protein’s
struc-ture, function, or evolution.
1.3.7
The role of gaps in an alignment
Sequence alignment methods can be split into two broad categories of which there are many
subtypes: those that use additional structural information and those that use only sequence [71].
The differences between these two methods illuminate a schism in the field on the definition of what exactly constitutes a “homologous position”, which residue in a particular sequence
belongs in that position, and what the exact definition of a gap should be. This disagreement
over such minutiae emphasizes the importance of accurate benchmark alignment databases
for their ability to focus the field on optimizing software development for use on a putatively
correct set of hand-curated, structure-based alignments. From a structural perspective, gap
characters are an alignment artifact.
Figure 1.3 demonstrates gaps from a structural perspective. The surface loop depicted in
Figure 1.3 (grey positions) represents multiple different solutions to the problem of connect-ing two structurally-conserved segments of the protein (coloured positions). The structural
superimposition of theα-helix andβ-sheet regions is apparent and thus the inferred sequence
alignment from these regions is clearly defined. Conversely, the loop that connects these two
regions diverges. The shortest segment connecting the two structured regions is three amino
acids long, and the longest is ten. A subset of the structures may show structural similarity
in this region, but there is not a structurally-homologous position defined for the entire
pro-tein family for any position in this region. A sequence alignment program may align amino
acids corresponding to the structural positions shown based on a substitution model, but such
an alignment is not clearly defined by structural similarity. The documentation for the Cn3D
structure alignment tool explicitly states that these structurally unaligned amino acids will
Figure 1.3: Structure alignment of a structurally-divergent surface loop (grey) connecting a structurally-conservedα-helix andβ-sheet (coloured) in triosephosphate isomerase. The align-ment was created and rendered in Cn3D [40]. The structurally-conserved regions are coloured according to the fit colour scheme. The surface loop region is between three and ten amino acids long.
be inferred from the apparent ‘alignment’ of residues in the unaligned areas” [14].
Structurally, a gap character literally represents “nothing” since there are no positional
co-ordinates that correspond with the gap position. Thus, methods attempting to infer structural
information from a protein family alignment will often ignore the often-unstructured gap
re-gions [32]. Conversely, to a sequence-based approach a gap can appear meaningful. To a purely
computational analysis, the gap character is simply another character and will be included as
contain information, but they cannot be treated as another amino acid [37, 43]. As mentioned,
affine gap scores are used because a single insertion or deletion even can create multiple “gap characters” in the alignment. The presence or absence, and length of a gap do contain
phylo-genetic information. However, it is common practice to discard all positions containing gaps
before building a phylogenetic tree [37, 43, 73].
1.3.8
Assessing alignment quality
The strategies used by phylogenetics methods when analyzing alignments may be instructive.
GBLOCKS is designed to assess whether a section of an alignment should be included in
the calculations to generate a phylogenetic tree [73]. GBLOCKS assesses the conservation
of a position to determine whether it may contain errors and then determines, based on user
parameters, whether the position should be kept in the analysis. By default, GBLOCKS rejects
positions containing gap characters. It is worth noting that conservation is used to generate the
alignment and to filter which positions should be kept by GBLOCKS. Thus, systematic errors
that occur in the alignment process may not be detected by GBLOCKS or other
conservation-based methods as they have already been validated by the same criterion earlier in the analysis
pipeline.
A major challenge in sequence alignment is the lack of a “correct answer” which can be
experimentally derived in vivo or in vitro. Unlike in silico structure prediction, which can benchmark against crystal structures, there is no equivalent experiment that can generate a
benchmark dataset. In order to generate such a database by experiment, one would need to
have observed every sequence alteration when it occurred in species that are separated by
evo-lutionary time scales. It is therefore tempting to generate synthetic data on which to benchmark
one’s alignment generation and analysis methods. This strategy must be approached with
cau-tion as one’s synthetic alignment database will be evolved using the same assumpcau-tions that
the sequence alignment method uses. This will result in greatly overestimating the alignment
against real biological sequences especially from public databases.
There are now many benchmark from which one can obtain demonstration alignments
in-cluding BAliBASE 3 [77], OXBENCH [67], PREFAB [25], and SABMARK [79]. These
benchmarks rely on structural alignments to assert the correctness of the sequence alignment.
However, structure alignments are known for containing shift errors and thus are not
com-pletely reliable [47]. As well, structure alignment algorithms often disagree [36], making it
impossible to guarantee correctness when using structure alignment as a validation criteria.
Robert Edgar highlighted inconsistencies in major protein alignment benchmarks [24].
Ac-cording to Edgar, SABMARK superfamily alignments contain self-inconsistent placement of
sequences, and BAliBASE contained alignments of non-homologous domains, and groups of
homologous sequences aligned unnecessarily to gaps rather than each other.
1.4
Intra-Molecular Protein Coevolution
1.4.1
Positional non-independence
A common assumption made by sequence analysis tools is that positions within a biological
sequence are independent, despite the overwhelming evidence that they are not [16, 82, 30, 66,
81]. The precise model of sequence change within a protein is still unknown and it likely lies
somewhere on a continuum between two models: The second-site suppression model [82], and
the concomitantly variable codon model (covarion model) [30]. These models were created
while investigating the mutability of various protein families.
During work to establish the genetic code, Yanofsky et al. noted that mutations in
trypto-phan synthetase could be suppressed by changes at a second site [82]. A pattern of changes
emerged wherein the second site suppressors seemed to occur at specific locations. Yanofsky
inferred that, though they were distant in sequence, they were close in three-dimensional space.
Thus, the second site suppression model suggests that mutations tend to be deleterious to
function.
The covarion model proposed by Fitch and Markowitz [30] was developed while they were
investigating seemingly contradictory evidence regarding the neutral theory of molecular
evo-lution [48]. They noted that only 10% of sites in cytochrome c could accept a mutation, which
seemed to contradict the neutral theory that says that most mutations become fixed because
they are selectively neutral to the function of the protein. However, the contradiction was
re-solved by the explanation that as mutations occur in the protein, the set of positions that can
accept a mutation changes. New opportunities for change arise and sites that could previously
accept change become immutable in the new sequence environment.
More recently, Weinreich et al. investigated five β-lactamase point mutations that
signif-icantly increased bacterial antibiotic resistance [81]. Of the 120 possible permutations, they
determined that 102 were inaccessible to selection because they are deleterious. Further, many
of the remaining pathways to the 5 necessary mutations are unlikely to occur because most
do not convey any appreciable resistance. These data suggest that evolution is constrained to
a specific narrow pathway on which it can act. The same group investigated compensatory
mutations in dipteran genomes. Kulathinal et al. describe how residues which cause mutant
phenotypes inDrosophila melanogaster produce wild-type phenotypes at orthologous sites in other dipteran genomes, suggesting that second site suppression has occurred [51]. However,
they also acknowledge that these compensatory mutations, which occur under high selection
inD. melanogaster, may be selectively neutral under other conditions.
Around the same time, Poon et al. measured the rate of compensatory mutation for 21
randomly-chosen, deleterious point mutations in DNA BacteriophageΦX174. They found that compensatory mutations occurred at a second site (rather than a reversion) in 70% of cases.
They also highlighted intra-protein compensatory mutations that occurred in structurally-local
positions [66]. In an analysis of the same dataset, Davis et al. demonstrated that compensatory
mutations tended to occur near the deleterious mutation in sequence space [18].
im-ply that sequence changes affect the positions nearby in three-dimensional space. Yanofsky et al. postulated that a 36 amino acid segment separating the mutation from the suppressor
facilitated the contact between the two positions [82]. Fitch and Markowitz suggested that
the mutations showed “spatial correlation” was related to selectively neutral changes; for
ex-ample, two positions could accept a change in a selectively neutral manner provided that steric
hindrance was avoided [30]. Both hypotheses imply coevolution is likely to occur between
con-tacting positions in order to generate the compensatory change or alter the context surrounding
the positions in question.
When analyzing a multiple sequence alignment, the first characteristic typically examined
is conservation because a conserved amino acid that it is important to the enzyme’s ability
function [69]. Non-independent positions are clearly also important, but rather than imply an
important position, correlated mutations imply an important, conserved interaction [34]. We call this type of positional non-independence coevolution.
1.4.2
Coevolution
Coevolution occurs within proteins when two orthologous positions influence one another’s
ability to change over evolutionary time [30]. It is similar to the coevolution that is seen
between species, but it is amino acids influencing one another rather than organisms. At a
coarse level, coevolution between positions within a protein can be detected by a method that
identifies correlations between the positions. Essentially, one needs a method that takes a
multiple sequence alignment as input and outputs pairwise covariation scores, from which one
infers potentially coevolving positions. Unfortunately, correlation between positions within a
protein family is not the only source of covariation between positions in an alignment.
It is important to distinguish between covariation and coevolution as the terms are
some-times used interchangeably to the detriment of the comprehension of the reader. Coevolution is
the biological process through which two positions are actually influencing one another through
posi-tions within a protein. Covariation can imply coevolution, but there are other potential causes.
Atchley et al. suggested that the covariation signal in a protein could be broken down into
many components including phylogenetic, stochastic, structure, function, and interactions [8].
It is possible that even more components exist. For the purposes of identifying coevolution, the
stochastic and phylogenetic components are noise.
Ci j =Cphylogeny+Cstructure+Cf unction+Cinteractions+Cstochastic
1.4.3
Coevolution inference statistics
Many strategies exist for inferring intra-protein coevolution. The OMES method compares the
observed frequency of amino acid pairs with the expected frequency based on the positional
frequencies [52, 44]. OMES is a simple method that assumes that non-coevolving positions will
have pair frequencies match the expected pair frequencies based on each respective positional
frequency. This method is often a baseline tool that other tools are benchmarked against.
The McLachlin-based Substitution Correlation (McBASC) involves calculating a
substitu-tion matrix for each posisubstitu-tion[35]. The matrices can then be compared using a linear correlasubstitu-tion
to determine the extent to which each position covaries and the predicted likelihood that the
positions are in contact. While seemingly more sophisticated, practical evaluations show that
it performs approximately as well as OMES.
Statistical Coupling Analysis (SCA) is a perturbation-based covariance method proposed
by Lockless and Ranganathan [56]. Perturbation-based covariance methods are based on
sub-sampling the multiple sequence alignment and comparing results from the subsample with
results from the entire alignment. SCA produces statistical coupling energy, a measure of
co-evolutionary dependence. Dekker et al. noted that the “metaphorical energy” values were not
easily interpreted and thus, produced another perturbation-based covariance method, Explicit
Likelihood of Subset Covariation (ELSC). ELSC improved contact prediction accuracy over
SCA [21].
meaning that it is based on a phylogenetic tree. The principal innovation of CAPS is to remove
specific clades from the phylogenetic tree and recompute the coevolution analysis. If a pair
is no longer detected, they classified it as being due to phylogenetic covariation. There was
a division in the field as to whether phylogenetic tree information should be included in a
coevolution-inference. While it is additional information to add to the model, it is also an
additional source of error since phylogenetic trees of large numbers of sequences are
neces-sarily approximations and hypotheses. In practical benchmarks, tree-based methods did not
outperform tree-agnostic methods and thus I did not decide to include them in my own work.
Unlike pairwise methods, Direct-Coupling Analysis (DCA) involves calculating a global
statistical model [61]. While a global statistical model may seem more likely to produce
accu-rate results than a pairwise analysis, many pairwise methods apply corrections that incorpoaccu-rate
an alignment-wide analysis. Although DCA is a recent method and is considered by some to
be among the most accurate, the tool was benchmarked against a modified version of
uncor-rected MI that included gap characters as the 21st amino acid. I will discuss why this results
in poor quality predictions in chapter 4. Thus it is difficult to truly ascertain the accuracy of DCA. However, benchmarks results do not suggest that DCA significantly outperforms Zpx, described in chapter 5.
Finally, there is a class of coevolution-inference tools that are based on the concept of
Information Theory. Specifically, Mutual Information (MI) can be used to infer the dependence of two random variables, and thus can be used with various corrections to infer coevolution.
1.4.4
Mutual Information-based covariation
Mutual information is an Information Theoretic quantity [7, 15] on which many
coevolution-inferring statistics have been based:
MIi,j = Hi+Hj−Hi,j
case the probability (P) that an amino acid (x) appears at a position in the alignment.
Hi =−PP(xi)log20P(xi)
One of the most obvious problems in analyzing sequence alignment positions in a pairwise
manner is the availability of data, since there is often insufficient sequence variety available within a typical orthologous protein family to adequately identify the “true” probability of an
amino acid occurring at a given position. A “complete” multiple sequence alignment for a
given protein family would consist of every extant orthologous protein, at minimum. Such a
dataset would likely also need to contain all ancestral sequences of the extant dataset, and all
potential descendent sequences. Such a dataset is obviously impossible to collect. Practicality
requires an approximate solution which is found by using the frequency that an amino acid is
observed at a position in place of the probability of it occurring. A pairwise frequency table
for two potentially covarying positions contains 400 entries if all residues are equally likely. If
the two pairs are, in reality, equally and identically assorting, one would need many times that
number of sequences to establish the random assorting with confidence. Some estimates placed
the value needed to assess covariation confidently at greater than ten thousand non-unique
sequences; however, empirical observation shows that a practical minimum is approximately
125 sequences since the generation of reasonable contact prediction accuracy is possible with
that number of sequences [60].
One of the major limitations of MI is that Mutual Information scores form a continuous distribution and it is difficult to determine where a cutoffshould be drawn to differentiate the putatively coevolving pairs from those that are not coevolving. One strategy often used in
benchmarking is to ignore the absolute MI score, and instead rank all pairs byMI score and select some fraction of them as the putatively-coevolving pairs. Often the fraction is defined
by the length of the protein, under the assumption that longer proteins are more likely to have
more coevolving pairs. This method is acceptable for benchmarking because the concern is the
relative prediction accuracy of various methods. However, this method is not appropriate for
pairs exist within a protein family or whether it is some function of the length of the protein
family.
Korber et al. used uncorrectedMIto look for correlated mutations in a short, variable loop region of an HIV envelope protein and found a small set of correlated pairs of positions [50].
This work represents important first steps in the application of MI to coevolution-inference. This early work does not make reference to inter-residue contact and three-dimensional
struc-ture for validation. Instead, it attempts to link the putatively-coevolving residues with
func-tional importance. The authors comment on the generalizability to other protein families.
Clarke analyzed residues in the homeodomain protein family and created a correction to
account for the number of amino acid pairs between positions [13]. This work established the
importance of inter-residue contact as it features a number of strongly-covarying salt bridges.
However, this modified Mutual Information-based statistic yielded unexplained and likely
false-positive results as well. Clarke speculates that the results could be the result of either
statistical artifacts, or truly coevolving positions whose structural or functional role had yet to
be observed.
Atchley et al. usedMI to analyze basic helix-loop-helix (bHLH) protein family [8]. They asserted the importance of low entropy (ie. conserved) positions to the structure of the
then-242 sequence bHLH protein family. Furthermore, they used a parametric bootstrap procedure
to attempt to infer the probability that given covarying pair was covarying due to various
com-ponents of the linear model. For example, very strongly coevolving pairs had a low probability
of covarying predominantly due to the phylogeny component.
Tillier et al. created a correction for MI to compensate for the phylogenetic background component of covariation by only selecting pairs that covaried strongly with one another, but
not any other groups of positions[78]. This correction was effective at removing some some pairs that covaried due to shared phylogenetic signal; however, some true positive coevolving
pairs may have been removed by this correction, because it is possible that networks of truly
Fodor and Aldrich comparedMI(without corrections) to other established methods in 2004 and determined that MI predicted residue contact poorly. MI was slightly worse than SCA and much worse than both McBASC and OMES at predicting inter-residue contact in PFAM
alignments [31]. They observed that there was little agreement between predictions of the four
major coevolution-inference statistics, and proposed that this was because each method was
“filtering” the positions it analyzed based on conservation (ie. entropy).
Independently, a group at the University of Western Ontario observed that MI scores were
very dependent on the entropy of the positions. This is not surprising because positions that
show more variation are more able to show covariation; positions that do not vary cannot
co-vary, by definition. This is an unacceptable bias for protein alignment data, because many
po-sitions show conservation because of structural of functional constraints. A bias towards high
entropy positions obscures important coevolving pairs and a lower contact prediction accuracy
[60]. They employed a normalization for entropy that decreased the dependence on entropy
and increased protein structure prediction accuracy. Related work by Gloor et al. yielded
a dataset of high quality multiple sequence alignments [34] that were made in the
structure-based alignment tool Cn3D [40], the same tool used to create the Conserved Domain Database
[59]. This is an important development because the alignments found in public databases were
not of sufficient quality to yield reliable predictions with entropy-normalized MI.
Another limitation of uncorrected MI is its inability to account for the fact that all positions
within a protein covary to some degree because of their shared phylogenetic ancestry [8]. If
homologous, every single extant sequence in a family has evolved from a common ancestor.
If each sequence had been evolved independently, then there would be no background
phylo-genetic component. This background phylophylo-genetic covariation can obscure true coevolution
signal.
Dunn et al., also at the University of Western Ontario, provided a more sophisticated
cor-rection that superseded the entropy normalization by removing the phylogenetic covariation
![Figure 1.1: Alignment of triosephosphate isomerase created using Cn3D [40] and drawn us-ing Jalview [80]](https://thumb-us.123doks.com/thumbv2/123dok_us/7789680.1290182/25.612.100.530.72.602/figure-alignment-triosephosphate-isomerase-created-using-drawn-jalview.webp)
![Figure 1.2: Structure alignment of triosephosphate isomerase created and rendered in Cn3D[40]](https://thumb-us.123doks.com/thumbv2/123dok_us/7789680.1290182/32.612.116.505.89.466/figure-structure-alignment-triosephosphate-isomerase-created-rendered-cn.webp)