Attenuation Properties of Dusty Media
Using Mie Scattering Solution
Sami M. Sharif*
Abstract—A realistic model is developed to predict the specific attenuation when electromagnetic signals propagate through dusty media (dust storms). The model is based on Mie approximation for the scattering of electromagnetic signal by a spherical particle. Variation of the dust particles dimensions is considered in this model. Reliable published values for dust dielectric constant are used for computations over the frequency range from 2 GHz to 100 GHz, (i.e., S-band, X band, K-band, Ka-band, Ku-band and W-band). The model outcome is compared with the results from other models suggested in literature. The effect of air humidity on specific attenuation is also investigated.
1. INTRODUCTION
Microwave signal propagation through a medium containing precipitation such as dust and sand is affected in terms of attenuation and cross-polarization. This problem attracts considerable interest recently, due to the increasing number of terrestrial and satellite links in the regions that encounter dust and/or sand storms as well as many radar applications at high frequencies [1–6]. The general conclusion is achieved by different researchers that except in very rare instances, attenuation due to absorption and scatter is negligible for frequencies up to 30 GHz. Although severe dust/sand storms are not encountered frequently, in Sudan, they can result in severe alleviation of communication systems and unwanted clutter in radar systems operating at high frequencies [7].
It is well known that the attenuation of the microwave signals in dusty media arises from two physical mechanisms, which are (i) absorption and (ii) scattering of energy of the suspended dust particles. However, at higher frequencies, the scattering mechanism becomes more severe [8]. The computations of these effects require knowledge of electrical properties of the scattering particles in addition to some other mechanical properties such as particle shape and size. Different researchers derived models to predict the dusty media scattering properties and specific attenuation [9–14]. All models suffered from the lack of information about the dusty media dielectric constant and shape and size distribution of dust particles.
The main object of this paper is to derive a more realistic model for dusty media extinction (total cross-section efficiency factor) based on Mie solution. This model is used to determine and compute the specific attenuation at S-band, X-band, Ku-band, K-band, Ka-band and W-band, i.e., in the frequency range from 3 to 100 GHz.
In this work the term dusty medium is used to refer to air media with suspended dust particles with radii less than 60 microns [11].
Received 24 February 2015, Accepted 11 June 2015, Scheduled 10 July 2015
* Corresponding author: Sami M. Sharif ([email protected]).
2. TOTAL CROSS-SECTION EFFICIENCY FACTOR
Two models are published in literature for the analytical solution of Maxwell equations under the boundary conditions of the scattering of an electromagnetic wave by spherical dielectric particles. These models are (i) Rayleigh approximation and (ii) Mie solution. Both models based on spherical particle geometry [8].
Rayleigh model is derived from the assumption that ka < 1; i.e., the radius a of the dielectric particles is small compared with the wavelength, (kis the wavenumber = 2π/λand λthe wavelength). The extinction or total cross-section efficiency factor in the Rayleigh Model (approximation) is given by [15]:
σt=
8 3πa
2(ka)4+ 12
πa2(ka) ε
(ε−1)2+ (ε)2
ε−1
ε+ 2
2 (1)
where εis the dielectric constant (ε =ε +jε, and ε and ε are the real and imaginary parts of the relative dielectric constant of the particle respectively). Goldhirsh [16] developed a model for the total cross-section efficiency based on Raleigh approximation. In this model, the specific attenuation is given by:
Ad=
2.317×10⁻³ε
(ε+ 2)2+ε2.λ· 1
Vγ [dB/km] (2)
whereV is the visibility during the dust storm andγ a constant that depends on the distance from the point of origin of the storm, the type of soil and climatic conditions at the origin. γ = 1.07 is believed to be applicable to conditions in the Sudan [11]. Compared to Goldhirsh model in the present work a true distribution for the particle size distribution will be used. Generally in Raleigh model the fields inside the particle are not properly modelled, which may reduce the scattered field prediction accuracy. On the other hand, Mie solution does not face the limitation of particle size compared to the wavelength. Thus, this model is more suitable for predicting the scattering properties at high frequencies, although it needs more computing power. The present work tries to overcome this limitation by considering my approximation, especially at high frequency. Mie solution expresses the total cross-section efficiency (extinction), σt, for a spherical dielectric particle by [29]:
σt= λ
2
2π(ka)
3
c1+c2(ka)2+c3(ka)3
(3)
The constants c1,c2 and c3 depend on the particle dielectric constant (ε=ε+jε) and are given by:
c1=
6ε
(ε+ 2)2+ (ε)2 (4a)
c2=ε
⎧ ⎪ ⎨ ⎪ ⎩ 6 5
7 (ε)2+ 7 (ε)2+ 4ε−20
(ε+ 2)2+ (ε)2
2 + 1 15 + 5 3
(2ε+ 3)2+ 4 (ε)2
⎫ ⎪ ⎬ ⎪ ⎭ (4b)
c3=
4 3 ⎧ ⎪ ⎨ ⎪ ⎩
(ε−1)2(ε+ 2) + [2 (ε−1) (ε+ 2)−9] + (ε)4
(ε+ 2)2+ (ε)2
2 ⎫ ⎪ ⎬ ⎪ ⎭ (4c)
As mentioned above in (3) and (4) k is the wavenumber = 2π/λ, λ the wavelength, ε the dielectric constant and athe particle equivalent radius. This relation is valid under the condition that ka <1.
Using Mie solution to model the dusty media specific attenuation needs to know the dust dielectric constant and particles size. These parameters will be discussed in the following sections.
Islam et al. developed a model to predict the dust storm specific attenuation based on Mie approximation, which is given as in [17]:
Ad= aef
V
where ae is the equivalent particle radius in meters, V the visibility in km, f the frequency in GHz,
and x, y and z are constants whose values depend on the dust dielectric constant. The limitation of this model is that it used a single value for the dust particle radius to estimate the specific attenuation; generally, the dust equivalent radius varies over a wide range, as will be shown in this paper.
3. DUSTY MEDIA DIELECTRIC CONSTANT
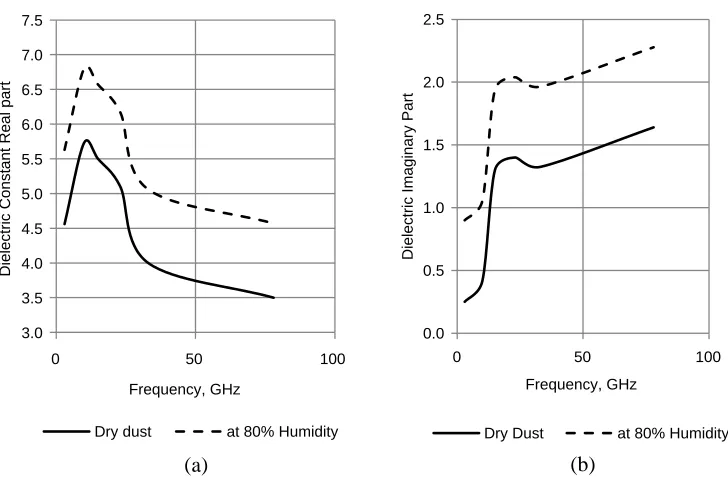
Different values are reported in literature for the dielectric constant of dust. These values were measured by different techniques at different frequency bands and experimental conditions [18, 20]. Reviewing the reported dielectric constant values and the techniques used to obtain them, one can conclude that many of the measurements may be considered as inaccurate due to the technique used and the way adapted to prepare and collect the samples. In this study, the dielectric constant values shown in Table 1 are used to compute the dusty media specific attenuation. However, the values shown in Table 1 are seen to be the most accurate and reasonable values reported in the literature.
Measurements on dust samples collected in Khartoum, Sudan, show that in air with 82% relative humidity, dust absorbs 5.1% by weight moisture [21]. Moisture content of dust seriously increases
Table 1. Dust dielectric constant.
Band Dielectric Constant Reported by Dry Media Humid Media∗
S 4.56 +j0.251 5.63 +j0.90 Gobrial [19] X 5.73 +j0.415 6.80 +j1.054 Sharif [21] Ku 5.50 +j1.300 6.57 + 1.939 Ruike et al. [20]
K 5.10 +j1.400 6.17 +j2.039 Ruike et al. [20] Ka 4.00 +j1.325 5.06 +j1.964 Ruike et al. [20] W 3.50 +J1.64 4.57 + 2.278 Ruike et al. [20]
∗ Humid media dielectric constant calculated using (6).
3.0 3.5 4.0 4.5 5.0 5.5 6.0 6.5 7.0 7.5
0 50 100
Dielectric Constant Real part
Frequency, GHz
Dry dust at 80% Humidity
0.0 0.5 1.0 1.5 2.0 2.5
0 50 100
Dielectric Imaginary Part
Frequency, GHz
Dry Dust at 80% Humidity
(a) (b)
the dust dielectric constant [18]. The dust dielectric constant in air with H% relative humidity (εH =εH +jεH) is as shown in [21]:
εH =ε+ 0.04H−7.78×10⁻⁴H2+ 5.56×10⁻⁶H3 (6a)
εH =ε+ 0.02H−3.71×10⁻⁴H2+ 2.76×10⁻⁶H3 (6b)
whereε+jε is the dry dust dielectric constant.
In this paper, specific attenuation is computed at dry and humid dusty media. In humid dusty media, the relative humidly of the air is taken to be 80%. The dust dielectric constant at this humidity is presented in Table 1.
The variation of the dielectric constant with frequency is shown in Figures 1(a) and 1(b). The dust dielectric constants under humid media condition are estimated using the above values and equations. It is worth here to note that in general the dielectric constant spectrum is not continuous. It has peaks and drops at some frequencies. However, in this work a continuous dielectric constant is assumed.
4. DUST PARTICLE SIZE DISTRIBUTION
Many of the published works that concern with the prediction of dusty media specific attenuation suffer from the lack of information about dust particles size distribution (PSD), i.e., the fractional distribution of particles of different size. This parameter is essential in the prediction of the specific attenuation, as shown in the next section. The dust’s particles-size distributions reported in literature [22–24] vary considerably, and a clear pattern can be predicted.
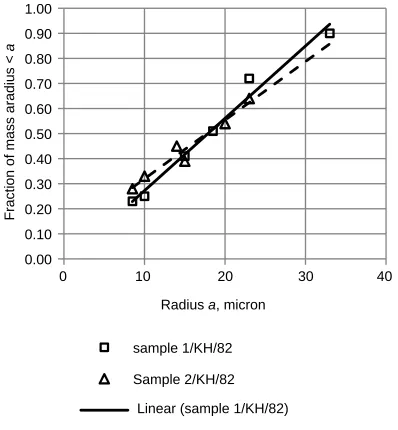
Measurements on ten dust samples collected from northern and central Sudan show that the dust PSD commutative curves, f(a), can be approximated to a high degree of accuracy by the straight line equation [25]; i.e.,
f(a) =ς+a (7)
whereais the equivalent radius of the dust particle. Figure 2 shows the PSD commutative probability function for two samples collected at Khartoum. Measurement shows that the constants ς and vary over a wide range. The value of ς is always within the range of 0.0258 to 0.392 microns, and has an average value of 0.0298 micron. On the other hand, the constant is always within the range of 0.3505 to−0.0141 and has an average value of−0.1198. The average equivalent radius of dust is found to vary from 0.2 to 18 microns, with an average value of 5.7 microns [21].
0.00 0.10 0.20 0.30 0.40 0.50 0.60 0.70 0.80 0.90 1.00
0 10 20 30 40
Fraction of mass aradius <
a
Radius a, micron
sample 1/KH/82 Sample 2/KH/82
Linear (sample 1/KH/82) Linear (Sample 2/KH/82)
The results obtained for the Sudan mentioned above indicate that dust particles may have an equivalent radius ae (the radius of a circle the area equal to the area of two-dimensional projection of
the particle) is in the range 0.1 < D < 150 microns. Haddad et al. [22] reported that dust samples collected in Iraq had a mean radius of 67 microns. This mean is large compared with the Sudan samples, which have a mean radius less than 25 microns. Bogland [23] pointed out that sand storms may contain particles with equivalent radius in the range from 40 to 150 microns, with an average value of 75 microns, while dust storms contain partic1es with radius less than 50 microns. Gillete [24] found that particles with radius less than 10 microns composed a small fraction of the airborne particles.
Using (7), the particle number fraction distribution (or particle probability) function is given by:
n(a) = ξ
a3 (8)
where the constant is given by
ξ= amaxamin
amax−amin
(9)
where amax is the largest radius and amin the smallest radius in the dusty medium. Measurement carried out by the present authors [25] shows that dust has a minimum average equivalent radius of 1.56 microns, and an average maximum diameter is 18.83 microns. Using these values, the number fraction distribution is given by:
n(a) = 1.704×10
−6
a3 (10)
5. DUSTY MEDIA SPECIFIC ATTENUATION
Generally, the attenuation due to dust storms can be explained in terms of scattering cross-section of a single particle [15]. The total attenuation, AT, introduced by dust storms over a link of length L is
given by:
AT =
L
x=0
Apdx[dB] (11)
whereAp is the dusty medium specific attenuation. This parameter depends on the total cross-section
efficiency factor of the medium,σt, and is given by:
Ap = 4.343×10³
rmax
r=rmin
σt(a)·N(a)da[dB/km] (12)
where N(a)da is the number of dust particles whose equivalent radius lies between a and a+da, and
σt(a) is the total cross section efficiency factor of dust particles with equivalent radiusa. n(a)dais the
fraction of the total particles formed by the particles N(a)da; i.e., n(a)da=N(a)da/NT.
By relating the number of dust particles to the particles number fraction distribution function and by using (10), one can write:
amax
a=amin
σt(a)·N(a)da= 1.704×10⁻⁶NT
amax
a=amin
σt(a)·
1
a3da (13)
Using (3), the integral of the LHS of (13) becomes
rmax
r=rmin
σt(a)·
1
r3da=
(2π)2
λ
c1+c2k2+c3k3
(14)
where:
c1=c1(amax−amin) = 1.727×10⁻⁵c1 (15a)
c2=
c2
3
a3max−a3min
= 2.224×10⁻¹⁵c2 (15b)
c3=
c3
4
a4max−a4min
Since the size of dust particles varies over a wide range [25], the dust relative volume,v, is given by:
v= π
6NT
a
amin
n(a)a3da
Using (10), one gets
v = π
6NTζ(amax−amin) = 9.044×10
−6N
T ⇒NT = 1.106×10⁵v (16)
Also the dust relative volume is related to the visibility,V, of the dusty media by [13]:
v= 9.43×10−
9
V1.07 (17)
Using (16) and (17) the total number of dust particles in the media is related to media visibility by:
NT = 9 v
.044×10−6 =
1.0427×10⁻¹³
V1.07 (18)
Substitute (14) and (18) in (13), the dusty media specific attenuation is given by:
Ap= 4.343×10³
1.0427×10⁻¹³
V1.07
(2π)2
λ
c1+c2k2+c3k3
(19)
Ap= 1.789×10⁻⁸
1
V1.07
1
λ
c1+c2k2+c3k3
(20)
Ap=
1
V1.07
c1f +c2f3+c3f4
(21)
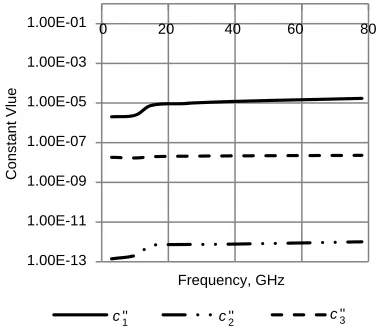
wherec1,c2 and c3 are constants and given by:
c1 = 3.33c1 = 5.757×10⁻⁵c1 (22a)
c2 = 1463.3c2 = 3.255×10⁻¹²c2 (22b)
c3 = 9.198×10¹²c3 = 3.853×10⁻⁷c2 (22c) Figure 3 shows the variations of these constant with frequency; it is clear that the constant c3 is not sensitive to the frequency, while the constant c1 is the most frequency dependent parameters. The dependency of these constants on the frequency is reduced at high frequencies.
1.00E-13 1.00E-11 1.00E-09 1.00E-07 1.00E-05 1.00E-03
1.00E-01 0 20 40 60 80
Frequency, GHz
c''
Constant Vlue
1 c''2 c''3
Figure 3. Specific attenuation model constants.
0.000 0.005 0.010 0.015 0.020 0.025 0.030 0.035
0 20 40 60 80
V=1 km V=2 km
V=3 km V=5 km
0.00 0.01 0.01 0.02 0.02 0.03 0.03 0.04
0 20 40 60 80
Specific Attenuation, dB/km
Frequency, GHz
wet, V=1 km wet, V=5 km dry, V=1 km dry, V=5 km
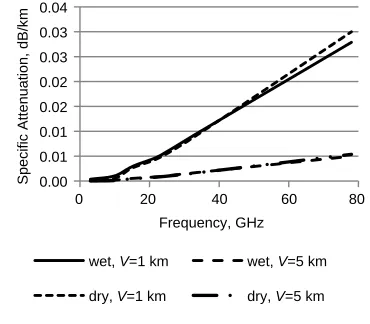
Figure 5. Effect of humidity on specific attenuation.
0.001 0.010 0.100 1.000
0 2 4 6
Specific Attenuation, dB/km
Visiblity , Km
Present Rfiqul Goldhirsh Measured
Figure 6. Comparison to different models and measured values.
6. SPECIFIC ATTENUATION COMPUTATION
The mentioned model is used to predict the specific attenuation introduced by dust storms under different climatic conditions and visibilities. Figure 4 shows the variation of the specific attenuation parameter with frequencies over the range from 3 to 80 GHz, for different values of visibilities. It is clear that the attenuation increases with frequency, while reduced for good visibilities. Figure 5 shows the predicted values of the specific attenuation for dry and humid conditions, i.e., air with 80% humidity. The attenuation is determined for 1 km and 5 km visibilities. Although the dielectric constant of dust is seriously affected by humidity, the humidity effect on attenuation is negligible and can be ignored without affecting the link performance.
7. FURTHER COMMENT
Measurements were carried out at Khartoum on 15 km link operated at 13 GHz (Ku-band) with visibility less than 5 km, and at Riyadh, Saudi Arabia on 40 GHz microwave link of length 14 km [26, 27]. Figure 6 shows the measured values of the dust specific attenuation for visibility less than 5 km. In the same figure, the predicted values of the specific attenuation are given as predicted by the present model, Goldhirsh model, and Islam et al. model at 10 GHz frequency. It is clear that Islam model underestimates the specific attenuation values, due to the single radius value used in this model; the model computations are based on the average equivalent radius and do not take account of the variation in the dust particles radius. Goldhirsh model and the present model both gave prediction in good agreement with the measured values. However, the deviation of the models’ results from the measured values may be due to the assumption of spherical particles on which these models are based. Generally, the shape of dust particles is random and cannot be described by any simple geometry [28]. It is worth to notice from the Figure 6 that there is a sharp drop of the measured data around visibility 1.3 km distinctly, and this drop may be because the attenuation is inversely proportional to the visibility, and the large particles disappear rapidly at visibility better than 1 km [5].
Figure 7 presents the specific attenuation as predicted by the present model and Goldhirsh model, at low frequencies less than 40 GHz, and the outcomes of the two models agree in a good manner. However, at higher frequency, the prediction obtained by Goldhirsh model is associated with a large deviation due to inherent limitation of the assumptions used in the Rayleigh scattering, i.e., the fields inside the particle are not properly modeled [15].
In Sudan, the average total annum time visibility with value less than V m, F(V) can be approximated by the following exponential function [5]:
0.00 0.20 0.40 0.60 0.80 1.00
0 20 40 60 80
specific attenuation
Frequency, GHz
Present, 1 km Goldhirsh, 1 km
presnt, 5 km Goldhirsk, 5 km
Figure 7. Present model and Goldhirsh model.
0.00 0.20 0.40 0.60 0.80 1.00 1.20 1.40
Annum Time Percentage Specific Attenuation <
Ad
Specific Attenuation, A , dB/kmd
0 2 4 6 8 10 12
Figure 8. Annum values of specific attenuation due to dust storms in Sudan.
F(V) is the time in hours of the annum, where visibility is less than a given visibility V. It is noted that from this relation, the visibility is less than 1 km for about 0.8% of the time per annum. Using this relation in (9), Figure 8 shows that the total percentage of annum time specific attenuation is less thanAd (at X-band, i.e., 10 GHz frequency) in Sudan.
8. CONCLUSIONS
A mathematical model based on the Mie scattering approximation is developed to predict the specific attenuation introduced by dust storm, over microwave links. The model takes account of the variation in the radius of dust particles, found to have a straight line commutative distribution. Published values for dust dielectric constants in the frequency range of interest are used in the computations. The model outcomes are in good agreement with measured values. The values obtained by the models based on Rayleigh approximation, however, at high frequencies, are greater than 40 GHz, and the models based on Rayleigh approximation are associated with a large deviation due to inherent limitation of the assumptions used in Rayleigh scattering. The effect on the air humidity on the specific attenuation was found to be small and can be ignored. However, a more realistic model needs to take account of the large variation in dust particles size and geometry, which need more investigation and study.
REFERENCES
1. Vyas, M., P. Tomar, S. Rankawat, and D. R. Godara, “Effect of sand and dust storms on millimeter wave propagation signals in western Rajasthan region at 35 GHz,”International Journal of Scientific Research And Education, Vol 2, No. 11, 2457–2462, 2014.
2. Dong, Q., Y.-L. Li, J. Xu, H. Zhang, and M. Wang, “Backscattering characteristics of millimeter wave radar in sand and dust storms,”Journal of Electromagnetic Waves and Applications, Vol. 28, No. 9, 1075–1084, 2014.
3. Harb, K., S. Abdillah, and S. Abdul-Jauwad, “Dust & sand (DUSA) storms impact on LEO satellite microwave radio links,” 2014 7th Advanced Satellite Multimedia Systems Conference and the 13th
Signal Processing for Space Communications Workshop (ASMS/SPSC), 442–447, 2014.
5. Sharif, S. M., “Dust storms properties related to microwave signal propagation,” University of Khartoum Engineering Journal, Vol. 1, No. 1, 2011.
6. Bong, Q. F., J. I. D. Xu, Y. L. Li, H. Zhang, and M. J. Wang, “Calculation of microwave attenuation effect due to charged sand particles,”Journal of Infrared, Millimeter and Terahertz Waves, Vol. 32, No. 1, 55–63, 2010.
7. Sharif, S. M., “Clutter and backscattering of dust storms at the X-band,” Sudan Engineering Society Journal, Vol. 41, No. 34, 31–36, 1997.
8. Brussaard, G. and P. A. Watson, Atmospheric Modelling and Millimeter Wave Propagation, Ghapman & Hall, UK, 1995.
9. Ansari, A. J. and B. G. Evans, “Microwave propagation in sand and dust storms,”IEE Proceedings F (Communications, Radar and Signal Processing), Vol. 129, No. 5, 315–322, 1982.
10. Bashir, S. O. and N. J. McEwan, “Microwave propagation in dust storms: A review,” IEE Proceedings H (Microwaves, Antennas and Propagation), Vol. 133, No. 3, 241–247, 1986.
11. Ghobrial, S. I. and S. M. Sharif, “Microwave attenuation and cross polarization in dust storms,”
IEEE Transactions on Antennas and Propagation, Vol. 35, No. 4, 418–425, 1987.
12. Goldhirsh, J., “A parameter review and assessment of attenuation and backscatter properties associated with dust storms over desert regions in the frequency range of 1 to 10 GHz,” IEEE Transactions on Antennas and Propagation, Vol. 30, No. 6, 1121–1127, 1982.
13. Ahmed, S., A. A. Ali, and M. A. Alhaider, “Airborne dust size analysis for tropospheric propagation of millimetric waves into dust storms,” IEEE Trans. on Geoscience and Remote Sensing, Vol. 25, No. 5, 593–599, 1987.
14. Islam, M. R., Z. E. Elshaikh, O. Khalifa, A. H. M. Zahirul Alom, and S. Khan, “Fade margin analysis due to duststorm based on visibility data measured in a desert,” American Journal of Applied Sciences, Vol. 7 No. 4, 551–555, 2010.
15. Collin, R. E.,Antenna and Radiowave Propagation, McGraw-Hill, 1985.
16. Goldhirsh, J., “Attenuation and backscatter from derived two-dimensional duststorm model,”IEEE Transactions on Antennas and Propagation, Vol. 49, No. 12, 1703–1711, 2001.
17. Islam, M. R., Z. E. Elshaikh, O. Elshaikh, O. O. Khalifa, A. H. M. Zahirul Alam, S. Khan, and A. W. Naji, “Prediction of signal attenuation due to duststorms using Mie scattering,” IIUM Engineering Journal, Vol. 11, No. 1, 71–87, 2010.
18. Ghobrial, S. I., “Effect of hydroscopic water on dielectric constant of dust at X-band,” Electronics Letters, Vol. 16, No. 10, 393–394, 1980.
19. Sharif, S. M. and S. I. Ghobrial, “X-band measurements of dust dielectric constant,” Proc. IRSI Commission F, Symp., 143–147, Belgium, 1983.
20. Yang, R., Z. Wu, and J. You, “The study of MMW and MW attenuation considering multiple scattering effect in sand and dust storms at slant paths,” International Journal of Infrared and Millimeter Waves, Vol. 24, No. 8, Aug. 2003.
21. Sharif, S. M., “Chemical and mineral composition of dust and its effect on dielectric constant,”
IEEE Trans. on Geosciences and Remote Sensing, Vol. 33, No. 2, 353–359, 1995.
22. Haddad, S., M. J. Salman, and R. K. Jha, “Effect of dust/sandstorms on some aspects of microwave propagation,”Proc. URSI Commission F Symposium, ESA Publication SP-194, 113–116, Louvain-la-Neuve, Belgium, 1983.
23. Bogland, R. A., Physics of Blown Sand and Desert Dunes, Methuen, London, 1971..
24. Gillete, D. A., “On the production of soil wind erosion aerosols having the potential for long range transport,”J. Rech. Atmos, B, 735–744, 1974.
25. Sharif, S. M., “Dust particle-size distribution,” International Geosciences and Remote Sensing
Symp., IGARRS’87, Ann Arbon, Michigan, USA, 1987.
27. Elshaikh, Z. E. O., M. R. Islam, O. O. Khalifa, and M. J. E. Salami, “Duststorm measurements for the prediction of attenuation on microwave signals in Sudan,” International Conference
on Computer and Communication Engineering 2008 (ICCCE 08), 1181–1185, Kuala Lumpur,
May 2008.
28. Ghobrial, S. I., S. M. Sharif, M. E. Ateem, and M. El Tigani, “Dust storms in Sudan: Intensity and particles; characteristics,” Proc. Jordan IEEE’85 Conf., 326–328, Jordan, 1985.