Scholarship@Western
Scholarship@Western
Electronic Thesis and Dissertation Repository
11-29-2016 12:00 AM
Leveraging Smartphone Sensor Data for Human Activity
Leveraging Smartphone Sensor Data for Human Activity
Recognition
Recognition
Xizhe Yin
The University of Western Ontario
Supervisor Weiming Shen
The University of Western Ontario Joint Supervisor Xianbin Wang
The University of Western Ontario
Graduate Program in Electrical and Computer Engineering
A thesis submitted in partial fulfillment of the requirements for the degree in Master of Engineering Science
© Xizhe Yin 2016
Follow this and additional works at: https://ir.lib.uwo.ca/etd
Part of the Computer Engineering Commons, and the Electrical and Computer Engineering Commons
Recommended Citation Recommended Citation
Yin, Xizhe, "Leveraging Smartphone Sensor Data for Human Activity Recognition" (2016). Electronic Thesis and Dissertation Repository. 4292.
https://ir.lib.uwo.ca/etd/4292
This Dissertation/Thesis is brought to you for free and open access by Scholarship@Western. It has been accepted for inclusion in Electronic Thesis and Dissertation Repository by an authorized administrator of
Using smartphones for human activity recognition (HAR) has a wide range of applications
including healthcare, daily fitness recording, and anomalous situations alerting. This study
fo-cuses on human activity recognition based on smartphone embedded sensors. The proposed
human activity recognition system recognizes activities including walking, running, sitting,
going upstairs, and going downstairs. Embedded sensors (a tri-axial accelerometer and a
gy-roscope sensor) are employed for motion data collection. Both time-domain and
frequency-domain features are extracted and analyzed. Our experiment results show that time-frequency-domain
features are good enough to recognize basic human activities. The system is implemented in
an Android smartphone platform.
While the focus has been on human activity recognition systems based on a supervised
learning approach, an incremental clustering algorithm is investigated. The proposed
unsuper-vised (clustering) activity detection scheme works in an incremental manner, which contains
two stages. In the first stage, streamed sensor data will be processed. A single-pass
cluster-ing algorithm is used to generate pre-clustered results for the next stage. In the second stage,
pre-clustered results will be refined to form the final clusters, which means the clusters are
built incrementally by adding one cluster at a time. Experiments on smartphone sensor data
of five basic human activities show that the proposed scheme can get comparable results with
traditional clustering algorithms but working in a streaming and incremental manner.
In order to develop more accurate activity recognition systems independent of smartphone
models, effects of sensor differences across various smartphone models are investigated. The
impairments of different smartphone embedded sensor models on HAR applications are
pre-sented. Outlier removal, interpolation, and filtering in pre-processing stage are proposed as
mitigating techniques. Based on datasets collected from four distinct smartphones, the
pro-posed mitigating techniques show positive effects on 10-fold cross validation, device-to-device
validation, and leave-one-out validation. Improved performance for smartphone based human
activity recognition is observed.
With the efforts of developing human activity recognition systems based on supervised
learning approach, investigating a clustering based incremental activity recognition system
with its potential applications, and applying techniques for alleviating sensor difference effects,
a robust human activity recognition system can be trained in either supervised or unsupervised
way and can be adapted to multiple devices with being less dependent on different sensor
spec-ifications.
Keywords: Activity recognition, supervised learning, sensors, incremental clustering, fil-ter, interpolation, outliers
I would like to express my foremost gratitude to my advisor, Dr. Weiming Shen, for his
invaluable guidance and support throughout my master’s studies. I want to thank him for giving
me freedom to pursue research topics that I am interested in, and being helpful and supportive
whenever I need advice. His insights motivated me through my studies.
I own my sincere thanks to my co-advisor, Dr. Xianbin Wang. Besides his valuable
sug-gestions and continuous help on the research topic, he shared advices on my future career and
encouraged me to look around for today’s industrial demands.
I would like to thank examiners Dr. Abdallah Shami, Dr. Jagath Samarabandu, and Dr.
Evgueni Bordatchev for taking the time to review my thesis and provide valuable suggestions.
I would like to thank peer students in Dr. Wang’s group, and other professors and students
in the ECE department at University of Western Ontario.
Finally I thank my family for giving me unconditional love, support, and encouragement
all the time.
Certificate of Examination i
Abstract i
List of Figures vi
List of Tables viii
List of Abbreviations ix
1 Introduction 1
1.1 Sensor based Human Activity Recognition . . . 1
1.2 Research Motivations . . . 4
1.3 Research Objectives . . . 4
1.4 Contributions . . . 5
1.5 Thesis Organization . . . 6
2 Background and Literature Review 8 2.1 Data Mining and Machine Learning . . . 8
2.1.1 Classification Algorithms . . . 9
Decision Tree (DT) . . . 9
Naive Bayes . . . 10
k-Nearest Neighbors (kNN) . . . 11
Support Vector Machines (SVMs) . . . 12
Artificial Neural Networks (ANNs) . . . 14
2.1.2 WEKA Machine Learning Framework . . . 16
The WEKA Workbench . . . 16
Core of WEKA . . . 18
WEKA API . . . 20
2.2 Human Activity Recognition based on Supervised Learning . . . 20
2.2.2 Human Activity Recognition Based on the Combination
Accelerome-ters and Other Types of Sensors . . . 23
2.2.3 Human Activity Recognition Based on Smartphone Sensors . . . 24
2.2.4 Other Smartphone Based Sensing Systems . . . 25
2.3 Human Activity Recognition based on Unsupervised Learning . . . 26
2.4 Summary . . . 27
3 Human Activity Recognition Based on Supervised Learning 28 3.1 Introduction . . . 28
3.2 Data Collection . . . 29
3.3 Feature Extraction . . . 31
3.3.1 Time-domain Features . . . 31
3.3.2 Frequency-domain Features . . . 31
3.3.3 Feature Selection . . . 32
3.4 Classification . . . 33
3.5 Experimental Results and Analyses . . . 33
3.5.1 Experiment Setup . . . 33
3.5.2 Result Analyses . . . 35
3.5.3 Extension . . . 42
3.6 Summary . . . 44
4 Incremental Clustering for Human Activity Recognition 46 4.1 Introduction . . . 46
4.2 Methodology . . . 47
4.2.1 Data Collection . . . 47
4.2.2 Feature Extraction . . . 47
4.2.3 Activities . . . 47
4.2.4 The Proposed Two-stage Clustering Algorithm . . . 48
4.3 Experimental Results and Analyses . . . 56
4.3.1 Incremental Clustering Results . . . 56
4.3.2 Different numbers of initial points . . . 57
4.3.3 Different window sizes . . . 57
4.4 Summary . . . 59
5 Sensor Heterogeneity Effects 60
5.2.1 Data Collection on Multiple Devices . . . 62
5.2.2 Feature Extraction . . . 63
5.2.3 Classification and Evaluation . . . 63
5.2.4 Results on Original Datasets . . . 64
5.3 Mitigating Techniques for Sensor Differences . . . 66
5.3.1 Sensor Differences . . . 67
5.3.2 Possible Mitigating Techniques . . . 69
5.3.3 Result Analyses and Discussions . . . 70
5.4 Summary . . . 75
6 Conclusions and Future work 76 6.1 Conclusions . . . 76
6.2 Future Work . . . 77
Bibliography 79
Curriculum Vitae 84
2.1 The maximum margin, where the margin is defined as the perpendicular
dis-tance between the decision boundary . . . 13
2.2 A model of a neuron or node that forms a weighted sum of M inputs and output the result through a nonlinearity . . . 15
2.3 Example for the two-layer neural network . . . 16
2.4 The WEKA Explorer GUI . . . 17
3.1 Activity recognition process . . . 29
3.2 The definition of the coordinate-system in Android [1] . . . 30
3.3 The sensor data collection app (left) and the recognition app (right) . . . 30
3.4 Raw acceleration data . . . 34
3.5 Raw gyroscope data . . . 34
3.6 J48 decision tree (1 for walking, 2 for running, and 3 for sitting) . . . 37
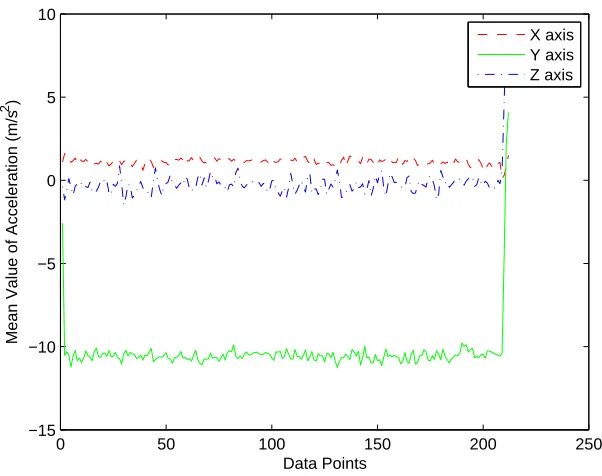
3.7 The mean values of accelerator data for Walking . . . 37
3.8 The mean values of accelerator data for Running . . . 38
3.9 The mean values of accelerator data for going upstairs . . . 38
3.10 The mean values of accelerator data for going downstairs . . . 39
3.11 The mean values of accelerator data for Sitting . . . 39
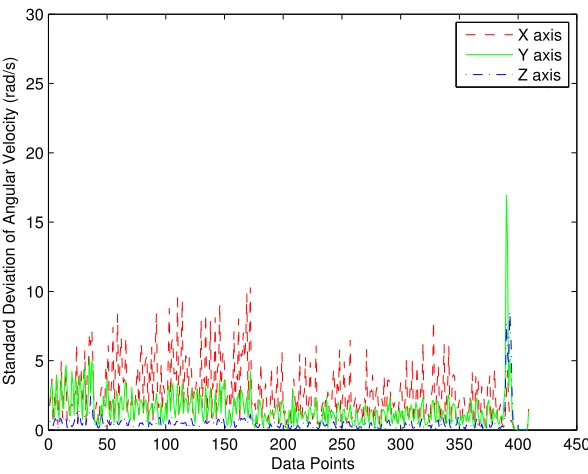
3.12 The standard deviation of angular velocity for Walking . . . 40
3.13 The standard deviation of angular velocity for Running . . . 40
3.14 The standard deviation of angular velocity for going upstairs . . . 41
3.15 The standard deviation of angular velocity for going downstairs . . . 41
3.16 The standard deviation of angular velocity for Sitting . . . 42
4.1 Data visualization for the mean value of accelerometer . . . 48
4.2 Data visualization for the standard deviation of accelerometer . . . 49
4.3 Proposed framework . . . 50
4.4 The flowchart of the first stage clustering . . . 54
4.5 The flowchart of the second stage clustering . . . 55
4.6 The effect of different m, whenn=20 . . . 58
5.1 The performance evaluation on time-domain features . . . 65
5.2 The performance evaluation on frequency-domain features . . . 66
5.3 The box plots of acceleration offset in X-axis . . . 68
5.4 The box plots of gyroscope offset in X-axis . . . 68
5.5 Activity recognition performance using outlier removal . . . 71
5.6 Activity recognition performance using linear interpolation . . . 71
5.7 Activity recognition performance using low-pass filter . . . 72
5.8 Activity recognition performance using C4.5 decision tree classifier . . . 72
5.9 Activity recognition performance using SVM classifier . . . 73
5.10 Activity recognition performance using random forest classifier . . . 73
5.11 Activity recognition performance using Naive Bayes classifier . . . 74
5.12 Activity recognition performance using multilayer perceptron classifier . . . 74
1.1 Activity detection applications in the market . . . 2
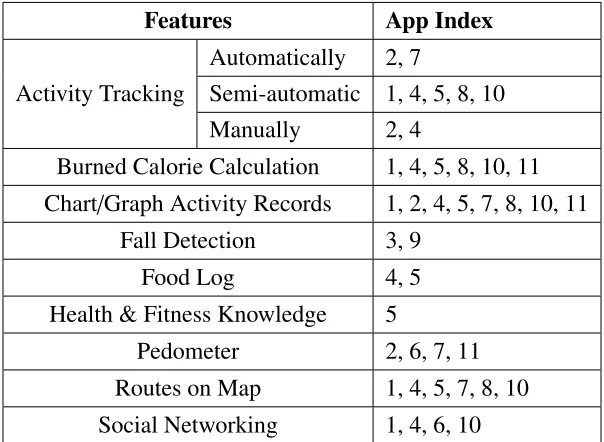
1.2 Product Features (the app index is shown in Table 1.1) . . . 3
3.1 Features extracted . . . 32
3.2 The Training Set . . . 35
3.3 Classification Results Using 12 Features . . . 36
3.4 Classification Results Using 12 Features for 5 Activities . . . 43
3.5 Confusion Matrix of J48 Classifier . . . 44
3.6 Classification Results Using Frequency Domain Features . . . 44
4.1 Dataset Overview . . . 56
4.2 Performance . . . 57
5.1 Phone Sensors Information . . . 63
5.2 Evaluation Matrix on Original Datasets for Random Forest (in F-Measure) . . 65
ANN
Artificial Neural Network
API
Application Program Interface
BMR
Basal Metabolic Rate
BSN
Body Sensor Network
CRF
Conditional Random Field
DT
Decision Tree
ECG
Electrocardiogram
FFT
Fast Fourier Transform
GMM
Gaussian Mixture Model
GPS
Global Positioning System
HAR
Human Activity Recognition
HMM
Hidden Markov Model
ID3
Iterative Dichotomiser 3
IMU
Inertial Measurement Unit
KNLR
Kernel Nonlinear Regression
kNN
k-Nearest Neighbor
LPF
Low Pass Filter
MEMS
Microelectromechanical Systems
MLP
Multilayer Perceptron
NB
Naive Bayes
PT
Postural Transition
ROC
Receiver Operating Characteristic
SMA
Signal Magnitude Area
SVM
Support Vector Machine
WEKA
Waikato Environment for Knowledge Analysis
Introduction
1.1
Sensor based Human Activity Recognition
A Human Activity Recognition (HAR) system can automatically recognize physical
activi-ties [2], which is a key research issue in mobile and ubiquitous computing. An HAR system
performs tasks of recognizing different human daily activities from simple to complex. The
sensors involved in an HAR system can be video sensors, inertia sensors, and environment
sensors. The GPS receiver can also be used for activity recognition but is limited to outdoor
environments.
Based on the installation of sensors, HAR systems can be divided into three categories:
wearable devices based sensing systems, smartphone sensing systems, and smart living
envi-ronments. Although wearable devices and smart living environments can deliver good
activ-ity detection results, smartphone based applications are an increasingly prominent solution as
smartphones have become an indispensable part of our daily life. Especially with the rapid
evolution of hardware, ever-increasing computing and networking capacity, and rich
embed-ded sensors, smartphone based HAR systems can tell us different kinds of human activities in
real time using machine learning techniques. In addition, using smartphones for human
activ-ity recognition has a wide range of applications including healthcare, daily fitness recording,
anomalous situation alerting, personal biometric signature identification, and indoor
localiza-tion and navigalocaliza-tion. All this benefits from the fast development of mobile phone software and
hardware.
Smartphones in the market have embedded sensors, and the advanced MEMS
(micro-electro-mechnical systems) design has enabled low-power and high-quality sensors for mobile
sensing. The best-known MEMS sensors in smartphones are accelerometer and gyroscope, but
there are a lot more MEMS sensors in today’s mobile device like electronic compass, pressure
sensor, light sensor, and microphone.
In the Android environments, the most commonly used and installed sensors can be
cate-gorized as follows [3]:
• Motion sensors: the motion sensors are based on inertial force.
• Environmental sensors: these sensors measure environmental parameters, like
tempera-ture and pressure, using barometers or thermometers.
• Position sensors: these sensors include orientation sensors and magnetometers,
measur-ing the physical position of the device.
There are already plenty of mobile sensing applications in Google’s Play store (updated in
April 2016, shown in Table 1.1). Some of the apps incorporate other smart devices like bands
and watches.
Index Vendor App Name Downloads
1 FitnessKeeper Inc. Runkeeper-GPS Track Run Walk 10,000,000
2 Google Inc. Google Fit 10,000,000
3 ITER S.A Fade: fall detector 5,000
4 MapMyFitness Inc. Map My Fitness Workout Trainer 1,000,000
5 Microsoft Corporation Microsoft Health 100,000
6 Noom Inc. Noom Walk Pedometer 5,000,000
7 ProtoGeo Moves 1,000,000
8 Runtastic Runtastic Running & Fitness 10,000,000
9 Hamideh Kerdegari Smart Fall Detection 1,000
10 Strava Inc. Strava Running and Cycling GPS 5,000,000
11 tayutau Pedometer 10,000,000
Table 1.1: Activity detection applications in the market
The features and functionalities of these mobile apps can be summarized as follows (Table
1.2):
• Activity Tracking
– Automatic Mode: User’s activities can be recognized automatically without user annotation. These applications can only detect some simple activities such as
walk-ing, runnwalk-ing, and cycling. Most of the applications have to use GPS data or gait
Features App Index
Automatically 2, 7
Activity Tracking Semi-automatic 1, 4, 5, 8, 10
Manually 2, 4
Burned Calorie Calculation 1, 4, 5, 8, 10, 11
Chart/Graph Activity Records 1, 2, 4, 5, 7, 8, 10, 11
Fall Detection 3, 9
Food Log 4, 5
Health & Fitness Knowledge 5
Pedometer 2, 6, 7, 11
Routes on Map 1, 4, 5, 7, 8, 10
Social Networking 1, 4, 6, 10
Table 1.2: Product Features (the app index is shown in Table 1.1)
– Semi-automatic Mode: The tracking tasks are trigged by users. The applications will then recognize activities accordingly. The tracking tasks are terminated by the
apps automatically or manually by the users.
– Manual Mode: In these applications, users will denote the type of activities they are performing during the tasks.
• Burned Calorie Calculation:
Calculate the burned calories for individual activity events. The formulas of calorie
expenditure are obtained from physiology studies. Currently, most calorie calculators
will first calculate the Basal Metabolic Rate (BMR) and then obtain the total daily energy
expenditure by the activity factor. According to different activity intensities (sedentary,
lightly, moderately, very, and extremely active), the activity factor varies.
• Chart/Graph Records: Record and display activities through charts and graphs.
• Fall Detection: Detect falls as an anomaly behavior and send alerts to caregivers.
• Food Log: Users can record and track their daily meals. Such manually inputed food log
can be used for future analyses.
• Health & Fitness Knowledge: Provide articles and training courses on related fitness
• Pedometer: It can tell the user how many steps he/she has walked that day. It is popular
in today’s smart devices as a daily exercise counter and motivator. Today’s step counters
integrated in devices are based on MEMS inertial sensors and algorithms to detect steps.
With the accurate multi-axis acceleration readings from advanced MEMS sensors, the
best pedometer can be accurate to within±5% error [4].
• Routes on Map: Track the user’s activity and display on map. Record the geographic
information where she/he goes or stays.
• Social Networking: Users can share their progress and activities on social networks.
1.2
Research Motivations
Although there are already various applications in the market as illustrated in the previous
section, most of them do not make full use of the smartphone embedded inertial sensors. The
granularity of such applications is also not sufficient. In some applications, only the activities
of walking and motionless are recorded. Some applications that only use GPS signals fail to
function in indoor environments.
The effectiveness of employing machine learning techniques on smartphone based sensor
data is marked to be investigated, with the purpose of recognizing human activities. Different
domain features and data processing techniques need to be studied. The unsupervised scheme
for activity recognition on smartphones is rarely investigated in the literature. In addition,
there have been very few studies on alleviating the impacts of mobile sensing performance
differences across multiple devices. Our research is motivated by the demand of fulfilling the
lack of studies on those topics in order to develop more accurate HAR algorithms.
1.3
Research Objectives
Based on the motivations described above, the study in HAR is still not sufficient. Three
objectives of this thesis are derived to solve the problem of recognizing activities in different
schemes by learning and leveraging smartphone sensor data with emphasis on considering the
sensor difference effects. The objectives are as follows:
• A full study as well as developing human activity recognition applications under the
supervised learning scheme is demanding. Collecting and recording smartphone sensor
With regard to this, the effectiveness of various features extracted from raw sensor data
will be investigated.
• Besides the supervised learning scheme, developing a method for clustering based
activ-ity recognition is proposed, which can help avoid the intensive labelling work.
Specif-ically, the new method is expected to work in an incremental way that can deal with
streamed sensor data.
• The third objective of our study is to address the issue of sensor heterogeneities across
various smartphone embedded sensor models, as there are few studies in the literature
focusing on the applicability of HAR systems for multiple platforms. In this study,
tech-niques to alleviate the sensor difference effects are proposed and examined in order to
obtain an improved performance of HAR applications.
1.4
Contributions
In this thesis, the activity recognition problem is studied by learning the advanced smartphone
embedded multi-module sensor data. Based on a comprehensive literature survey and machine
learning techniques, methods for both supervised and unsupervised learning for HAR are
pro-posed. The main contributions of this thesis work can be summarized as follows:
• The proposed supervised learning based human activity detection system recognizes
ac-tivities including walking, running, sitting, going upstairs, and going downstairs.
Em-bedded sensors (a tri-axial accelerometer and a gyroscope sensor) are employed for
mo-tion data collecmo-tion. A two-stage data analysis approach is used for predicmo-tion model
generation: short period statistical analysis (maximum, minimum, mean, and standard
deviation) and long period data analysis using machine learning. Both time-domain and
frequency-domain features are extracted and analyzed. Our experiment results show that
two time-domain features, mean and standard deviation, are good enough to recognize
basic human activities. The system is implemented in an Android smartphone platform.
• An unsupervised (clustering) activity recognition scheme that works in an incremental
manner is proposed, which contains two stages. In the first stage, streamed sensor data
are processed. A single-pass clustering algorithm is used to generate pre-clustered results
for the next stage. In the second stage, pre-clustered results are refined to form the final
clusters, which means the clusters are built incrementally adding one cluster at a time.
the proposed scheme can get comparable results with traditional clustering algorithms
but working in a streaming and incremental manner, which is promising for automatic
annotated data collection activity discovery.
• In achieving a robust HAR system through various smartphone types, sensing
hetero-geneities are investigated through various smartphone sensors. Sensor heterohetero-geneities
are identified, such as sensor biases, sampling rate heterogeneity, and sampling rate
in-stability. Possible mitigating techniques (interpolation, outlier removal, and filters) are
investigated to alleviate these differences. Testing results show that the outlier removal
and low pass filter have positive effects on alleviating the sensor differences.
1.5
Thesis Organization
The rest of the thesis is organized as follows:
Chapter 2 provides an overview of basic concepts and algorithms in machine learning and
data mining as well as a description of the WEKA framework used in this thesis work. A
comprehensive literature review for supervised activity recognition is made, followed by four
categories: HAR based on single or multiple accelerometers; HAR based on a combination of
sensors; HAR based on smartphones; and other smartphone assisted sensing systems. Existing
studies on unsupervised activity recognition are then briefly reviewed.
Based on the background and literature review provided in Chapter 2, Chapter 3, 4, and 5
present studies that fulfill the research issues proposed in section 1.3. Chapter 3 describes the
proposed supervised HAR system. Starting with the data collection procedure, feature
extrac-tion methods are presented. Both time-domain and frequency domain features are examined.
After the classification, there are satisfied classification accuracies for recognizing five basic
activities using popular machine learning algorithms (C4.5 Decision Tree, SVM, Naive Bayes,
and MLP). The classification results are presented and discussed in the last part of this chapter.
In Chapter 4, the unsupervised learning problem in HAR systems is studied. An
incremen-tal clustering method is introduced. The methodology involves the data collection and
time-domain feature extraction. Then, the two-stage incremental clustering algorithm is presented
followed by the clustering results on our collected dataset. Finally, the effects of two
param-eters (initial data point number and data window size) in the proposed incremental clustering
algorithms are examined and results are discussed at the end of the chapter.
A study on the sensor heterogeneity effects is presented in Chapter 5. Firstly, a series of
experiments for HAR on multiple devices are conducted, in which recognition performance
such differences, techniques (outlier removal, interpolation, and filtering) are proposed and
validated. Detailed results on datasets collected from multiple smartphones and results for
different classifiers are presented. Discussions based on the results are provided to reveal the
techniques that have positive effects and the classifiers that are relatively less affected by the
sensor differences.
In the end, Chapter 6 summarizes the contributions of this thesis and suggests some
Background and Literature Review
2.1
Data Mining and Machine Learning
Nowadays, an overwhelming amount of data is generated in the world and it is continuing
to increase. Although such an amount of data can always be stored in disks, there is a gap
between the generation of data and the understanding of data. To resolve this issue, data
min-ing and machine learnmin-ing techniques are utilized to discover patterns in data and make future
predictions.
To better understand how to adopt a machine learning approach in a specific problem,
we need to define a training set {x1, ...,xN} that contains N instances to train and tune the parameters of a model. The categories (or labels) of each instance in the training set are known
in advance. In most cases, the categories are labelled manually during the data collection stage.
The category of each instance in the training set can be expressed as the target vector t. The output of running a machine learning algorithm can be expressed as computing a function
f(x) that takes a new instance as input and outputs a vector y, where y is in the same form as the target vectors. The form of the function f(x) can be determined in the training (or learning) phase based on the training set. Once the model is generated, we can utilize it to
make predictions on the test set.
In some application scenarios, it will be easier to solve the machine learning problem if
the original input variables are transformed into some new space of variables, which is called
pre-processing [5]. Sometimes feature extraction has the same meaning as pre-processing.
Note that both the test data and training data must be pre-processed using the same procedure.
In addition, as the feature extraction might speed up the computation of the model, some
infor-mation might be discarded. We have to be careful to check whether such kind of inforinfor-mation
is important in order to avoid harming the overall accuracy of the machine learning system.
The classification of machine learning problems can be summarized as follows. If the
train-ing data is comprised of input vectors x and the corresponding target vectors t, such kind of machine learning problems are known as supervised learning problems. The supervised
learn-ing problems can be further divided into two categories: classification problems and regression
problems. The aim of the classification problem is to assign each input to a discrete category,
while the regression model will output one or more continuous variables. Another class of
machine learning problems is the unsupervised learning problems, where the training data set
only contains the input vectorsxwithout labels. Unsupervised learning can be used for discov-ering groups with similar properties, which is called clustdiscov-ering, or it can be used to estimate
the distribution of input data.
2.1.1
Classification Algorithms
In this subsection, some popular classification algorithms that are related to the scope of this
thesis are briefly reviewed: Decision Tree (DT), Naive Bayes (NB),k-Nearest Neighbor (kNN),
Support Vector Machines (SVMs), and Artificial Neural Networks (ANNs).
Decision Tree (DT)
Decision Tree (DT) is a non-parametric supervised learning method for classification. There
are various decision tree implementations. Among them, ID3 (Iterative Dichotomiser 3) was
developed by Ross Quinlan in 1986 [6]. It first calculates the entropy (or information gain) for
each feature in the data setS. Then it splits the data setSinto subsets according to the feature which has the minimum entropy (or information gain). After that, a decision tree node is
generated containing that feature. This procedure recurses until there are no remaining features.
C4.5 is an extension of the ID3 algorithm [7]. J48 is its Java implementation integrated
in the WEKA data mining tool. Different from ID3, C4.5 can deal with both continuous and
discrete features, handle training data with missing values, and support tree pruning after
cre-ation. C4.5 is referred as a statistical classifier. LetSbe the data set for training. f req(Ci,S) is
the number of instances inSthat belongs to classCi. The number of instances in data setSis |S|. Then the entropy of setSis defined as:
In f o(S)=− k
X
i=1
((f req(Ci,S)
|S| )·log2(
f req(Ci,S)
|S| )), (2.1)
wherekis the number of classes.
entropy after using featureX to splitS intonpartitions can be formulated as:
In f oX(S)= n
X
i=1 ((|Si|
|S|)·In f o(Si)), (2.2)
whereSiis the subset ofSin which all the instances belong to classCi.
Using the above formulas, the information gain on feature Xis defined as:
Gain(X)= In f o(S)−in f oX(S). (2.3)
In the C4.5 algorithm, the splitting criterion is the normalized information gain defined above.
For each feature in the data set, the normalized information gain is calculated. Then the feature
which has the highest normalized information gain is chosen and a decision node is generated
based on the selected feature. The recursion procedure continues until there are no remaining
features to split.
The advantages of decision trees are that they are simple to understand and visualized
easily. The trees can be easily expressed by Boolean logic. So decision trees use a white box
model compared with a black box model (e.g. an artificial neural networks), which makes it
easy to interpret. In order to generate the tree, little data preparation is required. However
decision trees have some disadvantages. If the data are not well-generalized, over-complex
trees may be formalized. Techniques like tree pruning and setting the maximum depth of the
tree are necessary to avoid the overfitting problem. What’s worse, there are some concepts that
are hard to learn through a decision tree.
Naive Bayes
One of the supervised classifiers is the Naive Bayes classifier which is based on the Bayesian
theorem. To explicitly explain it, we first get the basic Bayes theorem:
p(cj|d)=
p(d|cj)· p(cj)
p(d) , (2.4)
where p(cj|d) is the probability of instance d being in class cj, which is also what we are
going to compute. p(d|cj) is the conditional probability of instanced given the classcj. This
conditional probability also means that being in the class cj makesd have some probability.
p(cj) is the probability of the occurrence of class cj (the frequent of classcj occurred in the
data set). p(d) is the probability of instancedoccurring.
The above shows the Bayes classification process when there is only one feature for an
p(d|cj) can be estimated by:
p(d|cj)= p(d1|cj)· p(d2|cj)· · ·p(dn|cj). (2.5)
Here we assume that features have independent distributions. p(di|cj) is the conditional
proba-bility of instancedgiven the classcj for theithfeature.
Then the equation 2.4 can be rewritten as:
p(cj|d)=
p(cj)·Q n
i=1p(di|cj)
p(d) . (2.6)
Since p(d) is a constant given by the dataset, the classification can be expressed as:
p(cj|d)∝ p(cj)· n
Y
i=1
p(di|cj). (2.7)
The estimated class ˆcjcan be derived as:
ˆ
cj =arg max cj
p(cj)· n
Y
i=1
p(di|cj). (2.8)
The advantages of the Naive Bayes classifier are that it is fast to train and make
classifica-tions, it is not sensitive to irrelevant features, and it can handle real and discrete data. However,
the Naive Bayes classifier assumes features are independent, which is one of its drawbacks.
k-Nearest Neighbors (kNN)
Thek-Nearest Neighbors algorithm is a non-parametric technique for classification and
regres-sion. It is also among one of the simplest machine learning algorithms. The kNNs is a kind
of instance-based classifier, which means it does not abstract any information from the
train-ing data durtrain-ing the traintrain-ing stage. For an unknown instance, it is labelled as the same class
as that of the majority of its k nearest neighbors. The nearest neighbors are measured by a
distance function. The most commonly used distance functions are the Euclidean distance, the
Manhattan distance, and the Minkowski distance, which are defined as follows. The Euclidean
distance:
d(x,y)=
v
t k
X
i=1
The Manhattan distance:
d(x,y)=
k
X
i=1
|xi−yi|. (2.10)
The Minkowski distance:
d(x,y)=(
k
X
i=1
(|xi−yi|)q)1/q. (2.11)
Another issue ofk-Nearest Neigobor algorithm is the computation of theknearest neighbors.
The naive neighbor search method is the brute-force computation of distance between the pairs
of points in the dataset. However this approach is only feasible for small datasets. To efficiently
search the nearest neighbors, a variety of tree-based structures have been introduced, such as
K-D tree and ball tree.
The advantage of kNN classifier is that it is a simple method and works well on basic
machine learning problems. However, it does not learn anything from the training data. And
if the dataset is large with high dimensions, the searching of k neighbors can be slow and
inefficient. What’s worse, kNN classifier can be easily affected by noisy data.
Support Vector Machines (SVMs)
The support vector machine method is considered as an optimization algorithm. The basic
ideas of SVMs are that it creates optimal hyperplane for linearly separable patterns, and for
the patterns that are not linear separable, kernel functions can be used to transform the original
data into new space. SVMs and kernel methods have a theoretical model that guarantees the
performance. In addition, SVMs are not affected by local minima and the curse of
dimen-sionality. For simplicity’s sake, we first consider the two-class classification problem with the
linear model:
y(x)=wTφ(x)+b, (2.12)
whereφ(x) represents a feature-space transformation. The training dataset hasNinput vectors
x1, ...,xn, and the corresponding targets are t1, ...,tN where tn ∈ {−1,+1}. When a new data
instance x comes, it will be classified according to the sign of y(x). If the training dataset is linearly separable and the function 2.12 satisfies y(x) > 0, the data instance has tn = +1; If
y(x) < 0, the data instance has tn = −1. So that there is a constraint thattny(xn) > 0 for all
margin
y = 1
y = 0
y = -1
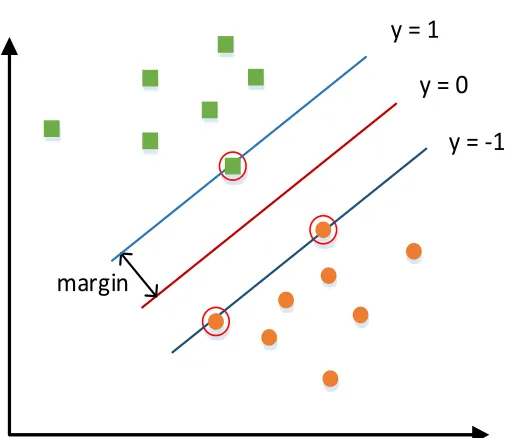
Figure 2.1: The maximum margin, where the margin is defined as the perpendicular distance between the decision boundary
Then the concept of the margin is introduced. It is defined as the smallest distance between
the decision boundary, as shown in Figure 2.1. The support vectors are defined as the data
instances that lie closest to the decision boundary, which are the most difficult to classify. The
SVMs maximize the margin around the decision hyperplane. This is formulated as a quadratic
programming problem. As formula 2.12 indicates, the perpendicular distance of a instance x
from the decision hyperplane is|y(x)|/kwk. As denoted above, if all the instances are correctly classified, there istny(xn)>0. The distance of an instance xnto the decision boundary is:
tny(xn)
kwk =
tn(wTφ(xn)+b)
kwk . (2.13)
In order to maximize the margin, the parameterswand b are optimized. The maximum margin can be derived by solving:
arg max w,b
1
kwkminn [tn(w
Tφ(
xn)+b]
To solve this optimization problem, it can be transformed [5] into:
arg min w,b
1 2kwk
2.
(2.15)
Then Lagrange multipliersan≥ 0 are introduced with the Lagrangian function:
L(w,b,a)= 1 2kwk
2−
N
X
n=1
an{tn(w Tφ(
xn)+b)−1}, (2.16)
wherea= (a1, ...,aN)T. The dual problem of optimizing the maximum margin can be expressed
as:
Maximize: ˜L(a)=
N
X
n=1 an−
1 2
N
X
n=1
N
X
m=1
anamtntmk(xn,xm) (2.17)
Subject to:
an ≥0,n=1, ...,N (2.18)
N
X
n=1
antn = 0. (2.19)
When the model is trained, the class of a new instance can be evaluated by function 2.12. The
above descriptions are the two-class SVM classification scenario. In practice, there may be
problems involing K > 2 classes. One approach to deal with multiclass problem is to call
the one-versus-the-rest approach. It divides the dataset into two classes,Ck and the remaining
K−1 classes. Another class is called one-versus-one approach. It trainsK(K−1)/2 two-class
SVMs for all possible pairs of classes. The instance to be classified is determined by a voting
according to which class has the highest votes.
Artificial Neural Networks (ANNs)
ANNs are models that are composed of many nonlinear computational nodes in parallel and
perform like biological neural networks [8]. The best known model of ANNs is the
feed-forward neural network, which is also known as the multilayer perceptron. The nodes or
neu-rons in the neural network are connected via weights and updated during the learning process.
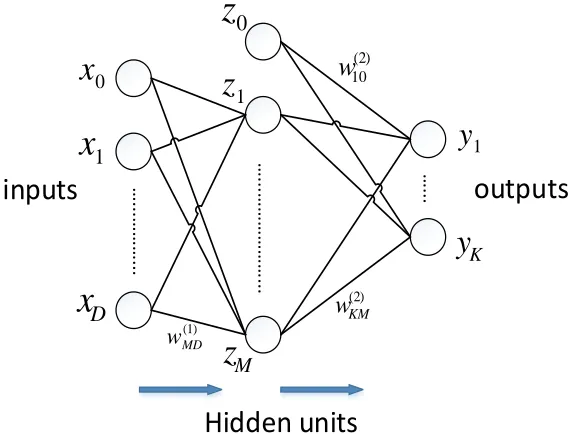
For a neuron the structure is represented in Figure 2.2. Figure 2.3 shows the example of a
functionsφj(x), represented as:
y(x,w)= f(
M
X
j=1
wjφj(x)), (2.20)
where the f(·) is the nonlinear activation function, φj(x) is the basis function. The whole
network function using sigmoidal activation functions can be written as:
yk(x,w)=σ( M
X
j=1 w(2)k jh(
D
X
i=1
w(1)ji xi+w(1)j0)+w(2)k0). (2.21)
The sigmoid functionσ(a) = 1+exp1(−a) is used as the activation function. The nonlinear
func-tionsh(·) are the hidden unit activation functions and are chosen to be sigmoidal functions or
the ’tanh’ function. w(1)ji refers to the weight from the nodeito the node jin the first layer of
the neural network.
The training of the neural network involves minimizing the error function:
E(w)= 1 2
N
X
n=1
ky(xn,w)−tnk2. (2.22)
The parameterwcan be found by minimizing E(w) through the maximum likelihood solution [5]. However, in practice the error functionE(w) can be nonconvex, the local maxima may be found.
Input ●●●
Output y
1 0 )) ( ( ) , ( M j j j x w f w x y 0x
1x
1 Mx
Figure 2.2: A model of a neuron or node that forms a weighted sum of M inputs and output the result through a nonlinearity
The advantages of artificial neural networks are that they are nonlinear models and are
easy to train and use compared with statistical methods. Furthermore neural network models
can implicitly reflect the nonlinear and complex relationships of the inputs [9]. However,
approximated functions by the network. What’s worse, training neural network models needs
greater computational efforts. In the meanwhile, such models are prone to overfitting.
… ... ……… ... … ... ……… ... … ... 0
x
1x
Dx
0z
1z
Mz
1y
Ky
inputs
outputs
) 1 ( MD w ) 2 ( KM w ) 2 ( 10w
Hidden units
Figure 2.3: Example for the two-layer neural network
2.1.2
WEKA Machine Learning Framework
WEKA stands for Waikato Environment for Knowledge Analysis, which started in 1992 [10]
and was funded by the New Zealand government. The purpose of WEKA project was to create
a collection of learning algorithms as well as a framework inside which new algorithms can
be implemented. Now this machine learning algorithms toolkit is an open-source Java-based
machine learning software framework.
The WEKA Workbench
The WEKA project provides functions that researchers can use to try out and compare different
machine learning methods on new datasets. In addition, APIs are provided for customized
solutions and explorations. Classification, regression, clustering, and attribute selection are
integrated in the workbench.
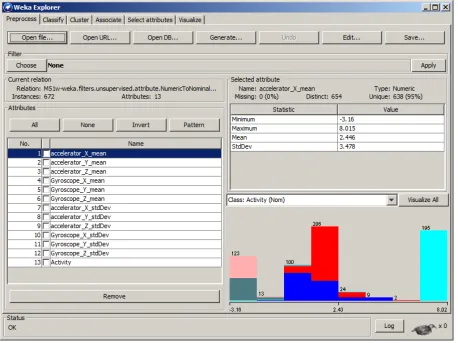
The main graphical user interface of WEKA is call the “Explorer” (shown in Figure 2.4),
Visu-alize. The “Preprocess” panel is used for data preprocessing. Different preprocessing tools are
called “filters” in WEKA. The second panel called “Classify” includes various classification
and regression algorithms. Validation methods as well as evaluation visualization like ROC
curves can be drawn in this panel. In addition, WEKA also supports unsupervised learning
algorithms. Evaluation and visualization of the clustering algorithms are provided in the third
panel. The fourth panel enables the methods for association rule mining, which is used for
discovering interesting relations between items in datasets. Attributes selection is another
im-portant task in practical machine learning and data mining. The “Select attributes” panel gives
access to some attribute selection algorithms, such as principal components analysis (PCA),
information gain evaluation, and gain ratio attribute evaluation. The last panel is the data
visu-alization, which provides the color scatter plot of the data matrix that can be visualized.
Core of WEKA
New learning algorithms, pre-processing filters, and usability improvements and supports have
been added to WEKA since version 3.4. There are more than 690 Java class files.
Some of the classification algorithms in WEKA 3.6 include
• Bayesian logistic regression [11]: the Bayesian logistic regression approach for text
categorization with a Laplace prior to avoid overfitting.
• Bayes net: Bayes network learning using diverse searching algorithms and quality
mea-sures, such as hill climber, genetic search, and simulated annealing.
• Naive bayes [12]: a Naive Bayes classifier using estimator classes.
• LibLINEAR [13]: WEKA provides a wrapper class for the libnear tools, which support
logistic regression and linear support vector machines.
• LibSVM [14]: a wrapper class is provided for the libsvm tools, which support
solv-ing SVM optimization problems, multiclass classifications, probability estimation, and
parameter selection.
• Multilayer perceptron: a classifier that can use backpropagation to classify instances.
The built network can be monitored and modified during the training time. The nodes
used in the network are all sigmoid.
• RBF network: a normalized Gaussian radial basis function network.
• IB1: a nearest-neighbour classifier implementation that uses normalized Euclidean
dis-tance.
• IBK: a K-nearest neighbours classifier. The value of K can be selected by cross-validation.
• J48: a C4.5 decision tree implementation [7].
• Random forest: an implementation for constructing a forest of random trees, which is
also a combination of tree predictor [15].
Some of the clustering algorithms in WEKA 3.6 include
• Cobweb: an implementation for the incremental system of hierarchical conceptual
clus-tering.
• DBSCAN [16]: a basic implementation of density-based spatial clustering of
• EM: a simple implementation of expectation maximization clustering algorithm, which
will find the MLE of the marginal likelihood by applying the expectation step (E step)
and the maximization step (M step).
• Hierarchical clusterer: implementations of a number of agglomorative clustering
algo-rithms. The agglomorative clustering is a ”bottom up” method, which means each
in-stance starts in its own cluster.
WEKA has also integrated a number of preprocessing tools, which are called ”Filters” in
WEKA’s Preprocess panel. Some of the filters include:
• Supervised filters: filters that take class distributions into account.
– Add classification: adding the classification, the class distribution, and the error flag to the dataset.
– Attribute selection: an attribute filter that is flexible and support various search and evaluation methods, such as Cfs subset evaluation, Chi square attribute evaluation,
Gain ratio attribute evaluation, Best first search, Genetic search, and Greedy
step-wise search.
– Resample: a filter that can produce a random subsample of a dataset using either replacement or without replacement.
• Unsupervised filters: filters that work without taking any class distributions into account.
– Add cluster: a filter that can add a new nominal attribute, which represents the cluster assigned to each instance. Different clustering algorithms can be selected in
the filter.
– Add values: a filter that can add the labels from a given list to a denoted attribute.
– Add: a filter that can add a new attribute to the dataset.
– Numeric to nominal: a filter that can convert numeric attributes to nominal ones.
– Remove: a filter that can remove a range of attributes from the dataset.
– Replace missing values: a filter that can replace all missing values for nominal and numeric attributes in a dataset.
– Normalize: a filter that can normalize numeric values in the dataset. The resulting values can be [0,1] or in the range [-1,+1].
– Remove with values: an instance filter that can filter the instances according to the value of an attribute.
– Remove range: an instance filter that can remove a given range of instances in a dataset.
– Interquartile range: a filter that can detect outliers and extreme values based on interquartile range.
– Wavelet: a filter that performs wavelet transformation.
WEKA API
Although WEKA provides graphical user interface, it also defines API (application
program-ming interfaces) that make it possible to embed WEKA’s functions into other projects. The
most common components in WEKA are
• weka.core.Instances: class for handling instances (data to be processed, trained, and
tested).
• weka.filters.Filter: class for instance filters. Filters take instances as inputs, perform
some transformations, and output the results.
• weka.classifiers/weka.clusterers: interface classes. When implemented, predictions or
clusterings can be made.
• weka.classifiers.Evaluation: class for evaluating machine learning models with options
of different evaluation mode.
• weka.attributeSelection: class for removing or modifying attributes in the dataset.
The above classes are the most common used components when using WEKA in our own
codes. The basic steps for solving a classification problem are: building feature vector, training
a classifier, testing a classifier, and using a classifier. More details about WEKA framework
can be found in the WEKA developer’s manual [17].
2.2
Human Activity Recognition based on Supervised
Learn-ing
Human activity recognition (HAR) has been widely studied in the literature. Research in
used for human activity systems, such as Hidden Markov Models (HMMs), Conditional
Ran-dom Fields (CRFs), and Bayesian networks. Discriminative approaches, such as Support
Vec-tor Machines (SVMs), C4.5 decision trees, and neural networks, are also successfully applied
in the area of HAR.
The task of activity detection can be performed by employing variety of sensors, including
video cameras, environmental sensors (light, relative humidity, temperature, and pressure
sen-sors), and wearable sensors. The sensors used can be on-board smartphone sensors or sensors
installed in wearable devices.
Although camera sensors can provide a rich and unique set of information that cannot be
obtained from other types of sensors, camera-based methods require continuously monitoring
a person’s activities, which requires vast storage space and computation resources. In addition,
people may feel uncomfortable being watched by cameras continuously [18]. An example of
such a camera-based indoor human activity monitoring system can be found in [19], which
provides continuous video monitoring and intelligent video processing. Another purpose for
utilizing camera sensors is providing the ground truth for human activity recognition systems.
For instance, in [20], the proposed activity recognition system employs varieties of sensors,
where the cameras are used for documentation and visual annotation. In the daily routines
recognition system [21], snapshots taken by the mobile phone’s built-in camera are used for
annotations.
Environmental sensors can track and record the user’s interaction with the environment.
For example, in the experimental environment of [20], wireless Bluetooth acceleration and
gyroscope sensors are attached on objects used in the test scenario, recording the usage of
objects. Moreover wired microphone arrays are used at room side in order to sense ambient
sound. In addition, reed switches are instrumented on doors, drawers, and shelves to sense
usage as well as provide ground truth. However, the limitations of the environmental sensors
are that they are restricted to certain circumstances and building layouts, which makes the
HAR system not universal. One well designed and trained HAR system may not be simply
immigrated to another ambient environment. Also, the deployment cost of such sensors are
relatively high.
Wearable sensors that are worn on human body can determine physical states and
char-acters of the subject’s daily activities. Such sensors include inertial sensors (accelerometers
and gyroscopes), GPS, and even magnetic field sensors are widely used in activity recognition
2.2.1
Human Activity Recognition Based on Single or Multiple
Accelerom-eter Sensors
In some studies, one or more accelerometers attached to different parts of human body are
used for activity recognition. Dong and Biawas [22] presented a wearable sensor network that
was designed for human activity detection. In their system, each of three sensors, which were
worn on ankle, thigh, and wrist, was equipped with an ADXL202 accelerometer. The mean
and entropy of acceleration were computed over time windows and were used for activity
detection. Ten dynamic activities (bicep curls, riding a bike briskly/slowly, jogging, jumping,
walking briskly/slowly, sweeping, squatting, and stair climbing) can be detected with good
accuracy. Similarly, Curone et al. [23] used one wearable tri-axial accelerometer for activity
detection. Signal magnitude area (SMA) [24] was introduced in their method, which was
an effective measurement for identifying activity intensity. In their system, human postures
(upright standing, move trunk and arms, picking up objects, moving lying down, etc.) can
be detected in real time. Al-Ani et al. [25] combined wavelet and hidden Markov models
for on-line human activity detection. A bi-axial accelerometer ADXL202E was attached on
the belt of the person to identify activities (walking slowly, walking quickly, sitting
down-getting up, fall during walking, fall from a position upright). In Bao and Intille’s study [26],
acceleration data were collected from 20 individuals and fed into decision tree classifiers to
detect 20 daily activities. With five bi-axial accelerometers attached on different locations
of human body, the HAR system can reach a reasonable accuracy. They also reported that
with just two accelerometers (thigh and wrist), the recognition performance dropped slightly.
Mannini and Sabatini [27] applied Hidden Markov Models on the dataset provided by Bao
and Intille [26] and got satisfied classification accuracy. Banos et al. [28] employed a group
of accelerometers attached to different parts of the body (hip, wrist, arm, ankle, and thigh) for
tracking four activities: walking, sitting, standing, and running. Zhang et al. [29] tested the
number of accelerometers and settings that may affect the accuracy to identify eight activities,
standing, walking, running, jumping, lying, sitting, tooth brushing, and eating. SVM was used
for their data classification.
There have been some datasets created and published by researchers and used by others
around the world. WISDM (Wireless Sensor Data Mining) is a dataset published by Fordham
University, which contains data collected in controlled and laboratory conditions [30]. Only
the cell phone-embedded accelerometer is used in the data collection. The sampling rate is
20Hz and the total number of instances is 1,098,207. The number of attributes is six (user
index, activity type, timestamp, x-acceleration, y-acceleration, and z-acceleration). 29
(31.2%), upstairs (11.2%), downstairs (9.1%), sitting (5.5%), standing (4.4%)). From the raw
time series data, time-domain features are extracted in the publisher’s study, such as the
aver-age value, standard deviation, averaver-age absolute difference, average resultant acceleration, time
between peaks, and binned distribution.
The Skoda mini checkpoint dataset is another dataset published by the Wearable Computing
Group in ETH [31]. It describes one subject performing ten different manipulative gestures
in a car maintenance scenario. The ten activities include write on notepad, open/close hood,
check gaps on the front door, open left front door, check trunk gaps, check steering wheel, etc.
In total, there are 20 3D acceleration sensors (10 on the left arm and 10 on the right hand used
for data collection).
2.2.2
Human Activity Recognition Based on the Combination
Accelerom-eters and Other Types of Sensors
Some other studies combine multiple sensors, such as gyroscopes, microphones, and magnetic
field sensors. In the abnormal activity detection system proposed by Yin et al. [32], three
MTS310CA sensor boards were attached to different parts of a human body with seven
fea-tures selected as inputs (light, temperature, microphone, bi-axial accelerometer, and bi-axial
magnetometer). In their approach, a one-class support vector machine (SVM) and a kernel
nonlinear regression (KNLR) were employed for the two-phase training and activity detection.
Their work makes it possible for abnormal activity models to be automatically derived without
the need to explicitly label the abnormal training data. Lee and Masc [33] proposed a system
using a bi-axial accelerometer, a digital compass sensor, and a gyroscope that can detect
sit-ting, standing, walking, going up a stairway, and going down a stairway. In Najafi et al. [34],
the authors attached one kinematic sensor, which was composed of one gyroscope and two
accelerometers, to the subject’s chest. The physical activity monitoring system can not only
detect body postures (sitting, standing, and lying), but also different postural transitions (PTs)
(i.e., lying-to-sitting, sitting-to-lying, and turning the body in bed). Subramanya et al. [35]
introduced a customized wearable sensor system, which is consisted of a tri-axial
accelerome-ter, two microphones, phototransistors, temperature and barometric pressure sensors, and GPS
to identify activities including walking, running, going up/down stairs, driving a vehicle, and
going indoors using graph models. Parkka et al. [36] also built a system using many different
sensors (three accelerometers with two on chest and one on wrist, one microphone attached to
wrist, and one compass attached to chest) to recognize activities such as lying, sitting/standing,
walking, Nordic walking, running, rowing, and cycling. Decision trees and artificial neural
a wireless heart rate monitor were used to identify activities with intensities. Banos et al.
[38] examined the effect of signal segmentation and reported that the interval of 1-2 seconds
would provide the best trade-offbetween recognition speed and accuracy. Since body sensor
networks (BSNs) based activity detection systems usually have difficulties in real-world
appli-cations due to the programming complexity and the lack of high-level software abstractions,
Fortino et al. [39] developed a programming framework called signal processing in node
environment (SPINE) to support rapid development of BSN applications.
Among these studies, Chavarriaga et al. [40] made their dataset public, which is called the
Opportunity Dataset. This dataset is brought into the public in order to deal with the
bench-marking requirements for activity recognition. Previously, each research group reports the
results of their proposed methods based on their own dataset with specific experimental setups.
It is hard to compare and assess different methods on various experimental environments. This
dataset is proposed by the Wearable Computing Group in ETH. The dataset aims at providing
a platform that enables the comparison of different methods in the same condition.
In this dataset, the researchers provide 18 labelled sessions from four subjects. In
addi-tion, four different tasks are identified: multimodal activity recognition (modes of locomotion),
automatic segmentation task, multimodal activity recognition of gestures, and recognition of
gestures with noise. The sensors deployed in the environment are described as follows. Five
IMUs are mounted in a motion jacket, 12 bluetooth accelerometers and two inertial sensors are
placed on the feed. In each task, only a subset of the provided sensors are used.
For the modes of locomotion task, four sub-activities are further identified: standing,
walk-ing, sittwalk-ing, and lying. For the automatic segmentation task, classes are null class and activity
class. For the task of gesture recognition, right-arm gestures performed in a daily activities
scenario are recognized. Classes include open/close dishwasher, open/close doors, clean table,
move cups. etc. In the last task, rotational and additive noise is added to the testing dataset for
recognizing gestures.
2.2.3
Human Activity Recognition Based on Smartphone Sensors
As mentioned above, with ever increasing computing power, convenient Internet connections,
and numerous mobile applications, smartphones have been an indispensable role in our daily
life. What’s more, even low-end smartphones have a set of sensors (accelerometer, GPS, and
gyroscope, etc.), which make it possible to use a smartphone to detect human activities. In
[41], a mobile phone based fall detection system was proposed and implemented in the Android
platform. In their experiments, the mobile phones were still attached to different locations of
going-upstairs, going-downstairs, running, and motionless. The features selected from accelerometer
data were standard deviation of Y axis, correlation of Y, Z axis, autoregressive fitting of Y
axis, and the signal magnitude area (SMA). Also, the mean, standard deviation, and skewness
of pitch were selected for classification. Boyle et al. [43] proposed a gait-based-recognition
system to identify walking activity. The wavelet transform was employed to extract features
from raw data and the k Nearest Neighbors (kNN) algorithm was used to perform the
clas-sification. Miluzzo et al. [44] developed the CenceMe application, which can distinguish
sitting, standing, walking, and running from acceleration data collected by a Nokia N95
smart-phone. In Brezmes et al. [45], the authors implemented a real-time classification system
for some basic human activities from accelerometer data, including walking, climbing-down
stairs, climbing-up stairs, sitting down, standing up, and falling. Their monitoring system was
decentralized, which meant no server processing data are involved. Kwapisz et al. [30] built
another HAR system which can identify six human activities. The data were collected from
smartphone embedded accelerometers placed in the subjects’ front pants leg pockets. Chiang et
al. [46] proposed a portable activity pattern recognition system to identify physical activities.
Accelerometer and GPS data were collected and four classifiers were tested. Anjum et al. [47]
proposed a smartphone application using accelerometer and gyroscope sensors as well as GPS
signals to detect seven activities. C4.5 decision tree classifier was reported to yield the best
performance. All the systems reviewed above are based on the supervised learning approach
for activity detection. Kwon et al. [48] examined the unsupervised learning method for human
activity recognition based on smartphone sensors. A comprehensive survey on smartphone
sensor based activity recognition can be found in [49].
The Heterogeneity Human Activity Recognition (HHAR) dataset is a public dataset based
on smartphone sensors for HAR studies collected from a variety of different device models and
use-scenarios, which reflects the sensing heterogeneities when HAR applications are deployed
in real-world scenarios [50]. This dataset contains the sensor readings of nine users with six
different activities: biking, sitting, standing, walking, stair up, and stair down. Smartphone
embedded accelerometer and gyroscope sensors are employed in the study, which work at
the highest sampling rate the device allows. Different from other public datasets, the HHAR
dataset incorporates four smartwatches (two models) and eight smartphones (four models).
2.2.4
Other Smartphone Based Sensing Systems
Besides detecting human activities, smartphone based sensing systems can perform other tasks.
Such tasks include monitoring electrocardiogram [51], in which a smartphone is integrated
Medrano et al. [52] proposed a smartphone based fall detector, where detection algorithms,
like nearest neighbor, and one-class support vector machine, are tested for fall detection.
Casi-lari et al. [53] systematically reviewed the existing efforts of Android device-based solutions
for fall detection with built-in sensors. A wearable and context-aware ECG monitoring
sys-tem is proposed in [54], which is integrated with built-in smartphone sensors (accelerometer,
gyroscope, and orientation sensors) with a self-designed ECG sensor. The system can provide
improved diagnosis accuracy for abnormal ECG pattern in different activities.
2.3
Human Activity Recognition based on Unsupervised
Learn-ing
In the literature, activity detection is considered as a supervised learning problem. For the
su-pervised scheme, a training dataset is needed with the ground truth labels of different activities.
However, the labeling work may be tedious and labor-intensive. In this respect, unsupervised
approaches are investigated by some researchers [21] [55] [56]. Kwon et al. [48] proposed
unsupervised learning methods for human activity recognition using smartphone sensors and
studied the performances of different clustering methods even when the number of activities is
unknown. Huynh et al. [21] explored an unsupervised learning method based on the concept
of multiple eigenspaces to detect individual activities in accelerometer data. A sensor network
based smart home environment was proposed in [55], where an unsupervised approach was
claimed useful for detecting activities. The authors in [56] employed the unsupervised method
for activity recognition with three accelerometers attached to human body. Their results
re-ported were comparable to supervised learning methods.
To the best of our knowledge, the most similar work to incremental activity clustering is
Ong et al. [57], which contains incremental clustering concepts that can automatically
dis-cover human activities from unlabeled RGB-D sensors. However, Ong’s method is based on
video sensors and the number of clusters is not specified. In [58], another incremental learning
framework is proposed using video sensors. The probabilistic neural networks and adjustable
fuzzy clustering based incremental learning framework [59] is a supervised method rather than
working in an unsupervised way. In [60], the authors introduce a tree-based clustering method
that can deal with overlapping clusters, which allows overlapping clusters to be obtained when
data increase. It has to be noticed that in the literature, when we talk about incremental
clus-tering, it has two meanings [61]: (1) Single pass incremental algorithms where data points
are processed at each iteration and cluster centers are refined [62] [63] [64]; (2) Algorithms
unsupervised learning and the two kinds of incremental features is rarely studied.
2.4
Summary
In this chapter, we first review some basic concepts that are fundamental for the rest of this
thesis. Data mining and machine learning methods and algorithms are presented from the
mathematics point of view. Then a comprehensive literature review is given based on the
different categories of HAR scenarios. Under the supervised learning scheme, HAR systems
are divided into four classes according to the deployment methods of sensors and sensor types.
The background and literature review provide a good foundation for us to develop our own
HAR applications based on both supervised and unsupervised learning as well as explore the
Human Activity Recognition Based on
Supervised Learning
3.1
Introduction
Most smartphones are embedded with tri-axial accelerometers and gyroscopes as well as other
motion and environment sensors. Using smartphones for human activity recognition has more
flexibility than wearable devices, along with a wider range of applications including healthcare,
daily fitness recording, and anomalous situations alerting.
In this chapter, a smartphone based human activity recognition system is proposed to detect
human activities including walking, running, sitting, going upstairs, and going downstairs. As
standing still or putting the phone on a table is similar to the situation of sitting, sitting is used
in this paper to represent the motionless state. Also, it is assumed that people carry a
smart-phone in pockets with a fixed position. The smartsmart-phone based applications perform the tasks
of collecting sensor data and making predictions. Both time and frequency domain features are
extracted from the data collected by smartphone embedded sensors. Several machine
learn-ing algorithms (J48, SVM, Naive Bayes, and Multilayer Perceptron) are employed to make
classifications. The system is implemented in an Android platform.
Figure 3.1 shows a basic process of smartphone based human activity recognition system
based on supervised learning. The data collection and feature extraction are performed using
a smartphone while the model generation is performed in a computer. Then the model is
implemented in another app for activity prediction. In the training phase, the label information
serves as the ground truth for the purpose of training and evaluating. In the prediction phase,
the same features are extracted and fed into the generated classifier model in order to get the
corresponding predicted activity label.