A Monthly Double-Blind Peer Reviewed Refereed Open Access International e-Journal - Included in the International Serial Directories International Journal in IT and Engineering
http://www.ijmr.net.in email id- [email protected] Page 1 A STUDY ON IMAGE PROCESSING FOR SATELLITE AND DIGITAL IMAGES
Arpita Pandya
Lecturer
Institute of Computer Application, P.D.Pandya College, Gujarat University,
Ahmedabad, India.
Dr. Priya R. Swaminarayan
Professor & Head, MCA Department
Institute of Science and Technology for Advanced Studies & Research
Gujarat Technological University
Vallabh Vidyanagar, Gujarat, India.
Chaitali Pandya
Lecturer
Institute of Computer Application, P.D.Pandya College, Gujarat University,
Ahmedabad, India. M: 9879370011 [email protected]
ABSTRACT
The studies of crop forecasting and prediction of plant leaf disease refer to the studies of visually observable patterns of a particular crop and plant. Image processing techniques are used for crop area estimation procedures and crop yield models, based on the application of satellite remote sensing, statistics and other allied disciplines as well as prediction of plant leaf disease based on the digital images. The research intends to take the help of satellite images, digital image,regional plant information, regional disease forecasting, regional crop information, regional crop forecasting, forecasting methods and image processing techniques. This paper presents an overview of how to use satellite and digital imagery for forecasting crop and leaf disease using image processing techniques .
Keywords— Crop forecasting, Digital images, Image processing, Plant disease, Satellite
A Monthly Double-Blind Peer Reviewed Refereed Open Access International e-Journal - Included in the International Serial Directories International Journal in IT and Engineering
http://www.ijmr.net.in email id- [email protected] Page 2 I. Introduction
1.1 Nature of the problem
An image is an array, or a matrix, of square pixels (picture elements) set in columns and rows. Image processing is a technique to convert an image into digital form and make some operations on it, in order to get an improved image or to remove some useful information from it. It is a category of signal special consideration in which input is an image, be fond of video frame or photograph and output may be an image or characteristics attached with that image. generally Image Processing system consist of treating images as two dimensional signals while applying already set signal processing methods for them.[9]
Image processing includes the following steps.
Importing the image with optical scanner or by digital photography.
Analyzing and manipulating the images which includes data compression and image enhancement and spotting patterns that are not to seen by human eyes like satellite photographs.
Output is the last stage in which outcome can be altered image or report that is based on image examination.
Types of image processing
The two types of methods used for Image Processing are Analog and Digital Image processing. Analog or visual techniques of image processing can be used for printouts
and photographs. Image analysts use a range of basics of explanation while using these visual techniques. The image processing is not just limited to the area that has to be studied, but on facts of the forecaster.
Digital Processing techniques help out in the strategy of the digital images by using computers. As raw data from imaging sensors from a satellite platform contains deficiency. To find over such flaws and to get creativity of information, it has to feel various phases of processing. The three general phases so as to all types of data have to go through while using digital technique are Pre- processing, enhancement and display, information extraction [9]. In this circumstance, image processing has proved itself to be a extremely helpful tool. Images captured throughout satellite can added be analyzed by a variety of methods to gain the needed information.
1.2 Previous work
A Monthly Double-Blind Peer Reviewed Refereed Open Access International e-Journal - Included in the International Serial Directories International Journal in IT and Engineering
http://www.ijmr.net.in email id- [email protected] Page 3 Drought Severity Index. PDSI is widely used for drought monitoring. BMVCI was observed to confirm unfavorable conditions for cotton production. The conclusion was derived from a study of 16 years of data. Proposed methodology proved to be a useful tool for early assessment of cotton production in Greece.[1]
Study by A. R. Reddy in 2013 assessed the spatio-temporal variations in cotton yields in India. The study indicated that among cotton growing districts in India, large quantum of spatial as well as temporal variations exist in cotton yields. It was observed that in 33 districts in India, cotton is grown in large area, yet the productivity is low. Study clarified as irrigated area, nitrogen and phosphorus are the main factors causing these variations. Increasing the levels of these three variables would increase the productivity of these districts. Compound growth rates, coefficient of variation, regression and generalized entropy were used to quantify the variability and to find factors responsible for this variation. [2]
A web based tool named as Identification is used to help the people who are not experts in identifying plant diseases in a particular way, which is totally based on the picture selection and/or little text descriptions. It is applicable when no suitable images exist, which represents the symptoms on a specific sample of plant tissues. The user can access this system from anywhere, it can be said as a multi accessed system, because the multi-access key of identification has to be generated, and it from the remote side or desktop computers or smart phone operators can easily use it. In this, the user selects pictures approaching the symptoms and the system give the most probable disease. [3]
The other study for the identification of symptoms of a plant disease, where the images are colored is a machine vision system. The region, where the diseases found, in the digital pictures were improved, separated, and a set of features were removed from each of them. Inputs to a Support Vector Machine (SVM) features were then used as classifier and tests were performed to identify the best organized model [4][5]. Proposed plant classification based on wavelet transforms and support vector machines. The experiment results show that the combine method had higher recognized and faster processing speed.
One study based on leaf image has been done. Some chemicals applied to the plants on the periodic basis. This kind of technique was only applied to the plants where the leaves already have been defected with the disease. Hundreds of chili plants were observed to perform disease forecasting. To detect disease on the chili plant leaf, the image processing technique plays a very important and useful role. This system will help farmers for the future monitoring and plantation .[6]
A Monthly Double-Blind Peer Reviewed Refereed Open Access International e-Journal - Included in the International Serial Directories International Journal in IT and Engineering
http://www.ijmr.net.in email id- [email protected] Page 4 area estimation assisted by satellite remote sensing in Ukraine. Several image types like Landsat-5/TM, MODIS, LISS-III, AWiFS and RapidEye etc. were used in the study. Each of this kind of images was compared to the cost efficiency shared with a field assessment of a stratified sample of square segments. Also, image classification algorithms were trained with the help of field data that were collected “along the road”. As a finding, it was derived that the TM images from Landsat 5 showed the best results, in spite of the old age of this sensor. Only Landsat TM and MODIS reached cost-efficiency threshold from all the sensors that were tested[7].
It is important to know the crop area for the estimation of total crop production in the country which in turn plays major role in agricultural commodities management. Images received from satellites and derived products can be used effectively for area correction from ground observation. This paper compared results and conclusions of the Ukrainian study in 2010 exploring the possibility and efficiency of crop area estimation in assistance with optical satellite images. Various satellite images with sensors like Landsat-5/TM, MODIS, LISS-III, AWiFS and RapidEye were associated with field survey on a stratified square segment sample of the crop area. The efficiency of various sensors was studied and analyzed under below: (1) Relative efficiency, which indicates how many times the inaccuracy of area estimates can be compact with the help of satellite images. (2) Cost-efficiency that shows how much cost of ground surveys can be reduced for crop area estimation with the help of satellite images. With the help of these criteria, each satellite image type was separately applied to select optimal dataset. It was found that MODIS and Landsat-5/TM only could reach the thresholds set for cost efficiency. Remaining was not cost effective due to their high price. [8]
1.3 Purpose
The rationale of image processing is divided into the following groups:
Visualization - Observe the objects that are not visible. Image sharpening and restoration - To create a better image. Image retrieval - Seek for the image of interest.
Measurement of pattern – Measures various objects in an image. Image Recognition – Distinguish the objects in an image.
A Monthly Double-Blind Peer Reviewed Refereed Open Access International e-Journal - Included in the International Serial Directories International Journal in IT and Engineering
http://www.ijmr.net.in email id- [email protected] Page 5 1.4 Contribution of the paper
This paper will give a common description of the concepts used in image processing and how this technology is used in prediction of forecasting crop as well as leaf disease. The scope of this paper is very vital and concise.
II. Tools and techniques of Research
2.1 Scilab 5.5.0
New extended functionalities for GUI creations and best rendering of user interfaces
New uicontrols to create tabs, advanced and fully customizable graphical interfaces (adding icons, creating borders, etc.), new objects positioning and resizing capabilities.
New graphics capabilities providing users with an optimized interaction
Display of images in true colors, management of lighting on 3-D graphics, new interactions on graphics enabling to edit graphics handles directly on figures using the mouse.
MPI capabilities
Disabled by default, to leave the user the ability to adapt Scilab to its environment, MPI (The Message Passing Interface) capabilities are available in Scilab source tree for High Performance Computation users.
An interface to directly interact with Java external objects from Scilab, a dedicated module to read/write HDF5 files and datasets, and the ability to easily localize Scilab external modules.[14]
2.2 MATLAB R2010a
It supports the following graphics file formats:
BMP (Microsoft Windows Bitmap) HDF (Hierarchical Data Format)
JPEG (Joint Photographic Experts Group) PCX (Paintbrush)
PNG (Portable Network Graphics)
TIFF (Tagged Image File Format) XWD (X Window Dump)
MATLAB software provides different image processing techniques.
Image Processing Toolbox is used for converting satellite images into data.
III. Proposed System
A Monthly Double-Blind Peer Reviewed Refereed Open Access International e-Journal - Included in the International Serial Directories International Journal in IT and Engineering
http://www.ijmr.net.in email id- [email protected] Page 6
Fig. 1 Example of a Satellite image of a crop. Fig. 2 Example of a Crop area
3.2 Digital Images
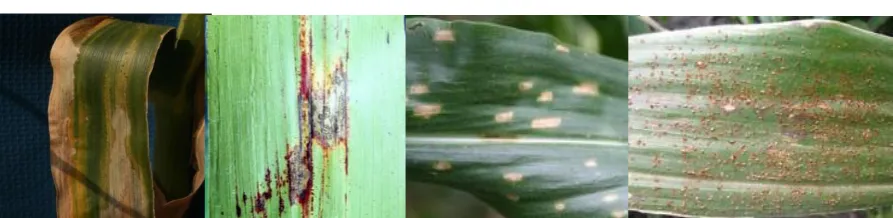
Fig. 3 Example of Digital images of plant disease.
Above Fig. 1 Shows area to be considered for crop forecasting of satellite image of a crop. Fig. 2: Shows the particular crop area of crop through satellite. Fig. 3 shows the plant affected from the disease.[13]
3.3 How to process
The proposed processing steps are below:
The obtained satellite images are processed by software.
Once we will make processing imagery, we may want to read or write that image so that we can, for example, place the processed image on the web. These instructions need the Image processing tool box.
Image processing provides techniques for reading or determining the value of an image.
This image processing tool determines the pixel values of an image and converts those pixel values into text data.
After getting data from satellite images, compare with actual data using forecasting methods.
Fig. 4 shows the overview of steps to devlop the proposed model. Typical Area to be
considered for crop forecasting Typical Area to
A Monthly Double-Blind Peer Reviewed Refereed Open Access International e-Journal - Included in the International Serial Directories International Journal in IT and Engineering
http://www.ijmr.net.in email id- [email protected] Page 7 Fig. 4. A process chart
IV. Conclusions
The benefit of this research is to gain reliable, commercial, suitable, and repeatable information on agricultural production, to differentiate, identify, measure and map the area of crop as well as predict the leaf disease using image processing techniques. With the introduction of Remote Sensing Technology and digital image processing, its great possible inside the field of agriculture have opened new vistas of civilizing the agricultural figures system all over the world.
Although there are some typical methods for image processing, there are no super image processing methods that can be regularly useful to all applications. Thus, it is a difficult task, as well as a hot research topic, to apply or develop image processing method fit for exact applications with high-resolution.
With the help of image processing, crop forecasting examination provides ability to determine prediction of yield production in a farm.
It is now recognized fact that image processing is an significant tool in crop analysis. There are many avenues where cost effective clarification, accurateness, straightforwardness are the major factors. There are sufficient of opportunities to build up a tool which is user forthcoming, easy yet it is cost effective.
Specifically, this paper focuses on the satellite images and digital images, commonly adopted image processing methods and using this method to predict the crop volume of the any crop area and prediction of leaf disease on any plant. This research is targeting on deriving the methodical simple methodology for crop and leaf disease forecasting through image processing.[12]
Collection of Image Image Pre processing
Classifying the data (based on Previous
data)
Concentrate(aquire) deffective part Develop the
A Monthly Double-Blind Peer Reviewed Refereed Open Access International e-Journal - Included in the International Serial Directories International Journal in IT and Engineering
http://www.ijmr.net.in email id- [email protected] Page 8 Applications: Following are the applications of image processing .[10]
Intelligent Transportation Systems Remote Sensing
Moving object tracking Defense surveillance Biomedical Imaging
Automatic Visual Inspection System
REFERENCES
Journal Papers:
[1] Domenikiotis, C. a. (2004). Early cotton production assessment in Greece based on a combination of the drought Vegetation Condition Index (VCI) and the Bhalme and Mooley Drought Index (BMDI). International Journal of Remote Sensing, 25, 5373-5388. doi:10.1080/01431160410001705033
[2] A. R. REDDY, S. M. (2013, July-Dec). Cotton productivity variations in India: An assessment. Cotton Research Journal, 5.
[3] Elad, I. P. (2012). Identificator: A web-based tool for visual plant disease identification, a proof of concept with a case study on strawberry. 144 - 154.
[4] Smith, A. C. (2009). Image pattern classification for the identification of disease causing agents in plants . Computers and Electronics in Agriculture , 121 - 125.
[5] Liu, j. (2009). A Method of Plant Classification Based on Wavelet Transforms and Support Vector Machine. 5754, 253-260.
[6] Husin, Z. a. (2012). Feasibility Study on Plant Chili Disease Detection Using Image Processing Techniques. (pp. 291-296). IEEE.
[7] Kussul, N. a. (2012). Crop area estimation in Ukraine using satellite data within the MARS project.
[8] Kussul, F. J. (2014). Efficiency assessment of using satellite data for crop area estimation in Ukraine . International Journal of Applied Earth Observation and
Geoinformation , 22 - 30.
A Monthly Double-Blind Peer Reviewed Refereed Open Access International e-Journal - Included in the International Serial Directories International Journal in IT and Engineering
http://www.ijmr.net.in email id- [email protected] Page 9 Web site:
[9] http://www.engineersgarage.com/articles/image-processing-tutorial-applications? page=1
[10] http://www.engineersgarage.com/articles/image-processing-tutorial-applications?page=2
[11] http://www.satimagingcorp.com/applications/natural-resources/agriculture/
[12] http://jpe.oxfordjournals.org/content/1/1/9.full
[13] https://www.plantvillage.com/en/topics/cornmaize/infos/diseases_and_pests_descript ion_uses_propagation