1486
Effect Of Rock And Fluid Properties On Pressure
Transient And Radial Flow During Fall-Off Test
Muhammad Taufiq Fathaddin, Ratnayu Sitaresmi, Mohammad Firdaus Sabaruddin, Kunto Wibisono, Ilman MuhammadAzmi
Abstract: The physical properties of rock and fluid tend to affect the velocity of transient pressure propagation and the formation of a radial flow pattern. In this study, the pressure fall-off test data of the X-1 well, which is one of five injection wells located in an oil field in Borneo Island was analyzed using software. Based on the well test result and other available data, a proper pressure fall-off test was designed for the field. Furthermore, sensitivity tests of several parameters, namely compressibility viscosity, permeability, porosity, and shut-in time were conducted, to analyze the effect of rock and fluid properties. The permeability and shut-in time were directly proportional to the radius of investigation, while porosity, compressibility, and viscosity were inversely proportional. A constant value of the correlation of investigation radius obtained from this research was 1491, whi le the radial flow periods were determined from the pressure derivative curve observed. The effect of porosity on the formation of radial flow regime was ign ored, the radial flow regime came earlier due to the increase in compressibility and permeability, while viscosity delayed the start of radial flow regime.
Index Terms: Oil Well, Pressure Fall-off Test, Pressure Transient, Radial Flow, Radius of Investigation, Injection, Shut-in Time. —————————— ——————————
1
INTRODUCTION
Xfield is located in Borneo Island, with its main formation primarily consisting of distributary mouth and marine sand bars with occasional limestone layers inter-bedded with clay-stones. The formation which consists of seven reservoir groups at subsea depths ranging from 1600 to 3500 feet was deposited in a proximal delta front environment. Its reservoirs drive mechanism is mainly solution gas. Due to the drop in field pressure from 1200 psi, five injection wells were drilled, with a pressure fall-off test performed at X-1 Well. The well test was conducted to characterize reservoir rock properties and based on the result, a proper design of the pressure fall-off test is developed. In addition, modeling and Method of PFO test have been developed for several cases. Economides et. al. (2010) introduced models for injecting fall-off response used for permanent pressure gauges installed at intervals for aquifer characterization and for CO2 leak detection [1]. Mahani et. al (2011) introduced a semi-analytical approach to infer the in-situ polymer rheology and induce fracture dimensions from PFO tests performed during polymer injection [2]. Laoroongroj et. al. (2012) developed a simulation model to determine in-situ viscosity of polymer solution during pressure fall-off test [3]. Van den hoek et. al. (2014) presented a practical interpretation methodology for polymer PFO tests [4]. Wu et. al (2015) developed a model for closed boundary leaky aquifer to account for effect of aquifer leakage on diagnostic plots of injection fall-off tests [5]. Irani and Ghannadi (2018) introduced analytical tool using time of flight concept to match the temperature fall-off test data [6]. While Qi and Ershagi (2019) derived analytical solution to monitor eroded intervals from pressure fall-off tests [7]. However, the objective of this research is to design a proper pressure fall off (PFO) test for injection wells using software.
Sensitivity tests were performed for several parameters namely compressibility, viscosity, permeability, porosity, and shut-in time to determine their effect on radius of investigation as well as on the beginning of the radial flow pattern period. Besides that, the analyses results were used to determine a constant which correlates with the radius of investigation as a function of production time, rock and fluid properties [8].
2
LITERATURE
REVIEW
Pressure fall-off (PFO) test has been applied in several cases, such as in immiscible WAG flooding [9], shale reservoir [10], deep water field [11], multi zone waterflood [12], SAGD wells [13] etc. It is usually preceded by a prolonged injectivity test, with a rise in the bottom hole pressure during injection and a decrease after it is shut in. Furthermore, the measurement and analysis of pressure data is taken after the injection well is shut-in [14, 15, 16]. The data are then analyzed and used to evaluate the reservoir and wellbore properties. From the pressure fall-off test analysis, information such as permeability, reservoir pressure, skin factor, and fracture length is obtained [15, 16, 17]. After the injectivity test which lasted for a total time of ti at a constant rate of q, the well is shut-in. The
pressure data obtained before and during the shut-in period is analyzed using the Horner plot method. In addition, the correlation between static bottom hole pressure and shut-in time t, is expressed by [16]
Where p* is the false pressure which equals the initial (original) reservoir pressure in a new field. A semilog plot of static bottom hole pressure pws versus log (ti+t)/t is linear
with a slope m. Therefore, the Product of kh is obtained from
After calculating the slope, the skin factor is estimated from the intercept at time equals to one or log t equals to zero. By rearranging equation (1), the skin factor is obtained as follows [15,16,18]
————————————————
• Muhammad Taufiq Fathaddin, Universitas Trisakti, +6282261181350. Email: [email protected]
• Ratnayu Sitaresmi, Universitas Trisakti
• Mohammad Firdaus Sabaruddin, PT. Pertamina EP • Kunto Wibisono, PT. Pertamina EP
1487 IJSTR©2020
www.ijstr.org The pressure fall-off curve is divided into three regions, namely early-time region (ETR), middle-time region (MTR), and Late-time region (LTR). During the early-time region (ETR), a pressure transient (pressure disturbance) moves through the formation nearest the wellbore. In addition, its curve is affected by altered permeability near the wellbore and storage, which must be considered due to its ability to affect the results of PFO tests performed. In middle-time region (MTR), the pressure transient moved away from the wellbore into the bulk formation. In the absence of severe reservoir heterogeneities, it tends to flow into or away from a wellbore through radial lines at a significant distance (In MTR and LTR). In this flow regime, fluids move toward the well from all directions and coverage and during its testing operation, radial flow regime must be reached to characterize reservoir better. This tends to enable engineers predict skin factor, reservoir permeability, pressure, etc. [18].
The time to reach radial flow (tradial flow) for both injection and
falloff periods is predicted using two different empirically-derived equations [15, 16, 18].
For injectivity period:
For falloff period:
where Cs, s, k, h, and µ are wellbore storage constant, skin factor, permeability, formation thickness, and viscosity, respectively. Pressure transient spreads through the drainage area of the well, at a rate independent of the distance. During the MTR the rate of bottom hole pressure changes and the propagation of pressure transient are determined by the reservoir rock and fluid characteristics such as permeability (k), porosity (), viscosity (µ), and total compressibility (ct).
While, in late-time region (LTR), the pressure transient reached the well drainage boundaries. The arrival of the pressure disturbance at the drainage boundary marks the end of the transient state and the beginning of the pseudo steady state, which does not naturally occur instantaneously. It actually takes a few seconds in the case of a well located at the center of a circular drainage area, and longer for other shapes. This short period of time is called the late transient [11]. The radius of investigation (ri) of a given test is the
effective distance traveled by the pressure from the tested well. Its values depend on the ability of the pressure transient signal velocity to pass through the reservoir rock. The pressure transient speed is basically influenced by the physical properties of the fluid and the reservoir rock itself. As time (t) increases, the reservoir is influenced by the well and the radius of investigation increases as given by [3, 9, 10]:
3 METHOD
Data were collected from previous well radius (rw), formation or
reservoir thickness (h), compressibility (ct), wellbore storage coefficient (C), formation volume factor of oil (Bo), and
reservoir pressure (pr) as listed in Table 1. While, other
variables were assumed such as skin factor (s), producing time (tp), shut-in time (t), and flow rate (q). The effective well
test design required consideration of which operational variables affected the estimates of the reservoir [19]. In this study, 68 sensitivity tests were performed on several variables namely compressibility, viscosity, permeability, porosity, and shut-in time to determine their effect on radial flow formation and radius of investigation (radius of pressure transient propagation). Ecrin v.4.0.2 software was used to predict the pressure response during the PFO test, while the simulation results were compared using well testing results. Based on the simulation results, the effect of the parameters on radius of investigation was analyzed. In addition, the simulation results were used to determine a constant that correlate radius of investigation as a function of time, rock and fluid properties.
4 RESULTS
AND
DISCUSSION
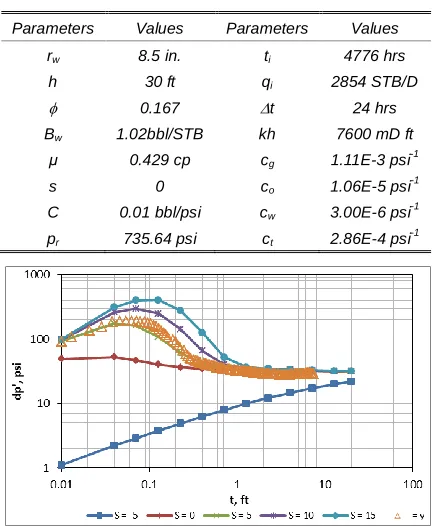
Figure 1 shows pressure derivative curve of PFO test results of X-1 well and the effect of skin factor with an increase in its hump. Based on the well test data and software calculation, the skin factor of the X-1 well obtained is 7.21, with a performance of a PFO test designed for the field. The results of the design were discussed in the following paragraphs.
Fig. 1. The effect of skin factor on pressure derivative curve.
TABLE1
WELL AND RESERVOIR DATA
Parameters Values Parameters Values
rw 8.5 in. ti 4776 hrs
h 30 ft qi 2854 STB/D
0.167 t 24 hrs
Bw 1.02bbl/STB kh 7600 mD ft
μ 0.429 cp cg 1.11E-3 psi-1
s 0 co 1.06E-5 psi-1
C 0.01 bbl/psi cw 3.00E-6 psi -1
1488
Figure 2 shows the effect of compressibility and viscosity on radius of investigation. The sensitivity test was carried out with viscosity values of 0.429, 0.700, 1.000, and 1.500 cp, while the compressibility values varied with values of 1.11E-03, 2.86E-04, 1.06E-05, and 3.00E-06 psi-1. The figure indicates that
Fig. 2. The effect of compressibility and viscosity on radius of
investigation ri
both viscosity and compressibility are inversely proportional to radius of investigation. The figure indicates that the greater viscosity is able to propagate pressure transient signal slower. This is due to the strong effect of viscosity in reducing the mobility of the fluid. Other result obtained from the figure is more rigid fluid causes the signal passing the fluid molecules moves faster. Porosity sensitivity test interval was determined based on core analysis and petrophysic data which ranged from 13 mD to 338 mD. This was followed by the sensitivity test with permeability parameter which was carried out with values of 13 mD, 78 mD, 143 mD, 208 mD, 273 mD, and 338 mD as shown in Figure 3. Using the same data source, porosity sensitivity interval was determined. The sensitivity test with porosity parameter was performed with values of 0.15, 0.17, 0.19, and 0.21 as shown in Figure 4. Figure 3 shows the effect of compressibility and permeability on radius of investigation with the ability to propagate pressure transient signal faster. This is in line with its effect on fluid flow in porous media, which is directly proportional to its mobility. Effect of compressibility and porosity parameters on the
Fig. 3. The effect of compressibility and permeability on radius
of investigation ri
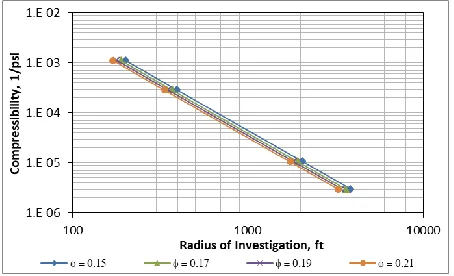
radius of investigation (ri) are shown in Figure 4. From the
figure, the effect of porosity and compressibility is inversely proportional to the investigation radius. When the porosity is greater, there tends to be more fluid volume contained in pore space of the reservoir rock. The pressure transient takes a
Fig. 4. The effect of compressibility and porosity on radius
of investigation ri .
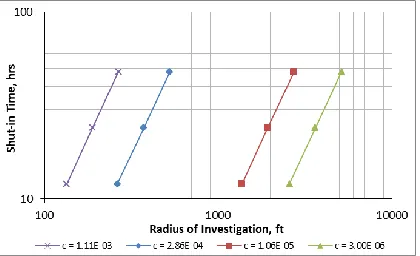
longer time to pass the fluid filled pore volume assuming the porosity is higher, as it propagates from molecule to fluid. Figure 5 and Table 4 show the effect of shut-in time (t) and compressibility on radius of investigation. The figure shows that radius investigation experiences an exponential advance with a decrease in compressibility and an increase in production time. The radial flow regime need to be achieved before the pressure transient reaches the reservoir boundary due to the analysis of the values of reservoir characteristics during the flow regime, such as skin value, permeabilitypressure, and others. Table 2 shows the compressibility effect at the beginning of radial flow period, where permeability is 143 mD, porosity is 0.17, and viscosity is 0.429 cp. As indicated in the table, the beginning of the radial flow comes earlier as the compressibility increases. Table 3 shows the effect of viscosity at 143 mD permeability, porosity is 0.167, and compressibility is 2.86E-04 psi-1. This indicated that viscosity has significant effect on the formation of radial flow and is directly proportional to its inception. Table 4 shows the effect of porosity at the beginning of radial flow period, where permeability is 143 mD, viscosity is
TABLE2
EFFECT OF COMPRESSIBILITY ON THE BEGINNING OF RADIAL
FLOW
Compressibility, psi-1 Radial flow, hrs
1.11E-03 0.802
2.86E-04 1.271
1.06E-05 2.015
3.00E-06 2.261
TABLE3
EFFECT OF VISCOSITY ON THE BEGINNING OF RADIAL FLOW
Viscosity, cp Radial flow, hrs
0.429 1.271
0.700 3.583
1489 IJSTR©2020
www.ijstr.org 0.429 cp, and compressibility is 2.86E-04 psi-1. This indicated that the effect of porosity on the formation of radial flow pattern tends to be ignored. Table 5 shows the effect of permeability at the beginning of radial flow period, where porosity is 0.167, viscosity is 0.429 cp, and compressibility is 2.86E-04 psi-1. The table indicates that permeability is inversely proportional to the beginning of the radial flow period, and when it is 13 mD, it is not been formed within 24 hours. The constant (a) in (6) was determined for this study by plotting the values of investigation radius obtained from the simulator and (kt/µct)^0.5 to produce a straight line as shown in Figure 6. The constant (a) is the slope of the line which was equal to 1491. In order to validate the modified constant value (a), the radius of investigation calculated by the equation were compared with those obtained from the simulator for several cases as shown in Table 6. The table shows that the equation has a good agreement to simulator with its maximum difference less than 0.6%.
Fig. 5. The effect of compressibility and shut-in time on radius
of investigation ri
Fig. 6
4
CONCLUSION
Based on the simulation results and analyses presented above, several conclusions are made as follows. Permeability and shut-in time are directly proportional to radius of investigation while porosity, compressibility, and viscosity are inversely proportional. The constant value of the correlation of investigation radius obtained from this study was 1491. The effect of porosity on the formation of radial flow regime is ignored. In addition, the start of radial flow regime comes earlier as the compressibility and permeability increase, while viscosity puts it back.
5
ACKNOWLEDGMENT
The researchers are grateful to PT. Pertamina EP and Universitas Trisakti for their support.
6
REFERENCES
[1] C. A. E. Economides, A. Anchliya, and B. Song , “Pressure Falloff Test Interpretation for Leakage Detection during CO2 Injection in a Deep Saline Aquifer, ”Society of Petroleum Engineers, SPE-131675, 2010, doi:10.2118/131675.
[2] H. Mahani, T.G. Sorop, P.J. van den Hoek, and M. Zwaan, “Injection Fall-off Analysis of Polymer Flooding EOR,” Society of Petroleum Engineers, SPE-145125, 2011, doi:10.2118/145125.
[3] Laoroongroj, M. Zechner, T. Clemens, and A. Gringarten, ”Determination of the In-Situ Polymer Viscosity from Fall off Tests,” Society of Petroleum Engineers, SPE-154832, 2012, doi:10.2118/154832. [4] P. J. van den Hoek, H. Mahani, T. G. Sorop, A. D.
Brooks, M Zwan, S. Sen, K. Shuaili, and F. Saadi, “Application of Injection Fall-off Analysis in Polymer Flooding,” Society of Petroleum Engineers, SPE-154376, 2012, doi:10.2118/154376.
[5] X. Wu, P. Srivastava, and F. H. Escobar, “A New Model to Determine Leakage Factor for a Finite
TABLE4
EFFECT OF POROSITY ON THE BEGINNING OF RADIAL
FLOW
Porosity Radial flow, hrs
0.15 1.271
0.17 1.271
0.19 1.271
0.21 1.271
TABLE5
EFFECT OF PERMEABILITY ON THE BEGINNING OF RADIAL FLOW
Permeability, mD Radial flow, hrs
13 -
78 4.510685
143 1.271284
208 0.567862
273 0.319332
338 0.22607
TABLE6
VALIDATION FOR MODIFIED CONSTANT VALUE
(kt/ct) 0.5
ri equation, ft ri
simu-lator, ft ri, % x y=(1/1491)0.5x
44946.66 1164.02 1170 0.51
5387.63 139.53 140 0.34
11920.07 308.70 309 0.10
20314.98 526.11 527 0.17
1490
Aquifer Using Pressure Fall off Test in CBM Reservoir,” Society of Petroleum Engineers, SPE-176998-MS, 2015, doi:10.2118/176998-MS.
[6] M. Irani and S. Ghannadi, “On Temperature Fall-off Interpretation in Circulation Phase of Steam-Assisted Gravity Drainage Process,” Society of Petroleum
Engineers, SPE-189740-MS, 2018,
doi:10.2118/189740-MS.
[7] Q. Qi and I. Ershagi, “Fall-off Diagnostic of Eroded Zones during Waterflooding of Unconsolidated Formations,” Society of Petroleum Engineers, SPE-195376-MS, 2019, doi:10.2118/195376-MS.
[8] M. T. Fathaddin, R. H. K. Oetomo, N. Hisanah, “Designing Pressure Build-Up Test on Heavy Oil Well by Alternating Oil Viscosity, Presented at Annual Applied Science and Engineering Conference, Denpasar, Bali, April 2019.
[9] B. A. Stenger, S. A. Al Kendi, A. B Al Katheeri, “Interpretation of Immiscible WAG Repeat Pressure Fall-off Tests,” Society of Petroleum Engineers, SPE-137062, 2010, doi:10.2118/137062.
[10]B. B. Yeager and B. R. Meyer, “Injection/Fall-off Testing in the Marcellus Shale: Using Reservoir Knowledge to Improve Operational Efficiency,” Society of Petroleum Engineers, SPE-139067, 2010, doi:10.2118/139067.
[11]N. Ojeke, K. A. Lawal, and D. Ibianga, “ Application of Injection Fall-off for Reservoir Characterisation and Production Optimisation: Cases from a Deepwater Field,” Society of Petroleum Engineers, SPE-167555, 2013, doi:10.2118/167555.
[12]Petrik and P. van den Hoek, “Multi-Zone Waterflood Top Seal Integrity Assurance: Insights from Advanced Pressure Fall Off Analysis Using Smart Well and DTS Technologies Offshore Sakhalin, Russia,” Society of Petroleum Engineers, SPE-181985-MS, 2016, doi:10.2118/181985-MS.
[13]Y. Wang, A. Ferrise, and Y. Huang, “Study of Temperature and Pressure Fall-off during Shut-in and Slow-Down for SAGD Wells with Top Water,” Society of Petroleum Engineers, SPE-189720-MS, 2018, doi:10.2118/189720-MS.
[14]E. Y. Ilfi, “Pressure Transient Analysis Using Generated Well Test Data from Simulation of Selected Wells in Norne Field,” Master Thesis, Norwegian University of Science and Technology, Trondheim, 2012.
[15]M. A. Sabet, Well Test Analysis. Gulf Publishing Company, Texas: Houston, pp. 371-388, 1991. [16]T. Ahmed and D. N. Meehan, Advanced Reservoir
Engineering. 2nd Edition, Gulf Professional Publishing, MA: Waltham, pp. 1-221, 2012.
[17]M. H. Maulana, M. T. Fathaddin, and R. H. K. Oetomo, “Well Test Analysis Using Pressure Derivative Method at Gas Well X-1,” Journal of Earth Energy Science, Engineering, and Technology, vol. 1, no. 1, pp. 25-32, 2018, doi:10.25105/jeeset.v1i1/3036. [18]U. Chaudhry, Oil Well Testing Handbook, Elsevier
Inc., MA: Burlington, pp. 1-503, 2004.