A Critical Evaluation Of Respiratory Function Testing
in Spontaneously Breathing And Ventilated Infants
A thesis submitted by Elizabeth Anne Jackson
for the Degree of Doctor of Philosophy
From The Portex Department of Anaesthesia, Intensive Therapy and Respiratory Medicine
Institute of Child Health
University College London Medical School University of London
ProQuest Number: U644210
All rights reserved
INFORMATION TO ALL USERS
The quality of this reproduction is dependent upon the quality of the copy submitted.
In the unlikely event that the author did not send a complete manuscript and there are missing pages, these will be noted. Also, if material had to be removed,
a note will indicate the deletion.
uest.
ProQuest U644210
Published by ProQuest LLC(2016). Copyright of the Dissertation is held by the Author.
All rights reserved.
This work is protected against unauthorized copying under Title 17, United States Code. Microform Edition © ProQuest LLC.
ProQuest LLC
789 East Eisenhower Parkway P.O. Box 1346
Abstract
At the inception of this thesis in 1991, there was increasing interest in infant
respiratory function measurements following the development of simpler methods of testing including the tidal breathing parameter ^ptef-A> passive respiratory mechanics
using the occlusion techniques and the rapid thoraco-abdominal compression technique (RTC). In addition, there were technological advances including the
introduction of automated equipment for use in intensive care. The main aim of this
thesis was to evaluate critically these recent advances.
Factors influencing the variability of ^ptef-^e were assessed, /ptef'^e was higher with greater within-subject variability during the first few weeks of life. Twenty to fifty
breaths are needed to obtain a representative value. Suggestions that ^ptef"^e could be measured using uncalibrated respiratory inductance plethysmography were not confirmed. Only a weak association between /ptef'^e and established plethysmographic measures of airway function could be demonstrated.
Passive respiratory mechanics measurements had a higher failure rate than plethysmography. An extremely variable relationship between respiratory and airway resistance was observed within infants although both were significantly higher in
infants with a history of wheeze.
The RTC proved useful in detecting airway disease in symptomatic infants. In
contrast to passive respiratory mechanics, the RTC is more satisfactory in the presence of airway disease than in healthy infants. The method continues to be refined
and is the most promising of the recent developments.
Assessments of automated measurement systems show the need to establish standards and ensure awareness of technical limitations of the equipment and the underlying assumptions of the measurement methods. The display of flow, volume and pressure
data may be all that is routinely possible in the clinical management of unparalysed ventilated infants. Technological advances in the measurement of dynamic
mechanics, including the development of catheter tipped microtransducers, may lead to the resurgence of dynamic mechanics measurements for research studies in this
Contents
Abstract 3
Contents 5
List of tables 15
List of figures 17
Symbols, abbreviations and units 21
Acknowledgements 25
Declaration 25
1. Introduction and aims 27
2. The history of infant respiratory function testing 31
2.1 The development of infant respiratory function testing 31
2.1.1 Early measurements 31
2.1.2 Dynamic mechanics measurements 31
2.1.3 Lung volume measurements and plethysmography 33
2.1.4 Techniques developed primarily for use in infants 34
2.1.4.1 Passive respiratory mechanics; multiple occlusion technique 34
2.1.4.2 Passive respiratory mechanics; single breath technique 35 2.1.4.3 Passive respiratory mechanics; interrupter technique 35
2.1.4.4 Passive respiratory mechanics; weighted spirometry 35
2.1.4.5 The rapid thoraco-abdominal compression technique 35
2.1.5 Tidal breathing parameters 3 6
2.1.6 Body surface measurements 36
2.2 Applications of infant respiratory function testing 37
2.3 Obstacles to the use of infant respiratory function tests 37
3. Equipment and methods 41
3.1 Pressure, airflow and volume measurements 41
3.1.1.1 Pressure transducers 41
3.1.1.1.1 Damping 41
3.1.1.1.2 Linear range 42
3.1.1.1.3 Coefficient of displacement 43
3.1.1.1.4 Frequency response 43
3.1.1.2 Flow and volume measurement 44
3.1.1.2.1 Steady state response 44
3.1.1.2.2 Working range 44
3.1.1.2.3 Frequency response 45
3.1.1.2.4 Response to temperature and gas composition 45
3.1.1.2.5 Dead space and resistance 45
3.1.1.3 Types of flow measuring device 45
3.1.1.4 Flow measuring devices; practical considerations 46
3.1.1.4.1 Influence of connectors 46
3.1.1.4.2 Gas composition, temperature and secretions 46
3.1.1.4.3 Pressurisation of PNTs during IPPV 47
3.1.1.5 Combining flow and pressure measuring equipment 47
3.1.1.6 Signal processing 47
3.1.2 Equipment for pressure, flow and volume measurements 48
3.1.2.1 Pressure transducers 48
3.1.2.2 Pneumotachographs 48
3.1.2.3 Data processing 49
3.1.2.3.1 Calibration 50
3.1.2.3.2 Data analysis 50
3.1.3 The measurement of tidal breathing parameters 50
3.2 Mechanics of breathing 51
3.2.1 The theory of dynamic mechanics measurements 52
3.2.1.1 Oesophageal manometry 53
3.2.1.1.1 Oesophageal balloon manometry 53
3.2.1.1.2 Liquid-filled catheters 53
3.2.1.1.3 Catheter tip pressure transducers 54
3.2.1.1.5 Occlusion testing 54
3.2.1.2 Calculation of dynamic mechanics 55
3.2.1.2.1 Mead-Whittenberger analysis 55
3.2.1.2.2 Multiple linear regression analysis 56
3.2.2 Equipment and measurement of dynamic mechanics 57
3.2.3 The theory of passive respiratory mechanics 58
3.2.3.1 The multiple occlusion technique (MOT) 58
3.2.3.2 The multiple interrupter technique (MIT) 61
3.2.3.3 The single breath technique (SET) 62
3.2.4 Equipment and measurement of passive mechanics 64
3.3 Whole body plethysmography 65
3.3.1 The theory of whole body plethysmography 65
3.3.2 Plethysmographic equipment and measurements 68
3.4 The rapid thoraco-abdominal compression (RTC) technique 71
3.4.1 The theory of the RTC technique 71
3.4.2 Equipment and measurement of Kmax,FRC 74
3.5 Body surface measurements 76
3.5.1 The theory of body surface measurements 76
3.5.1.1 The respiratory inductance plethysmograph (RIP) 76
3.5.1.2 Analysis of data from body surface measurements 78
3.5.2 RIP equipment and measurements 79
3.6 Measurement conditions 80
3.6.1 Body weight and length 81
3.6.2 Sedation and sleep state 81
4. Respiratory function m easurem ents for epidemiological and clinical
outcom e studies 83
4.1 The reproducibility of ^ptef*^e infancy 85
4.1.1 Introduction and aims 85
4.1.2 Materials and methods 85
4.1.2.2 Measurement methods 86
4.1.3 The effects of postnatal age on ^ptef-^e 87
4.1.3.1 Methods and subjects 87
4.1.3.2 Results 87
4.1.4 The influence of sedation on ^ptef-% 88
4.1.4.1 Methods and subjects 88
4.1-4.2 Results 88
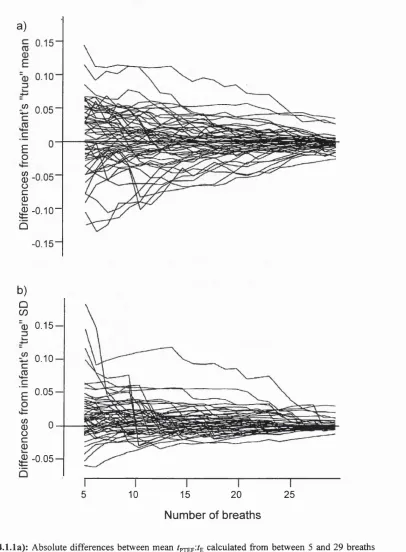
4.1.5 How many breaths should be analysed to determine ^ptef-%? 90
4.1.5.1 Methods and subjects 90
4.1.5.2 Results 91
4.1.6 Should ^ptef-^e be recorded from a single epoch? 93
4.1.6.1 Methods and subjects 94
4.1.6.2 Results 95
4.1.7 Short term within-subject variability 96
4.1.7.1 Methods and subjects 96
4.1.7.2 Results 96
4.1.8 Discussion 99
4.1.8.1 Effect of postnatal age 100
4.1.8.2 The effect of sedation 101
4.1.8.3 Number of breaths and epochs analysed 101
4.1.8.4 Within-subject variability 104
4.1.9 Conclusions 105
4.2 The relationship between tpjEF'^E specific airway conductance 107
4.2.1 Introduction and aims 107
4.2.2 Materials and Methods 107
4.2.2.1 Subjects 107
4.2.2.2 Study design 107
4.2.2.3 Measurement methods 109
4.2.2.4 Statistical methods 109
4.2.3 Results 110
4.2.4 Discussion 116
4.3 Uncalibrated respiratory inductance plethysmography for the measurement
of tidal breathing parameters 121
4.3.1 Introduction and aims 121
4.3.2 Materials and methods 121
4.3.2.1 Subjects 121
4.3.2.2 Study design 122
4.3.2.3 Measurement methods 123
4.3.2.4 Statistical methods 123
4.3.3 Results 123
4.3.4 Discussion 127
4.3.5 Conclusions 130
4.4 The relationship between respiratory resistance measured using the single
breath technique and airway resistance 131
4.4.1 Introduction and aims 131
4.4.2 Materials and methods 131
4.4.2.1 Subjects 131
4.4.2.2 Measurement protocol 132
4.4.2.3 Data analysis 133
4.4.2.4 Statistical methods 133
4.4.3 Results 133
4.4.4 Discussion 140
4.4.4.1 Flow and volume dependency of resistance 141
4.4.4.2 Potential influence of the rebreathing bag 142
4.4.4.3 Influence of changes in gas composition 143
4.4.4.4 Partitioning of respiratory system resistance 143
4.4.4.5 Passive versus dynamic resistance 144
4.4.4.6 Validity of the SET 146
4.4.5 Conclusions 147
4.5 Respiratory morbidity and respiratory function in the first year of life
following repair of oesophageal atresia 149
4.5.2 Subjects and methods 149
4.5.3 Results 152
4.5.3.1 Respiratory morbidity and one year respiratory function 152
4.5.3.2 The feasibility of respiratory function testing during natural sleep 161
4.5.4 Discussion 164
4.5.5 Conclusions 165
5. Respiratory function m easurem ents during assisted ventilation 167 5.1 A pilot study of the effect of cardiopulmonary bypass on respiratory
compliance in infants and young children 169
5.1.1 Introduction and aims 169
5.1.2 Materials and methods 169
5.1.2.1 Subjects 169
5.1.2.2 Protocol 170
5.1.2.3 Measurement methods 171
5.1.3 Results 173
5.1.3.1 Preoperative respiratory function 173
5.1.3.2 Postoperative respiratory function 173
5.1.3.2.1 Early postoperative 173
5.1.3.2.2 Late postoperative 176
5.1.4 Discussion 176
5.1.5 Conclusions 178
5.2 An assessment of the Capnomac Ultima™ for continuous monitoring of
respiratory parameters during IFFY in infants and young children 179
5.2.1 Introduction and aims 179
5.2.2 Materials and methods 179
5.2.2.1 Measurement methods 179
5.2.2.2 Subjects 183
5.2.2.3 Protocol 183
5.2.2.4 Data analysis 184
5.2.2.5 Statistical analysis 184
5.2.3.1 In vitro assessment of the D-Lite™ sensor 184
5.2.3.2 In vivo assessment of the Capnomac Ultima™ 184
5.2.3.2.1 Calibration checks 185
5.2.3.2.2 Tidal volume measurements 185
5.2.3.2.3 Airway pressure measurements 186
5.2.3.2.4 Respiratory timing measurements 188
5.2.3.2.5 Respiratory function indices 189
5.2.3.2.6 Ease of use of the Capnomac Ultima™ 189
5.2.4 Discussion 191
5.2.5 Conclusions 193
5.3 The assessment of neonatal pulmonary monitors 195
5.3.1 The in vitro assessment of neonatal pulmonary monitors 195
5.3.1.1 Introduction and aims 195
5.3.1.2 Materials and methods 197
5.3.1.2.1 Assessment of flow measuring apparatus 198
5.3.1.2.2 Assessment of airway pressure measuring apparatus 200 5.3.1.2.3 Assessment of oesophageal pressure measuring apparatus 200 5.3.1.2.4 Assessment of algorithms and calculation of dynamic
respiratory parameters 201
5.3.1.2.5 Assessment of dynamic mechanics measurements 202
5.3.1.3 Results 203
5.3.1.3.1 Assessment of the flow measuring apparatus 203
5.3.1.3.2 Assessment of airway pressure measuring apparatus 206
5.3.1.3.3 Assessment of oesophageal pressure measuring apparatus 207 5.3.1.3.4 Assessment of algorithms and calculation of dynamic
respiratory parameters 208
5.3.1.3.5 Assessment of dynamic mechanics measurements 209
5.3.1.4 Discussion 210
5.3.1.5 Conclusions 213
5.3.2 The in vivo assessment of neonatal pulmonary monitors 215
5.3.2.1 Introduction and aims 215
5.3.2.2.1 Subjects 215
5.3.2.2.2 Protocol 216
5.3.2.3 Results 217
5.3.2.3.1 Continuous monitoring 217
5.3.2.3.2 Dynamic mechanics from user selected breaths 217
5.3.2.3.3 Passive mechanics 219
5.3.2.3.4 Oesophageal manometry 220
5.3.2.4 Discussion 221
5.3.2.5 Conclusions 222
5.4 An assessment of the Drâger transducer tipped catheter for the measurement
of dynamic lung mechanics 225
5.4.1 Introduction and aims 225
5.4.2 Assessment of static accuracy and frequency response 227
5.4.2.1 Materials and methods 227
5.4.2.1.1 Static accuracy 227
5.4.2.1.2 Frequency response 228
5.4.2.2 Results 229
5.4.2.2.1 Static accuracy 229
5.4.2.2.2 Frequency response 229
5.4.3 The in vivo assessment of the MTC® 229
5.4.3.1 Materials and methods 229
5.4.3.1.1 Subjects 229
5.4.3.1.2 Measurement methods 231
5.4.3.1.3 Protocol 232
5.4.3.1.4 Data analysis 233
5.4.3.2 Results of in vivo studies 234
5.4.4 Discussion 236
5.4.5 Conclusions 240
6. D iscussion and future directions 241
6.1 Introduction 241
6.2.1 Tidal breathing parameters 241
6.2.2 Passive respiratory mechanics 245
6.2.3 Rapid thoraco-abdominal compression techniques 250
6.2.4 Measurements without sedation 252
6.3 Technological advances and infant respiratory function testing 254
6.3.1 Computing and automated infant respiratory function monitors 254
6.3.2 Flow measuring devices 257
6.3.3 Oesophageal manometry 258
6.4 Which respiratory function test when? 258
6.4.1 Epidemiological studies 258
6.4.2 Clinical research studies 260
6.4.2.1 Spontaneously breathing infants 260
6.4.2.2 Intubated infants 260
6.4.3 The place of respiratory function testing in clinical practice 265
6.5 Summary and future directions 266
References 269
Appendix 1 : Diary card (Section 4.5) 295
List of tables
Table of abbreviations and conversion factors 21
1.1: Thesis plan 29
2.1 : Applications of infant respiratory function tests 39
3.1: Characteristics of pneumotachographs 49
4.1.1: Subject details and the effect of sedation on tidal breathing
parameters 89
4.1.2: Variability of ^ptef-A during 5 successive breathing epochs in healthy
infants 94
4.1.3: Components of variance 95
4.1.4: Within-subject variability of ^ptef-^e 98
4.2.1 : Subject details 111
4.2.2: Lung function parameters 112
4.2.3: Regression analyses for ^ptef^^e healthy infants <13 weeks of age
(Group 1) 113
4.2.4: Regression analyses for /ptef-4 in older healthy infants (Group 2) and
those with prior lower respiratory illness (Group 3) 114
4.2.5: Distribution of infants by terciles for EE sG ^ and ^ptef-A for healthy infants <13 weeks of age (Group 1) and infants >13 weeks of age
with or without prior lower respiratory illness (Groups 2 and 3) 115
4.3.1: Subject details 119
4.3.2: Within-subject agreement between simultaneous measurements of
/pTEF^^E determined using a PNT and RIP 123
4.3.3 : Within-subject agreement between simultaneous measurements of
expiratory time (fg) determined using a PNT and RIP 124
4.4.1 : Percentage of infants in whom measurements of airway and
respiratory resistance were unsuccessful 133
4.4.2: Details of infants in whom satisfactory measurements of both airway
and respiratory resistance were obtained 134
4.4.3 : Lung function results; mean (SD) 135
4.4.5 : Effect of rebreathing on tidal breathing parameters 137
4.4.6: Effect of rebreathing on respiratory compliance and resistance
assessed by the single breath technique 140
4.5.1: Respiratory function in patients with repaired oesophageal atresia 150
4.5.2: Infant details and one year respiratory morbidity data 154
4.5.3: One year respiratory function data 156
5.1.1: Subj ect details 172
5.2.1: Resistance of the D-Lite^“ sensor 185
5.2.2: Subject details 185
5.3.1: A comparison of displayed and calculated respiratory parameters 209
5.3.2: Simultaneous values of Cjyn and R obtained using the Bicore CP 100 and the Fleisch PNT with Validyne transducers during IPPV of a
neonatal lung model 210
5.4.1: Subject details 231
6.1 : Assumptions of the MOT and SET methods of measuring respiratory
List of figures
3.1: Critical damping of transducer signal 42
3.2: Tidal breathing parameters 51
3.3: Mead-Whittenberger analysis of dynamic lung mechanics 57
3.4: The multiple occlusion technique 59
3.5 : Potential problems with the multiple occlusion technique 60
3.6: The multiple interrupter technique 61
3.7: The single breath technique 63
3.8: The infant plethysmograph 69
3.9: Determination of F'max.FRc 72
3.10: RTC flow-volume curves 73
3.11: Equipment for the RTC technique 74
3.12: Measurement of thoraco-abdominal asynchrony 81
4.1.1: Within-subject variability of ^ptef-^e 92
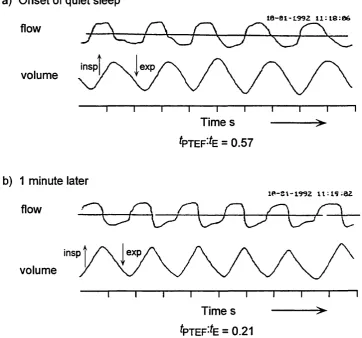
4.1.2: Variability of breathing pattern in a term neonate 93
4.1.3: Difference between repeat measurements of ^ptef^^e plotted against
mean in 64 healthy infants 97
4.1.4: Difference between repeat measurements of ^ptef-^e plotted against
postnatal age in 64 healthy infants 97
4.2.1 : Scattergram of and FRCp,^ in healthy infants aged 13 weeks
or less 114
4.2.2: Scattergram of ^ptef-^e and end expiratory specific airway
conductance in infants aged over 13 weeks 116
4.2.3 : The relationship between tidal breathing pattern and specific
airway conductance 118
4.3.1: Example of satisfactory RIP data 122
4.3.2: Comparison of uncalibrated RIP and a PNT for the measurement
4.3.3; Difference in /ptef-^e measured with uncalibrated RIP and a PNT
plotted against phase angle 126
4.3.4: Examples of RIP ribcage and abdominal signals to illustrate marked
differences in the shape of the expiratory waveform in healthy 129 infants
4.4.1 : The relationship between respiratory resistance and initial and end
expiratory airway resistance 138
4.4.2: The effect of rebreathing on a) respiratory compliance and
b) respiratory resistance assessed by the single breath technique 139
4.4.3 : a) An apparently linear flow-volume curve obtained with the SET. b) Example of a pressure-flow curve obtained in the same infant
showing elevated end expiratory airway resistance 145
4.5.1 : a) Initial inspiratory and b) end expiratory airway conductance
plotted against FRC 158
4.5.2: Examples of plethysmographic pressure-flow loops 159
4.5.3: max,FRC plotted against length for infants with oesophageal atresia
and normal infants 160
4.5.4: Examples of SET failures 162
4.5.5: Examples of RIP data 163
5.1.1: Preoperative respiratory mechanics 174
5.1.2: Comparison of MIT and MLR for the measurement of
preoperative respiratory compliance 175
5.1.3: Pre and postoperative respiratory mechanics 175
5.1.4: Comparison of MIT and MLR for the measurement of
postoperative respiratory compliance 177
5.2.1: The Capnomac Ultima™ D-Lite™ sensor 180
5.2.2: Respiratory parameters as defined by the Capnomac Ultima™ 182
5.2.3 : Comparison of the Capnomac Ultima™ and Fleisch PNT for the
measurement of a) inspiratory and b) expiratory tidal volumes 187
5.2.4: Comparison of the Capnomac Ultima™ and Fleisch PNT for
detecting changes in tidal volumes 188
5.3.1: The Bicore CP 100 196
5.3.2: Assessment of frequency response 200
5.3.3: Time based volume, flow and pressure plots during IPPV of a
neonatal lung model 202
5.3.4: The static accuracy of the Bicore CP 100 flow transducer 203
5.3.5: The resistance to flow of the Bicore CP100 204
5.3.6: Modified Bode plots of the frequency response of the Bicore
CP 100 flow transducer alone and with a 3.5 mm tracheal tube 205
5.3.7: Modified Bode plots of the frequency response of the Bicore
CP 100 airway pressure transducer 206
5.3.8: Pressure-volume characteristics of the original and modified
Bicore CP 100 oesophageal balloon 207
5.3.9: Static accuracy of the modified Bicore CP 100 balloon at the five
different filling levels 208
5.3.10: Examples of Bicore CP 100 flow-volume loops 218
5.3.11: Passive mechanics with the Bicore CP 100 219
5.3.12: An occlusion test with the Bicore CP 100 to illustrate the
unsatisfactory data display 220
5.4.1: The Drâger 3 French gauge MTC® catheter tipped transducer 226
5.4.2: Static accuracy of the MTC® over the range ±2.946 kPa 228
5.4.3 : Frequency response of the MTC® and amplifier 230
5.4.4: The phase relationship of the MTC® and a Hans Rudolph
pneumotachograph showing the PNT lags slightly behind 230
5.4.5: Occlusion test 232
5.4.6: Occlusion test data; AP,o plotted against APocs 235
5.4.7: Cjyn plotted against weight for each infant 236
5.4.8: R plotted against weight for each infant 237
5.4.9: Example of unsatisfactory data for dynamic mechanics with
Symbols, abbreviations and units
The symbols, abbreviations and units used in this thesis are based on the ATS-ERS Working Party on “Infant Pulmonary Function Testing”^ recommendations. The main abbreviations used and conversion factors between S.I. (System International) and
traditional units are summarised in the table below.
Table of abbreviations and conversion factors
abbreviation description abbreviation description
A alveolar E elastance
AB abdomen E, exp expiratory
ao airway opening EE end expiratory
aw airway(s) EEL end expiratory level
B barometric el elastic
BTPS body temperature. F female
barometric pressure
and saturated with / frequency
water vapour ^hco^ fractional inspired
C compliance carbon dioxide
concentration
Cl confidence intervals
fractional inspired
cm centimetre oxygen concentration
cmHjO centimetre of water ftl respiratory frequency
CPB cardiopulmonary
bypass
FEV, forced expiratory
volume in t seconds
dyn dynamic FRC functional residual
abbreviation description abbreviation description
FVC forced expiratory vital m metre
capacity
max maximal
G conductance
(1/ resistance) min^ per minute
airway conductance MIT multiple interruption
technique
g gram
mL millilitre
GA gestational age
MLR multiple linear
HBIR Hering-Breuer regression
Inflation reflex
mm millimetre
Hz hertz
mmHg millimetre of mercury
I, insp inspiratory
MOT multiple occlusion
i.d. internal diameter technique
II initial inspiratory ms millisecond
kg kilogram MUF modified ultrafiltration
kPa kilopascal oes oesophageal
L length P pressure
L litre Pa pascal
L lung PEEP positive end expiratory
LRI lower respiratory
pressure
illness PEE peak expiratory flow
abbreviation description abbreviation description
PEFV partial expiratory flow- rs respiratory system
volume curve
RTC rapid thoraco
pi pleural abdominal
pleth plethysmographic
compression technique
PNA postnatal age
RV residual volume
PNT pneumotachograph
s second
PTEF peak tidal expiratory
SBT single breath technique
flow SCM single compartment
PTIF peak tidal inspiratory
model
flow SD standard deviation
QDC qualitative diagnostic
calibration
specific airway conductance
QS quiet sleep
(Gaw/FRC)
R flow resistance
SIMV synchronised
intermittent mandatory
R respiratory ventilation
1^ coefficient of T tidal
determination
t time
RASP Respiratory Analysis
Program
expiratory time
RC ribcage A
inspiratory time
RIP respiratory inductance
plethysmograph
^PTEF time to peak tidal
abbreviation description abbreviation description
C duration total V gas flow
respiratory cycle
V
^ max maximal expiratory
tôt total flow
tp transpulmonary ^ m a x J ’RC maximal expiratory
TAA thoraco-abdominal
flow at FRC
asynchrony A delta; change in
URTI upper respiratory tract
variable
infection PS microgram
V gas volume o degree
K r tidal volume ° c degree Celsius
conversion factors
Pressure 1 cmHzO = 0.098 kPa 1 mmHg = 0.133 kPa
Compliance 1 mL cmHzO'^ = 10.2 mL-kPa*
Aknowledgements
The work presented in this thesis was completed with the help and cooperation of many parents, colleagues and fellow workers. In particular. Dr K Costeloe, Dr C
Dezateux, Ms I Dundas, Dr M Fletcher, Dr M Gappa, Ms A Hoo, Dr P Mannix, Ms L Pilgrim, the staff of the Special Care Baby Unit of the Homerton Hospital and the
theatre, ward, outpatient and intensive care staff of the Great Ormond Street Hospital for Children.
I thank my supervisors. Dr J Stocks and Professor DJ Hatch and acknowledge the financial support of Portex, Hythe, England.
Declaration
I was involved in all the research studies presented in this thesis, some of which were undertaken jointly with others.
I was responsible for the study design and the majority of the measurements as well
as the data analysis for the studies described in Sections 4.3, 4.5, 5.1, 5.2 and 5.3. Isobel Dundas undertook the plethysmographic measurements reported in section 4.5 and the study in Section 5.4 was undertaken jointly with Dr Gappa.
For the studies presented in Sections 4.1, 4.2 and 4 .4 1 was involved in data collection
1. Introduction and aims
Respiratory problems are a common cause of morbidity in the first few years of life.
Up to 40% of infants wheeze during the first year of life, some of whom will go on to develop childhood asthma, the prevalence of which is increasing.^ Respiratory disease
is especially important in very preterm infants who are at particular risk of developing chronic lung disease.^ Knowledge of the growth and development of the respiratory system is essential to the understanding of the effects of disease and how to prevent
and minimise damage to the lungs. In addition, objective assessments of respiratory function may contribute to the diagnosis and management of disease.
Respiratory function testing, using spirometry, for clinical, epidemiological and research purposes in adults and older children has been established for over 50 years."^ Measurements in infants have lagged behind largely related to the fact that infants are unable to cooperate with voluntary respiratory manoeuvres and need to be measured during sleep. This frequently necessitates sedation which adds to the duration of
testing, may preclude the sickest infants, can create parental anxiety and raises ethical issues when measurements are required primarily for research.
Despite the difficulties, the last 15 years have seen increasing interest in respiratory
function testing in infants. Initial tests were modified from those used in adults, for example dynamic mechanics and measures of lung volume. Subsequently simpler and less invasive tests were developed specifically for infants, including passive
respiratory mechanics measurements and the rapid thoraco-abdominal compression technique to obtain forced expiratory flow volume curves. Still more recently there has been interest in the evaluation of tidal breathing parameters for the assessment of
airway function.
At the inception of this thesis in 1991, infant lung function testing had become established for both population based (epidemiological) and clinical research studies.
Lung function testing was also being utilised in the management of individual patients although this application was more controversial, being largely based on
clinical experience rather than research evidence. The volume of epidemiological and
testing. This was partly as a result of the recently developed simpler methods of testing lung function and technological advances including the introduction of commercially available automated equipment. Neither the simpler methods nor the
technological developments had been thoroughly evaluated.
The main aim of this thesis was to evaluate critically recent advances in infant
respiratory function testing in both spontaneously breathing infants and infants
receiving respiratory support. A series of studies is presented each with its own introduction, methodology and discussion. In the final section the main findings of these studies are summarised and the implications of both this work, and published
Table 1.1: Thesis plan
Section Main contents
1. Introduction and aims
2. The history of infant respiratory function testing
2.1 • a review of the development of infant respiratory function testing up to the inception of this thesis in 1991 2.2 • a summary of current applications of infant respiratory function tests
2.3 • a summary of the obstacles to the use of infant respiratory function tests at the inception of this thesis 3. Methods
• a theoretical background to infant respiratory function testing • a description of the apparatus and methods used in the thesis 4. Respiratory function testing in spontaneously breathing infants
4.1-4.4 • studies evaluating simpler methods of assessing airway function (^ptef-% passive mechanics)
4.5 • a longitudinal study of respiratory function in infants with oesophageal atresia 5. Respiratory function testing in infants receiving respiratory support
5.1 • a pilot study of respiratory function in infants undergoing cardiac surgery discussing difficulties of current methods 5.2-5.3 • assessments of automated respiratory function monitors, the development of standards for such equipment
5.4-5 5 • assessments of a catheter tipped micro-transducer for monitoring oesophageal pressure and dynamic mechanics 6. Discussion
The main findings are summarised and discussed with the work of others to address: 6.2 • the limitations of simpler tests of respiratory function
6.3 • the contribution and limitations of technological advances
2. The history of infant respiratory function testing
This section will provide;
• a review of the development of infant respiratory function tests up to the inception
of this thesis in 1991
• a summary of the current research and clinical applications of infant respiratory function tests
• a summary of the obstacles to the use of infant respiratory function tests at inception of this thesis
2.1 The development of infant respiratory function testing 2.1.1 Early m easurem ents
Attempts at measuring adult respiratory function date from the 1700s when Humphrey Davy made the first lung volume measurements. The water spirometer was introduced for use in adults in 1846.^ Measurements in infants lagged behind; it was not until the 1890s that Eckerlein^ and Dohm^ measured tidal ventilation in infants
using a small spirometer attached to a face mask. The equipment used had excessive dead space and reasonable accuracy was not obtained until the introduction of the head-out plethysmograph by Murphy and Thorpe in 1931.* This permitted determination of tidal ventilation without any apparatus dead space. The apparatus
was refined by Cross in 1949 who introduced a better neck seal and reported tidal breathing parameters for term infants.^ The early plethysmographs incorporated water spirometers but a transducer system was introduced in 1950.*®
2.1.2 Dynamic mechanics m easurem ents
The measurement of dynamic mechanics became established in the 1950s. The concept of mechanical analysis of the respiratory system on which the measurements are based dates from a series of studies published by Rohrer in 1915 in which he
established the basic relationship between pleural pressure, lung elastic recoil
pressure and alveolar pressure.** Although Neergaard and Wirz applied these principles to a series of experiments in the 1920s*^ it was not until the 1950s,
numbers of measurements appeared. The first oesophageal balloon was described in 1952^^ and the following year Mead and Whittenberger published a description of dynamic lung mechanics measurements in adults.^"*
The first reports of dynamic mechanics measurements in healthy newborns was published by Mcllroy and Tomlinson in 1955.^^ In 1960 Karlberg et al published their methodology for the measurement of dynamic respiratory mechanics in the newborn
and highlighted the usefulness of pressure-volume plots of individual breaths to allow
visual evaluation of respiratory mechanics. In these early studies, tidal volume and flow were measured using the head out plethysmograph as, although the pneumotachograph was introduced by Fleisch in 1925, the first low dead space model
for use in infants was not introduced until 1960.^^
During the 1950s and early 1960s a series of articles described improved techniques,
including the development of the occlusion test and the appropriate characteristics for
oesophageal balloons for measurements in adults. The occlusion test is used to demonstrate that changes in oesophageal pressure accurately reflect those of pleural pressure. The test requires the subject to make respiratory efforts against an occluded airway and is therefore not applicable to paralysed subjects. Improvements in the use of oesophageal balloons for measurements in infants were described by Beardsmore et al in 1980.^^ In the 1970s and 1980s a number of studies in both animals^^ and sick
neonates^"^'^^ were published that suggested oesophageal pressure may not always reflect mean pleural pressure in the presence of chest wall distortion. These findings cast doubt on the method for assessing sick infants and on previously performed
studies using this technique in which the occlusion test had not been performed.
Although oesophageal balloons have been the most popular method of measuring
oesophageal pressure, liquid filled catheters have been described for use in adults^^ and in infants.^* Catheter tipped transducers consisting of miniaturised transducers
mounted on flexible catheters have also been used in both adults^^ and infants.^® Their use has been limited in part due to claims that they overestimate pleural pressure.^^
The Mead and Whittenberger technique for analysing dynamic mechanics, first
limitations especially when analysing data from mechanically ventilated subjects in whom total respiratory mechanics may be measured without oesophageal pressure monitoring if the infant is making no respiratory effort. Advances in computer
technology led to more complex methods of analysis being developed during the 1970s and 1980s, based on least squares r eg r e s s i o n ^ a n d multiple linear regression (MLR).^"^ In contrast to other methods, MLR allows data to be analysed in terms of
more complex models of the respiratory system than a linear single compartment model.
Another method of assessing dynamic respiratory mechanics involves imposing
oscillatory changes in flow at the airway opening and calculating respiratory impedance which reflects both resistive and elastic properties (forced oscillation
technique).^^ Although the technique was first introduced by DuBois et al in 1956^^ it has been used relatively little. In the late 1980s the method was reappraised^^ and Sly et al suggested it may prove useful in ventilated infants.^^
2.1.3 Lung volume m easurem ents and plethysmography
Soon after the measurement of dynamic mechanics became established, methods of measuring functional residual capacity (FRC) that could be adapted for use in infants were developed. Early measurements of lung volumes involved gas dilution techniques. The first measurements in infants were published in the late 1950s^^’^^ and used helium dilution which had first been described for use in adults by Willmon
and Behnke in 1948."^° The early helium dilution methods were only suitable for spontaneously breathing infants. Measurements in sick infants were not possible until
1970 when a system incorporating a rebreathing bag was introduced by Krauss and
Auld."^^
Although the nitrogen washout technique was suggested by Darling et al in 1940,"^^
measurements in infants using nitrogen as a tracer gas lagged behind measurements
using helium. The use of nitrogen as a tracer gas during air wash-in after oxygen breathing was first reported in infants in 1962"^^ however it was not until 1975 that
Ronchetti et al first described nitrogen washout measurements."^ The method was
circuits."^^ The method was adapted for use in ventilated infants by Sivan et al in 1990.“^
In the mid 1950s, at the same time as the helium dilution method was being developed for use in infants, whole body plethysmography was being developed for the measurement of FRC and airway resistance in adults by DuBois et al/^ '^^ This method was adapted for use in infants for the measurement of FRC in 1960^^^ and for
the measurement of airway resistance in 1961 by Polgar/^ With further
modifications, including the addition of a heated rebreathing circuit in the 1970s,^^’^^ the whole body plethysmograph became established as a standard method for
measuring FRC and airway resistance in infants.
2.1.4 Techniques developed primarily for use in infants
The relative complexity and invasiveness of whole body plethysmography and oesophageal manometry led to the development of tests specifically for infants;
including passive respiratory mechanics and the rapid thoraco-abdominal compression technique.
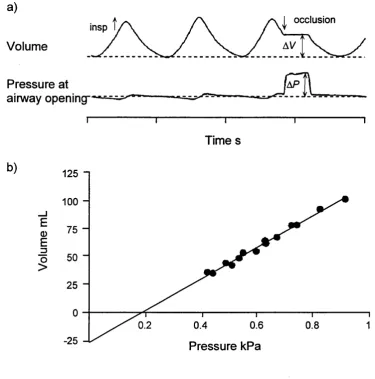
2.1.4.1 Passive respiratory mechanics; multiple occlusion technique
Comroe et al in 1954 were the first to publish measurements of respiratory mechanics using a passive expiration in anaesthetised cats and adults.^^ Originally, passive
respiratory mechanics measurements were limited to paralysed or highly trained subjects because of the need for muscle r e l a x a t i o n . I n 1976 Glinsky became the first to make use of the apnoeic pause, with respiratory muscle relaxation, induced in infants by the Hering-Breuer Inflation reflex, to study passive mechanics in unsedated
infants.^^ He developed the multiple occlusion technique (MOT) in which a series of airway occlusions is made during inspiration allowing a pressure-volume plot for the
respiratory system to be constructed; the slope representing static compliance. In 1982
Mortola modified the technique by using expiratory rather than inspiratory occlusions, which improved both the likelihood of successful measurement and the
reproducibility of measurements.^^ More recently the multiple occlusion method has been adapted to obtain the static pressure-volume relationship by making multiple
2.1.4.2 Passive respiratory mechanics; single breath technique
In 1982 Mortola described the measurement of the respiratory time constant and calculated respiratory resistance using this time constant and compliance, as assessed from the MOT?^ In the same year Zin developed the single breath technique (SBT) in
anaesthetised, but unparalysed cats, in which respiratory system compliance and resistance are measured from single breaths/^ A similar approach was described in spontaneously breathing and mechanically ventilated neonates by Le Souëf et al in
1984^^ and by Thomson et al in 1985.^°
2.1.4.3 Passive respiratory mechanics; Interrupter technique
The interrupter technique, which involves very rapid flow interruption and sophisticated analysis of the pressure and volume changes during a relaxed occlusion
was originally suggested by Neergaard and Wirz in the 1920s/^ The method was used in the 1950s^^’^^ but then essentially discarded as it was unclear what the technique
measured. In the 1980s Bates et al reappraised the technique demonstrating that airway resistance and the compliance and viscoelastic properties of the respiratory system were being assessed.^^'^^ In 1988 Sly et al suggested the interrupter technique may prove useful in ventilated infants.^^
2.1.4.4 Passive respiratory mechanics; weighted spirometry
Although weighted spirometry for the measurement of respiratory compliance was first described in adults and older children in 1965,^^ it has more recently been applied in infants.^^’^^
2.1.4.5 The rapid thoraco-abdominal com pression technique
Adler in 1978^^ first described a means of obtaining partial expiratory flow volume curves in normal sedated infants by means of rapid thoraco-abdominal compression. This technique was further developed in the 1980s by the introduction of an inflatable
jacket^®'^^ and, due to its relative simplicity, has become one of the most extensively
used techniques for assessing airway function in infants. In adults, the use of the full lung volume range for assessing voluntary forced expirations has been found to
applying negative pressure after passive inflation in the 1970s^^ there had been no
reports of raised lung volume assessments in spontaneously breathing infants at the inception of this thesis.
2.1.5 Tidal breathing param eters
Abnormalities of tidal expiratory flow pattern were noted in adults with respiratory diseases in the 1940s^'^'^^ and were first reported in children with asthma and cystic fibrosis in 1949 by Kaye et al^^ who suggested tidal flow recordings could be
clinically useful. However it was not until 1981 that Morris and Lane proposed the
detailed analysis of tidal expiratory flow pattern as a quantitative method for
assessing lower airway function based on studies in adults.^* Subsequently, reports of quantitative analyses of tidal expiratory flow patterns in infants with bronchopulmonary dysplasia appeared which concluded that such infants reach tidal
peak expiratory flow more rapidly than age matched normals.^^’*^
The need for very simple measures of respiratory function in infants that can be
applied in large epidemiological studies, preferably without the need for sedation, has led to a recent renewed interest in the analysis of tidal flow patterns.
2.1.6 Body surface m easurem ents
All the methods described so far require accurate measurement of airflow and volume
changes, which are most commonly measured with a pneumotachograph. However pneumotachographs may themselves affect ventilation,**’^^ require considerable
technical expertise, and necessitate the use of a tight fitting face mask. Consequently there have been numerous efforts to develop less invasive methods of measuring tidal
volume and respiratory timing. Methods that have been assessed in infants include impedance pneumography, magnetometers, strain gauges and respiratory inductance
plethysmography (RIP). The most recently developed, RIP, which was described in 1977*^ and assessed for use in infants in 1981,*"* has been shown to be the most
satisfactory for quantitative assessments.*^’*^ Various methods of calibration have been described*^’** including automated qualitative self calibration during tidal
of thoraco-abdominal asynchrony which has been suggested as a method of assessing airway function.^®’^^
2.2 Applications of infant respiratory function testing
At the inception of this thesis the main applications of infant respiratory function
testing were in research, both clinical and population based. Table 2.1 gives a classification of research applications. The other more controversial area in which
infant respiratory function testing was being used was in the clinical management of individual infants. Proposed clinical applications are also given in Table 2.1. The clinical applications were not clearly defined and were based largely on individual
clinical experience rather than research evidence. The increasing availability of automated measuring devices was leading to the increased use of infant respiratory
function testing especially in ventilated neonates.
2.3 O bstacles to the use of infant respiratory function tests
The main obstacle to high quality research using respiratory function measurements
as outcome parameters was the lack of ideal methods. The available methods suffered from one or more major disadvantage;
• they were highly complex, and therefore expensive and limited to specialist laboratories
• there was a lack of suitable reference values and limited knowledge about intra and inter subject variability
• they made fundamental assumptions that may not be met particularly in sick infants (e.g. that the respiratory system can be described by a single time constant
when using the single breath technique)
• they required the infant to be asleep therefore necessitating sedation in most
circumstances
• the relationship between the measured variable and respiratory mechanics was
poorly understood (e.g. ^ptef-^e)
As a result many of the studies that had been published could be criticised because of the use of unsuitable techniques or poor interpretation. Many studies involved
studies failed to consider the particular difficulties of measuring intubated and ventilated infants.
In the late 1980s several clinicians suggested that monitoring of respiratory
mechanics should be clinically useful especially during assisted ventilation.^"^’^^’^^ At the time there was minimal evidence to support this view with only one preliminary report of a study showing an effect on morbidity when ventilator settings were altered
according to regular pulmonary function testing in infants.^"* A possible explanation
for the lack of evidence was “the absence of a simple non-invasive and precise technique for the rapid quantitative determination of respiratory system mechanics in
Table 2.1: Applications of infant respiratory function tests
Research applications I Population based studies
i) to define normal lung growth and development
ii) to evaluate risk factors for subsequent respiratory disease II Clinical research studies
i) to define and quantitate pathophysiological processes
ii) to evaluate treatments including the short and long term effects of interventions and comparative studies - drugs e.g. bronchodilators and surfactant
- modes of respiratory support including mechanical ventilation and extra-corporeal membrane oxygenation
^ Potential clinical applications
i) to assist in diagnosis
ii) to assess disease severity and predict outcome iii) to monitor disease progression
iv) to evaluate and optimise therapies in individual infants - drugs e.g. bronchodilators and surfactant
3. Equipment and methods
This section provides a theoretical background to infant respiratory function testing and a description of the equipment and the methods of measuring respiratory function
used in this thesis. New respiratory function testing equipment assessed as part of the thesis and adaptations required for specific protocols are described in the relevant sections.
3.1 Pressure, airflow and volume m easurem ent
The majority of infant respiratory function tests involve the measurement of airflow
and volume changes at the airway opening, and the measurement of pressure changes.
3.1.1 The theory of pressure, airflow and volume m easurem ents 3.1.1.1 P ressure transducers
Most pressure transducers consist of a chamber containing a diaphragm which is
coupled to a sensing element. Movement of the diaphragm alters the electrical conductivity of the sensing element altering the electrical signal produced. The chamber of the pressure transducer is usually connected to the pressure source by tubing. Changes in pressure are transmitted to the transducer by displacement of small volumes of gas (or liquid) in the tubing, with the resulting change in chamber volume causing displacement of the diaphragm. Many transducers have connection ports on both sides of the diaphragm (differential pressure transducers) and hence their output
is determined by the pressure difference across the diaphragm. Differential pressure
transducers are used with most flow measuring devices as well as being used to measure pressures (e.g. at the airway opening) relative to atmospheric pressure.
The dynamic performance of pressure transducers depends on;
• damping
• linear range
• coefficient of displacement • frequency response
3.1.1.1.1 Damping
connecting tubing. In the absence of any resistance in the tubing, the transducer output for a step change in input will overshoot and then oscillate around the new
mean value. This is described as underdamped. As the amount of resistance in the system increases, the output for a step change in input will approach the new mean
value without overshoot and without oscillation. This is described as critically
damped. Further increases in resistance will result in overdamping with a delay in the output signal reaching the new steady state value. See Figure 3.1.
Figure 3.1: Critical damping of transducer signal
a) b)
7----C) d)
Solid line: Input signal. Dashed line: Output signal.
a): undamped, b): underdamped, c): critically damped and d): overdamped.
3.1.1.1.2 Linear range
3.1.1.1.3 Coefficient of displacement
The coefficient of displacement is defined as the change in volume of the transducer per unit change in pressure (AF7AP). The coefficient of displacement should be as
small as possible, requiring minimal physical displacement of gas or liquid in the connecting tubing and transducer. This is particularly important when measuring oesophageal pressure as when the coefficient is large, relative to the inherent
pressure-volume characteristics of the oesophagus, pressure will be lost within the
oesophagus itself in order to displace the transducer diaphragm. This will result in an underestimate of pleural pressure.^^
3.1.1.1.4 Frequency response
Frequency response defines the ability of a device to reflect changing signals accurately. Frequency response has two components;
• magnitude, usually expressed as attenuation, the ratio between the output and input signals
• phase, the temporal relationship between the input and output signals, expressed either in degrees or as a time lag
The frequency response of equipment depends on;
• dimensions • compliance
• medium being measured
In general, the larger the diameter and shorter the length of the equipment, including
connecting tubing, the better the frequency response. The less compressible the medium and the lower its inertia the better the frequency response. However, other factors including coefficient of displacement, damping and practicality also have to be
considered.
A greater frequency response is required for infant measurements than measurements in older children and adults because of their higher respiratory rates. The need to minimise dead space makes achieving a good frequency response more difficult. The
suggested as adequate for spontaneously breathing infants/^ with values of between 20 and 100 Hz being suggested for ventilated infants/^
3.1.1.2 Flow and volume m easurem ent
The measurement of flow or volume changes is essential to most measurements of respiratory function. As flow is the rate of change of volume, it is usual to measure
one and derive the other. In this thesis, flow has been measured and digitally integrated to give volume, the only exception being when respiratory inductance
plethysmography has been used (see Section 3.5.2). Only flow measuring devices will be considered further.
For the measurement of air flow at the airway opening of infants, a flow measuring
device must have the following characteristics; • predictable steady state response
• adequate working range
• adequate frequency response
• small or predictable dependence on gas temperature, humidity and composition
• low dead space
• low resistance to airflow
In addition ideally it should be easy to use.
3.1.1.2.1 Steady state response
The steady state response is the relationship between constant applied flows and the
output signal of the device. A linear relationship between the flow and the output of
the flow meter simplifies calibration and calculation of tidal volumes and mechanics. However, this has become far less important with advances in computer technology
that permit most non-linearities to be removed digitally, provided adequate calibration facilities exist.
3.1.1.2.2 Working range
The working range of a flow meter describes the range of steady state flows that the
instrument can measure accurately. The working range must encompass the maximum flows achieved by the infant. This will depend on the size of the infant,
increased flows related to airway occlusions or forced expiratory manouvres. The maximum flow capability is usually limited by alinearities at high flows. Even if such
alinearities are digitally corrected the resistance of the flow meter may become unacceptable. In general, the greater the maximum flow that can be measured the less
sensitive the flow meter is at low flows. Sensitivity at low flows is usually limited by noise in the measurement system and limited resolution of the signal amplification
and display system. Poor performance at low flows leads to inaccuracies in integrated values i.e. volume measurements.
3.1.1.2.3 Frequency response
Frequency response refers to the ability of a measuring device to reflect rapidly
changing signals accurately as discussed previously in Section 3.1.1.1.4. For the most commonly used flow measuring devices (linear resistive pneumotachographs) frequency response is determined largely by the transducer and connecting tubing rather than the actual pneumotachograph.
3.1.1.2.4 R esponse to tem perature and gas composition
Expired gas differs from inspired gas in terms of temperature, humidity and the partial pressures of oxygen and carbon dioxide. Measurements are often made with infants
breathing warmed, humidified and oxygen enriched air. If measurements are made during anaesthesia nitrous oxide may be used. Different gases will have different
densities and viscosities. An ideal flow meter would have a response that is independent of the physical characteristics of the gases measured.
3.1.1.2.5 Dead space and resistance
An ideal flow meter has both a low dead space and a low resistance across the working range of flows. In general the smaller the device the higher the resistance and
the less the working range. Smaller infants require lower dead space devices but can tolerate higher added resistance as their respiratory resistance is higher.
3.1.1.3 Types of flow measuring device
Several devices have been used to measure flow, the most popular being linear resistance pneumotachographs (PNTs). The linear resistance consists of either
types laminar flow is generated and a pressure drop develops that is dependent on the flow and the viscosity of the gas. The pressure gradient is measured using a
differential pressure transducer and amplifier. The frequency response of the PNT- pressure transducer system is greatly influenced by the connections between the PNT
and transducer. This is considered further in Section 3.1.1.4.1. Commercially
available Fleisch and screen PNTs come in a range of sizes to suit preterm infants to
adults. The minimum measured flow depends on the differential pressure transducer and amplifier used.
Many other types of flow meter have been described including;
• ultrasonic flow meters (see Section 6.3.2) • hot wire anemometers (see Section 6.3.2)
• nonlinear differential pressure based flow meters, e.g. variable orifice (see
Section 5.3) and phot tubes (see Section 5.2)
3.1.1.4 Flow m easuring devices; practical considerations 3.1.1.4.1 Influence of connectors
Flow meters are sensitive to the distribution of flow which is influenced by the geometry of the connectors and tubing (including tracheal tubes) on either side of the
flow meter. Both calibration and frequency response may be altered. Apparatus should therefore be both calibrated and assessed as used for measurements (see
Section 5.3; The assessment of neonatal pulmonary monitors).
3.1.1.4.2 Gas composition, temperature and secretions
Most linear resistive PNTs are used with a heating shell to prevent condensation
altering the resistance. Heating also prevents changes in gas viscosity between inspired and expired gas that otherwise occur due to temperature differences. Changes in gas composition e.g. the use of added oxygen or of anaesthetic gases will also alter
viscosity. It is therefore important that PNTs are calibrated using an appropriate gas
mixture. Secretions deposited within the PNT during prolonged measurements can affect calibration. This is a particular problem in intubated infants but can be
3.1.1.4.3 Pressurisation of PNTs during IPPV
When a PNT is used within a ventilator circuit during intermittent positive pressure
ventilation (IPPV) it is subjected to pressure swings as gas is driven into the patient’s lungs. The pressure changes are usually large relative to the changes due to flow
across the PNT. There is no problem provided the airway pressure reaches both sides of the diaphragm of the differential pressure transducer simultaneously so that the differential pressure remains zero. However, any asymmetry in the construction of the
transducer or the connecting tubing will result in a differential pressure giving an erroneous flow measurement.
3.1.1.5 Combining flow and pressure measuring equipment
When combining measuring devices to measure respiratory function, the frequency response of each transducer must be matched i.e. the equipment must not introduce an
artefactual phase difference between pressure and flow changes. Combining equipment may degrade the frequency response of the components which should therefore be assessed for the fully assembled equipment. Care is necessary to ensure the airway opening pressure port is not placed in too narrow a part of the circuit or the pressure may be underestimated due to the Bernoulli effect.^^ When devices are
combined it is important to consider the total dead space and resistance.
3.1.1.6 Signal processing
The output of most transducers is in the order of microvolts or millivolts. In order to display and process the signals they must be amplified. Amplifiers usually have adjustable sensitivity or gain and often incorporate filters. Filtering is the process
whereby the relative amplitudes and phases of signals are changed in a systematic and frequency dependent way. The most commonly used filters during the measurement of respiratory mechanics are low-pass filters which attenuate or remove high
frequency signals. Signals that are to be processed by computer must be low-passed filtered to prevent aliasing. Aliasing is the distortion that results when high frequency signals are sampled at lower frequency. Filters are also used to eliminate unwanted
signals (noise). As filtering usually produces some phase change, it is important to
Most measurements of respiratory mechanics are now made using computers. The voltage signal generated by the amplifiers must be digitised using an analog to digital
converter. The analog signal is continuous but the computer stores a digital representation at defined intervals. The sampling frequency must be adequate to
reproduce the analog signal faithfully. Respiratory signals can be described in terms of a fundamental frequency and a series of harmonics. The number of harmonics that
need to be included depends on the complexity of the waveforms. The sampling frequency needs to be at least twice the highest harmonic frequency of interest. Recommended sampling frequencies and the measurement errors introduced by using
lower sampling rates have been published.^^ It is usual for the computer to integrate the flow signal digitally to generate a volume signal. Digital filtering to correct for
zero offset is often performed before further data analysis.
3.1.2 Equipment for pressure, flow and volume m easurem ents
This section provides details of the measuring equipment used for this thesis.
3.1.2.1 P ressure transducers
Unless otherwise stated, pressures were measured with Validyne (Northridge, CA) MP45 differential pressure transducers or Furness (Sussex, England) FC044
differential pressure transducers used with Validyne or Furness signal conditioning modules respectively. All simultaneously collected signals were collected with the same make of transducer. The low pass analog filters were set at 10 Hz unless otherwise stated. Transducers with linear ranges of ±0.2 kPa and ±5 kPa were used
with PNTs and to measure pressure at the airway opening respectively. Low
compliance, 3 mm internal diameter, translucent vinyl tubing (Portex, Hythe, England) was used to connect the transducers to the pressure ports on the PNTs or at
the airway opening. The minimum practical lengths of tubing were used and identical lengths used with all simultaneously used transducers.
3.1.2.2 Pneum otachographs
Unless otherwise stated, flows were measured using Fleisch (Lausanne, Switzerland)
the different PNTs connected with other components of the measuring apparatus. All PNTs were heated with shell heaters. Where connectors were required they were
constructed to avoid both excessive dead space and sudden changes in geometry that
may have resulted in turbulence. The PNTs were all used within their linear ranges. The physical characteristics of the PNTs are given in Table 3.1.
Table 3.1; Characteristics of pneum otachographs
Pneumotachograph Dead space
mL
Resistance! kPa L ' s
Linear range* L min '
Fleisch 0 2.5 0.43 ±15
Fleisch 1 10 0.10 ±27
Fleisch 0 + cable release shutter 7.6 0.48 ±15
Fleisch 1 + cable release shutter 15 0.11 ±27
Fleisch 0 + plethysmograph shutter 7.6 0.78 ±15
Fleisch 1 + plethysmograph shutter 26 0.48 ±27
Hans Rudolph 0-10 L min ‘ 1.3 1.11 ±10
Hans Rudolph 0-35 L mm'
1 4 AA T - J ^ •
6.8 0.27 ±35
3.1.2.3 Data processing
All signals were processed using IBM compatible 386 or 486 personal computers.
The analog outputs of the transducers were digitised using Analog Devices RTI 815 A-D converters. RASP (Respiratory Analysis Program, Physio Logic, Newbury,
England) software was used to process, display and record the data. Signals were sampled at frequencies of between 50 and 200 Hz depending on the type of
measurements being made and respiratory frequency. The flow signal was integrated digitally to yield volume. Data were collected in discrete epochs of 18-120 seconds depending on the sampling frequency, the number of simultaneous signals recorded
3.1.2.3.1 Calibration
Transducers for the measurement of pressure at the airway opening were calibrated by
applying two known pressure signals: 0 and +20 cmHjO (1.964 kPa) using a water manometer.
The flow signal was calibrated by applying two known flows: 0 and 100 or 150 mL-s*‘
(depending on the size of the infant to be measured) using calibrated rotameters
(KDG 1100, Sussex, England). The RASP software also allowed flow to be calibrated by applying known volume signals using a calibrated syringe (Hans Rudolph). This method was usually preferred when gas mixtures other than air were used. Flow
calibration was performed with the equipment assembled ready for use and using gases of the same composition as those used for the measurements.
All calibrations were checked prior to and after completion of each measurement session using known signals.
3.1.2.3.2 Data analysis
Data analysis was performed using RASP software. The program permits the operator to control data selection and apply acceptance criteria while automating the repetitive
mathematical processes involved in data analysis. All algorithms for derived parameters had been validated in the respiratory laboratory at the Institute of Child
Health.
3.1.3 The m easurem ent of tidal breathing param eters
Tidal breathing parameters, in particular based on the measurement of airflow
and volume are reported in Sections;
• 4.1: The reproducibility of ^ptef^^e infancy
• 4.2: The relationship between ^ptef*^e and specific airway conductance
• 4.3: Uncalibrated respiratory inductance plethysmography for the measurement of
tidal breathing parameters
Data for the analysis of tidal breathing parameters were collected during sleep (natural or sedated depending on the protocol) using an appropriately sized Fleisch or