Journal of Pain Research
Patients with persistent pain after breast
cancer surgery show both delayed
and enhanced cortical stimulus processing
Emanuel N van den Broeke1
Marjan de Vries1
Harry van Goor3
Kris CP Vissers1
Clementina M van Rijn2
Oliver HG Wilder-Smith1
1Department of Anesthesiology,
Pain and Palliative Medicine, Pain and Nociception Neuroscience Research Group, 2Donders Institute
for Brain, Cognition and Behavior,
3Department of Surgery, Radboud
University Nijmegen Medical Centre, HB Nijmegen, The Netherlands
Correspondence: Emanuel N van den Broeke
The Department of Anesthesiology, Pain and Palliative Medicine, Pain and Nociception Neuroscience Research Group, Radboud University Nijmegen Medical Centre, PO Box 9101, 6500 HB, The Netherlands
Tel +31 24 365 1583
Email [email protected]
Background: Women who undergo breast cancer surgery have a high risk of developing persistent pain. We investigated brain processing of painful stimuli using electroencephalo-grams (EEG) to identify event-related potentials (ERPs) in patients with persistent pain after breast cancer treatment.
Methods: Nineteen patients (eight women with persistent pain, eleven without persistent pain), who were surgically treated more than 1 year previously for breast cancer (mastectomy, lumpectomy, and axillary lymph node dissection) and/or had chemoradiotherapy, were recruited and compared with eleven healthy female volunteers. A block of 20 painful electrical stimuli was applied to the calf, somatopically remote from the initially injured or painful area. Simultaneously an EEG was recorded, and a visual analog scale (VAS) pain rating obtained.
Results: In comparison with healthy volunteers, breast cancer treatment without persistent pain is associated with accelerated stimulus processing (reduced P260 latency) and shows a tendency to be less intense (lower P260 amplitude). In comparison to patients without persistent pain, persistent pain after breast cancer treatment is associated with stimulus processing that is both delayed (ie, increased latency of the ERP positivity between 250–310 ms [P260]), and enhanced (ie, enhanced P260 amplitude).
Conclusion: These results show that treatment and persistent pain have opposite effects on cortical responsiveness.
Keywords: breast cancer surgery, persistent pain, nerve injury, event-related potentials, pain processing
Introduction
In recent years interest has grown in the alterations in brain processing present in patients with persistent pain. Brain imaging techniques such as functional magnetic resonance imaging (fMRI) and positron emission tomography (PET) have been used to investigate brain function by measuring the evoked response to applied somatosensory
stimuli.1,2 The results regarding altered pain processing by the brain in the context of
persistent pain are highly incongruent, perhaps due to large variability between the patients regarding pain history, pain etiology, pain distribution, and psychological
characteristics.1,2
Use of a postoperative model may help overcome some of these problems, because it permits study of a homogenous patient population regarding pain etiology, pain distribution, and treatment. Furthermore, this model makes it possible to differentiate between the effect of treatment and the effect of pain because a comparative patient group (same treatment, but no pain) can be included for comparison.
Dove
press
O R I G I N A L R E S E A R C H
open access to scientific and medical research
Open Access Full Text Article
Journal of Pain Research downloaded from https://www.dovepress.com/ by 118.70.13.36 on 24-Aug-2020
For personal use only.
Number of times this article has been viewed
This article was published in the following Dove Press journal: Journal of Pain Research
It has been shown that women who undergo surgery for breast cancer have a high risk of developing persistent
postsurgical pain.3–6 This pain persistence is difficult to treat
and is accompanied by a significantly diminished quality
of life.5,7
The often used generic term “postmastectomy pain syndrome” in cases of persistent pain after breast cancer treat-ment might suggest a homogeneous disease category. But
this is debatable.8 In fact, different types of pain have been
observed after breast cancer treatment, like phantom breast
pain,3,9 scar pain,10 neuropathic pain,6 complex regional pain
syndrome,11 pain arising from the axillary web syndrome,12
and the more recently prospectively investigated myofascial pain syndrome, which is typically observed during the first year after breast surgery including axillary lymph node
dissection (ALND).13
The etiology of persistent pain after breast cancer
treatment is probably multifactorial.8 This is because
breast cancer treatment includes different types of surgical interventions (eg, mastectomy, lumpectomy, sentinel lymph node biopsy, and ALND), and adjuvant therapies like chemotherapy, radiation and endocrine therapies. All these interventions may contribute to the development of persistent pain, and could have their own characteristics. However, nerve damage and radiotherapy appear to be
significant risk factors.8
A frequently observed phenomenon in persistent post-surgical pain conditions, and also in patients after breast cancer surgery, is a change in the sensitivity of tactile and pain processing. This change consists of a combination of sensory loss, particularly in the skin innervated by possibly
damaged nerves, and hypersensitivity.4,6,8,14,15
To our knowledge, studies investigating the evoked brain response using electroencephalography (EEG) in the context
of persistent postsurgical pain are scarce.2,16 In contrast to
fMRI and PET, EEG directly measures neuronal activity; furthermore, it makes it possible to study the sequential activation of different brain structures in time. The aim of this study is to investigate brain processing of painful stimuli using EEG (or more specifically, event-related potentials [ERPs]) in patients with persistent pain after breast cancer surgery. To investigate possible changes in ERPs as a result of the presence of pain, these results (ie, from patients with pain) are compared with those in women without persistent pain after breast cancer surgery. In addition, we aim to investigate possible ERP changes as a result of breast cancer treatment by comparing the results of the patients without pain with healthy female volunteers. Our main hypothesis
is that persistent pain is associated with an enhanced brain response to painful stimuli.
Materials and methods
Participants
Nineteen patients (eight women with pain and eleven without pain) who had been treated for breast cancer were recruited from a clinical database of the Radboud University Nijmegen Medical Centre. Approval for the study was obtained from the Medical and Ethical Review Board Committee Region Arnhem-Nijmegen, Nijmegen, The Netherlands (NL 30189.091.09). All subjects signed an informed con-sent form. At the moment of inclusion none had evidence of metastases or disease recurrences. All patients (with and without pain) had been operated more than 1 year ago at the time of participating. Patients had all undergone a mastec-tomy or lumpecmastec-tomy and ALND but no breast reconstruction. The rationale for investigating this population of patients is the high incidence of persistent pain after this type of surgery
(mastectomy or lumpectomy + ALND).3,4 Only patients who
had unilateral breast cancer were included. Persistent pain was defined as pain persisting continuously or intermittently
for more than 3 months after surgery.17
Besides patients, eleven healthy female volunteers were also recruited from the Nijmegen area. Patients as well as healthy volunteers were excluded from the study if they: 1. had undergone breast reconstruction,
2. had a psychiatric or neurological condition (for patients, neurological signs as a result of the treatment were excepted),
3. used pain medication or other medication that poten-tially affects brain processing, such as antidepressants, antipsychotics, antiepileptics, and benzodiazepines (hormone therapy as adjuvant therapy used by the patients excepted),
4. suffered from any pre-existing pain or pain syndrome. Subjects were instructed not to consume caffeine-containing beverages for twelve hours before the recording session. This was to avoid a caffeine-induced theta decrease
in EEG.18
Variables measured
Demographic and clinical characteristics
The composition of the two breast cancer surgery groups (with and without pain) was based on a standardized question (obtained via an interview by telephone) whether the patient experienced ongoing pain (yes or no) as a result of the breast cancer treatment. For confirmation, the same question was
Dovepress
van den Broeke et al
Journal of Pain Research downloaded from https://www.dovepress.com/ by 118.70.13.36 on 24-Aug-2020
asked again on the day of measurement, together with an additional standardized question (only if the patient expe-rienced pain) regarding pain intensity as a measure of past experienced pain load (“What is the averaged intensity of the breast treatment-related pain during the last three months on a numeric 0–10 rating scale (NRS)?”).
Other demographic and clinical characteristics obtained were age, menopausal status, surgical treatment, and chemo-therapy, radiation, and/or hormone therapy.
Patients who undergo ALND during breast cancer
treatment are at risk for developing lymphedema.19
Hypothetically, this could contribute to the persistence of pain. Therefore we measured limb volume differences (unaffected compared to affected limb) as an indirect reflection of the possible presence of lymphedema. To do so, we measured the limb volume of both sides (arms) via
water displacement.20 Subjects were instructed to lower
their arm slowly into a fully filled volume meter and asked to stop when the top of the volume meter came in contact
with the axilla.20 The amount of spilt water was collected in
a measuring cup (mL). The volume of the opposite (control) arm was also measured. The difference in volume of spilt water between the two sides (affected and control) was calculated. This test was also performed with the healthy volunteers to test if there are normally differences in volume between the two sides.
Data about the type of pain and pain-related sensory signs in the patients with pain were collected using the Douleur
Neuropathique 4 (DN4) questionnaire.21,22 This
question-naire includes pain descriptors as well as three clinical tests reflecting altered somatosensory processing. The tests were performed by a physical therapist. For measuring hypoes-thesia to touch, a brush (SENSElab, brush 05; Somedic, Horby, Sweden) was applied on different skin sites in the location of the pain. For measuring hypoesthesia to pinprick, a Semmes–Weinstein monofilament (nr. 5.07, 10.0 g) was applied to different skin areas in the location of the pain. For measuring brush evoked or increased pain within the location of pain, the same brush as for hypoesthesia was used. The effects of stimulation of the first two clinical tests (hypoes-thesia to touch and pinprick) were quantified by comparing the skin sites in the location of pain to a control site on the contralateral body site.
It is important to mention that, in this study, the DN4 questionnaire is not used as a screening or diagnostic instrument for neuropathic pain, because at present it is not validated for this purpose in this population of surgical patients. Thus we used the DN4 exclusively to collect data
regarding the clinical qualitative characteristics of the pain syndrome.
Patients of both groups (with and without persistent pain) were asked if they had experienced tactile hypoes-thesia or numbness since their treatment. If they did, they were asked to draw on a map the size and anatomical area of hypoesthesia.
Electrophysiological measures
A multichannel EEG (BrainVision; Brain Products GmbH, Waldkirch, Germany) was recorded during the experiment (band-pass 0.1–100 Hz, sample frequency 2000 Hz) with 64 active electrodes mounted in an elastic electrode cap. The electrodes were arranged according to the international 10–20 system and electrode CPz was used as common reference. Eye movements were detected by horizontal and vertical electrooculogram (EOG) recordings. Horizontal EOG was measured from the outer canthus of the left eye, and vertical EOG supra orbital to the left eye. Impedance
was kept under 20 kΩ for all leads.
Painful stimulation
Subjects received painful stimulation on the calf, between the medial and lateral head of the gastrocnemius, using a
concentric electrode (CE).23 Because of its concentric design
and small anode–cathode distance, this stimulating electrode produces a high current density at relatively low current inten-sities. In this way, depolarization is more limited to the
super-ficial layer of the dermis (where nociceptive [Aδ] fibers are
present) with less recruitment of deeper lying nonnociceptive fibers. Stimulation with this electrode produces a pinprick-like painful sensation. The stimulated site was balanced across patients with regard to the affected side. In healthy subjects, balancing was according to lateral dominance.
The stimulation protocol consisted of 20 double pulses (monopolar square wave; duration 0.5 ms and double-pulse interval 5 ms) with a random interpair interval ranging from 7 to 10 seconds. The double pulses were delivered through
the CE using a constant current stimulator (Twister®;
Dr Langer Medical GmbH, Waldkirch, Germany) and with an intensity of 150% of the individual pain threshold. This individual pain threshold was determined by an ascend-ing sequence of i ncreasascend-ing current intensities startascend-ing from 0 mA and in steps of 0.5 mA. This procedure stopped when the pain threshold was achieved, as verbally reported by the subjects. This threshold determination protocol was performed twice and the mean was used in the experiment to set intensity of stimulation.
Dovepress Cortical stimulus processing after breast cancer surgery
Journal of Pain Research downloaded from https://www.dovepress.com/ by 118.70.13.36 on 24-Aug-2020
During stimulation, subjects were comfortably seated in a chair and were instructed to passively perceive the stimuli with eyes closed (as this condition is less prone to artifacts), without making any movements. A computer display was placed in front of the subject (0.5 m) together with a computer mouse. The display was used to show the visual analog scale (VAS) (see Behavioral measure), preceded by a tone (65 dB). Participants were instructed to open their eyes after the tone and use the mouse to mark the VAS, after which they closed their eyes again.
Behavioral measure
In order to quantify the amount of pain as a result of the painful stimulation, subjects were asked to rate, at random times within a train of five double pulses, the amount of pain caused by the last received stimulus on a VAS. The VAS
ranged from 0 cm = ‘’no pain” to 10 cm = ‘’unbearable pain”
and was rated by the subject by moving the mouse pointer (vertical line) on a horizontal bar.
Procedure
At the beginning of the experiment, demographic and clinical characteristics were collected. Next, the individual pinprick-like pain thresholds for the double pulse stimulation were determined. Finally, subjects received the experimental pain-ful stimulation with simultaneous recording of the EEG.
Signal analysis
Event-related potentialsThe EEG was analyzed offline using Brain Vision Analyzer software (v. 2.0; Brain Products GmbH, Gliching, Germany) and MatLab (2011a; MathWorks, Natick, MA). As a first step, the continuous EEG was referenced to a common average (ie, all electrodes). Next, the EEG signal (2500 Hz) was high-pass filtered at 1 Hz and low-pass filtered at 30 Hz. Based on the onset of the stimulus, the EEG was segmented
into epochs from −100 ms prestimulus to 1000 ms
poststimu-lus with a total period of 1100 ms. Bad segments containing ocular artifacts were corrected using the Gratton–Coles
method.24 Segments were also inspected for other artifacts
like muscle or jaw and line noise activity, and were removed
if necessary. As a last step, baseline correction (−100–0 ms)
was applied to all segments.
For each subject separately, all segments were averaged to obtain an averaged subject-specific event-related potential waveform. ERP components were defined in terms of their latency and topographic distribution. Subsequently the grand average global field power (GFP) of all subjects was
calculated.25,26 Next, we calculated the topographic voltage
distribution corresponding to the ERP latencies identified in the GFP plot. Then we identified the electrode in the topographic plot which showed the maximal activity, and used this electrode for subsequent analysis. To insure accurate identification of point of maximal activity we also inspected the grand average ERPs (of all electrodes) for all subjects.
Individual ERP latencies were determined in the individual GFP plot corresponding to the windows of the
grand average GFP latencies.26 The mean amplitude of
each ERP component was calculated at the individual GFP
latency ± 5 ms at the electrode of maximal activity.26 The
rationale for using the mean activity instead of the more commonly used maximal peak value (baseline-to-peak) is that, the fewer trials included in the subject-specific average, the more residual noise is superimposed on the maximal peak, and thus the more the maximal peak of the subject-specific average will be determined by residual noise rather than by the peak of interest. Therefore, we calculated the mean amplitude instead of the maximal peak amplitude, because the former value is more stable and representative
of evoked activity.27
Statistical analysis
The software package GraphPad Prism 5 (GraphPad, San Diego, CA) was used for statistical analysis. Because of the small sample sizes and non-Gaussian distributions, nonparametric test statistics were used for between-group
comparisons. A Kruskall–Wallis test statistic (H) was used
for ratio variables. In the present study only two pairs of post-hoc comparisons were tested; healthy volunteers compared to patients without pain (effect of treatment) and patients without pain compared to patients with pain (effect of pain). The Dunn’s multiple comparisons test, which corrects for the number of statistical tests, was used as a post-hoc test.
The effect size r was calculated as the Z-score divided by the
square root of the total number of observations. Categorical
variables were tested using the chi-squared (χ2) test statistic
(P, 0.05).
Results
Clinical and demographical characteristics
Clinical and demographical characteristics are shown in Tables 1A–C and 2.
No statistically significant differences were observed between the three groups with respect to age and limb volume differences. Median age and limb volume differences scores (and interquartile ranges) are shown in Table 1A–C.
Dovepress
van den Broeke et al
Journal of Pain Research downloaded from https://www.dovepress.com/ by 118.70.13.36 on 24-Aug-2020
Table 1 Demographic and clinical characteristics of the patients (A) with pain, (B) without pain and (C) healthy volunteers (A)
Patient Age (years) Menopausal status Surgical treatment Additional treatment
Chemotherapy Radiation therapy Hormone therapy
1 52 Post Mast + ALND (II) Yes (FEC) Yes Yes (TAM)
2 50 Post Mast + ALND (II) Yes (TAC) Yes No
3 63 Post Mast + ALND (II) Yes (TAC) Yes Yes (TAM)
4 46 Post Mast + ALND (II) Yes (TAC) Yes Yes (TAM)
5 57 Post Mast + ALND (II) Yes (FEC) No Yes (TAM)
6 49 Post Lump + ALND (II) Yes (FEC) Yes Yes (TAM)
7 65 Post Mast + ALND (II) Yes (TAC) Yes Yes (TAM)
8 52 Post Mast + ALND (II) No No No
Median 52
Interquartile range 49–61
(%) 87.5 75.0 75.0
Patient Arm volume difference (mL) Location of pain Intensity pain (NRS)
Affected side –unaffected side Mean score of last 3 months
1 200 Arm + chest 6
2 −50 Arm 6
3 −60 Small area arm + chest (nipple and armpit) 6
4 20 Chest 3
5 170 Upper arm + chest 6
6 −40 Arm 3
7 60 Small area arm + chest 4
8 −110 Armpit (upper arm + top) + chest (scar) 4
Median −10 5
Interquartile range −57–142 3–6
(%)
(B)
Patient Age (years) Menopausal
status
Surgical treatment
Additional treatment Arm volume
difference (mL)
Chemo-therapy
Radiation therapy
Hormone therapy
Affected side –
unaffected side
1 32 Post Mast + ALND (II) Yes (TAC) No Yes (TAM) 30
2 49 Post Mast + ALND (III) Yes (TAC) Yes Yes (TAM) 260
3 58 Post Mast + ALND (II) Yes (FEC) No Yes (ARI) −50
4 45 Post Mast + ALND (II) Yes (TAC) Yes Yes (TAM) −80
5 42 Post Mast + ALND (II) Yes (FEC) No Yes (TAM) 0
6 53 Post Mast + ALND (II) Yes (TAC) Yes Yes (TAM) 170
7 58 Post Mast + ALND (II) Yes (TAC) No Yes (TAM) 100
8 56 Post Mast + ALND (III) Yes (TAC) Yes Yes (TAM) 330
9 47 Post Mast + ALND (III) Yes (TAC) Yes Yes (ARI) 140
10 65 Post Lump + ALND (II) No Yes Yes (ARI) 200
11 68 Post Lump + ALND (II) No Yes Yes (TAM)
and (ARI) 100
Median 53 100
Interquartile range 45–58 0–200
(%) 81.8 63.6 100.0
(Continued)
A significant association (χ2 (2) = 7.972, P = .019)
was observed between condition (healthy volunteers and patients) and menopausal status (pre- and post-). As can be seen in Table 1A–C, all patients (with and without pain) are postmenopausal, whereas 44% of healthy volunteers are premenopausal.
No significant associations were observed between the two patient groups (with and without pain) regarding
the type of surgical intervention (mastectomy + ALND or
lumpectomy + ALND) and incidences of adjuvant therapies
(chemotherapy, radiation, or hormone therapy). See also Table 1A–C for incidences. The results obtained from the
Dovepress Cortical stimulus processing after breast cancer surgery
Journal of Pain Research downloaded from https://www.dovepress.com/ by 118.70.13.36 on 24-Aug-2020
DN4 questionnaire are shown in Table 2. Figure 1 shows the topography of hypoesthesia (numbness) drawn by the patients (with and without pain).
Stimulation intensity
No statistically significant differences were observed between the three groups regarding the applied stimulation intensities for noxious stimulation for ERPs. Median (and interquartile ranges) stimulation intensities were: healthy volunteers 3.0 (2.7–4.2) mA, patients without pain 3.3 (3.0–3.7) mA, patients with pain 3.9 (2.7–4.7) mA.
Behavioral tests
No statistically significant differences were observed between the three groups regarding the VAS scores obtained during the noxious stimulation. Median VAS scores (and inter-quartile ranges) were: healthy volunteers 4.2 (2.5–4.7) cm,
patients without pain 3.0 (2.4–5.9) cm, patients with pain 2.5 (1.6–4.2) cm.
Event-related potentials
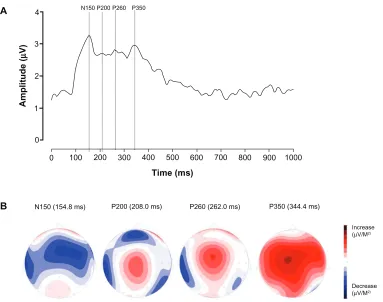
Based on the grand average GFP and corresponding
topo-graphic representations of all subjects (N = 30) shown in
Figure 2, we defined four distinctive ERP components: 1. A negative voltage between 110–180 ms, maximal at
electrode FCz, which we label as N150,
2. A positive voltage between 190–230 ms, maximal at Cz, which we label as P200,
3. A positive voltage between 250–310 ms, maximal at FCz, which we label as P260,
4. A positive voltage between 310–380 ms, maximal at Cz, which we label as P350.
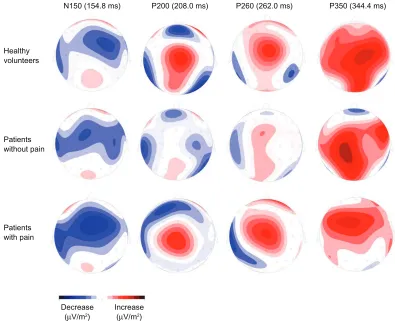
Figure 3 shows the topographic representations of the ERP components for each group at the ERP latencies.
Table 1 (Continued) (C)
Control subject Age (years) Menopausal status Arm volume difference (mL)
Positive difference between left and right side
1 63 Post 60
2 40 Pre 20
3 50 Post 70
4 61 Post 30
5 46 Pre 10
6 41 Pre 20
7 42 Pre 80
8 56 Post 30
9 62 Post 40
10 60 Post 70
11 61 Post 190
Median 56 40
Interquartile range 42–61 20–70
Abbreviations: MAST, mastectomy; LUMP, lumpectomy; ALND, axillary lymph node dissection with between brackets the level of axillary dissection I, II, or III28; TAC, docetaxal (Taxotere®) + doxorubicin (Adriamycin®) + cyclophosphamide; FEC, fluorouracil + epurobicin + cyclophosphamide; ARI, Arimidex®; TAM, tamoxifen.
Table 2 Results of the Douleur Neuropathique 4 questionnaire
Pain charcteristics Symptoms associated with the pain Symptoms present in pain location Burning Painful
cold
Electrical shocks
Tingling Pins and needles
Numbness Itching Hypoesthesia to touch
Hypoesthesia to pinprick
Pain after brushing
1 – – X X – X – – X –
2 X – – – – X – X X –
3 – – X X X X – X X –
4 – – – – – X X X X –
5 – – X – X X – X X –
6 – X X X X X – – – X
7 X – – – X X – X X –
8 X – X – X X – – X –
% patients 37.5% 12.5% 62.5% 37.5% 62.5% 100.0% 12.5% 62.5% 87.5% 12.5%
Notes: Shown are the individual patient characteristics as well as group percentages regarding type of pain, associated symptoms and clinical tests of the patients with persistent pain. – = no, X = yes.
Dovepress
van den Broeke et al
Journal of Pain Research downloaded from https://www.dovepress.com/ by 118.70.13.36 on 24-Aug-2020
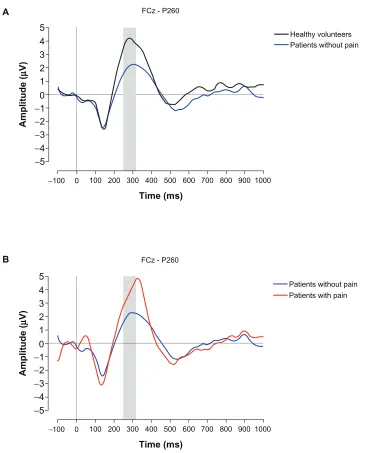
ERP amplitude
There were no statistically significant differences regard-ing N150, P200, and P350 between groups. Median and interquartile ranges are shown in Table 3. A statistical dif-ference was observed for the P260 between the three groups
(H (2) = 6.490, P= 0.039). Dunn’s post-hoc tests revealed a
sta-tistically significant difference between patients with pain
com-pared to patients without pain (P, 0.05; effect size r=−0.49).
Grand average ERPs of P260 are shown in Figure 4.
ERP latency
A statistically significant difference was observed between
the three groups (H (2) = 9.367, P = 0.009) regarding
P260 latency. Dunn’s post-hoc tests revealed a statistically significant difference between patients without pain and
healthy volunteers (P, 0.05; effect size r= 0.58) but also
between patients with pain compared to patients without pain
(P, 0.05; effect size r=−0.56). Median and interquartile
ranges are shown in Table 3.
Patients without pain
Patients with pain 75.0%
62.5% 50.0% 37.5% 25.0% 12.5% 54.5% 45.5% 36.4% 27.3% 18.2% 9.1%
Figure 1 Area of tactile hypoesthesia (numbness).
Notes: This figure shows the topographical map of areas of tactile hypoesthesia (numbness) drawn by the patients without pain and with pain. The scale of percentages shown in the legend represents the number of patients (converted to percentages) who marked that area as hypoesthetic.
Dovepress Cortical stimulus processing after breast cancer surgery
Journal of Pain Research downloaded from https://www.dovepress.com/ by 118.70.13.36 on 24-Aug-2020
Discussion
To our knowledge, this is the first study to investigate cortical processing by means of EEG and with this kind of stimuli in this group of patients. In comparison to patients without persistent pain, persistent pain after breast cancer treatment is associated with delayed and enhanced stimulus processing as reflected in an increased latency and enhanced amplitude of the ERP positivity between 250–310 ms (P260). Moreover, in comparison to healthy volunteers, breast cancer treatment is associated with acceleration of (reduced P260 latency) and a tendency towards less intense (smaller P260 amplitude) stimulus processing. These results suggest that the two conditions, ie, treatment and pain persistence, have opposite effects regarding cortical responsiveness.
Breast cancer treatment
and cortical processing
The comparison between the patients without pain and the healthy volunteers reveals the effect of treatment on corti-cal processing. This comparison revealed an acceleration of
stimulus processing (reduced P260 latency) in the patients without pain compared to the healthy volunteers. Moreover, there is a smaller late ERP amplitude (P260) in the patients without pain compared with the healthy volunteers, although this is not statistically significant according to the Dunn’s post hoc test. This is probably due to the small sample sizes
and the fact the P value has to be corrected for multiple
comparisons. Indeed, the effect size is r=−0.45.
Kreukels et al29 also observed a lower ERP amplitude
in disease-free breast cancer survivors who were treated for breast cancer (including surgery and radiotherapy). All patients underwent surgery and radiotherapy. In this study, the authors investigated the effect of different chemotherapy regimens on ERP activity in response to auditory stimuli (by using an odd-ball paradigm). Overall, they observed significantly reduced late ERP (ie, P3) amplitude between patients that received chemotherapy as compared to matched control patients who had not received chemotherapy. Moreover, a shorter P3 latency was observed after chemotherapy. The authors did not find any changes in midlatency N1 ERP amplitude or latency between
4
3
2
1
0
1000 900 800 700 600 500 400 300 200 100 0
N150 P200 P260 P350
Time (ms)
Amplitude
(
µ
V)
A
B N150 (154.8 ms) P200 (208.0 ms) P260 (262.0 ms) P350 (344.4 ms)
Increase (µV/M2)
Decrease (µV/M2)
Figure 2 Grand average global field power (GFP) and corresponding topographic representations. (A) Grand average GFP (N = 30). The dotted lines indicate peak latency of the different event-related potential (ERP) components. Four different components can be identified: a negative voltage between 110–180 ms, maximal at FCz, labeled as N150, a positive voltage between 190–230 ms, maximal at Cz, labeled as P200, a positive voltage between 250–310 ms, maximal at FCz, labeled as P260, and a positive voltage between 310–380 ms, maximal at Cz and labeled as P350. (B) Topographic representations of the ERP components at the ERP latencies (N = 30). To best illustrate the maximal activity in each representation, we adjusted the scale to its maximal absolute values (for increases and decreases in voltages). As a result the scale differs between the different representations and is therefore left out.
Dovepress
van den Broeke et al
Journal of Pain Research downloaded from https://www.dovepress.com/ by 118.70.13.36 on 24-Aug-2020
the two groups (with and without chemotherapy), a finding in agreement with the present study.
Are there alternative factors that can explain the reduced
brain activity? Regarding hormone therapy, Kreukels et al29
performed an additional subanalysis on their data in which they compared the ERP P3 amplitude between current, past, and never users of tamoxifen. They found no significant difference in P3 amplitude between the three groups, suggesting that
tamoxifen (and perhaps also other hormone therapy regi-mens) cannot explain the observed ERP reduction.
An as yet undefined pathophysiological process subse-quent to amputation, eg, deafferentation, might also change
EEG activity.30 This argument is based on the study by
Karl et al.30 Although not statistically significantly different,
a lower P3 amplitude was observed in the amputees without pain compared to the healthy controls.
Healthy volunteers
N150 (154.8 ms) P200 (208.0 ms) P260 (262.0 ms) P350 (344.4 ms)
Patients without pain
Patients with pain
Decrease (µV/m2)
Increase (µV/m2)
Figure 3 Group-specific topographic representations. Shown are the topographic representations of the different event-related potential (ERP) components at the different ERP latencies (Figure 2).
Notes: To best illustrate the maximal activity in each representation, we adjusted the scale to its maximal absolute values (for increases and decreases in voltages). As a result the scale differs between the different representations and is therefore left out.
Table 3 Event-related potential (ERP) amplitude and latencies
Healthy volunteers Patients without pain Patients with pain
Amplitude (μV)
Latency (ms)
Amplitude (μV)
Latency (ms)
Amplitude (μV)
Latency (ms)
N150 (FCz) −2.2
(−7.0–2.4)
133.2
(128.0–159.6) − 4.6 (−6.7–1.1)
148.8
(123.2–176.4) − 3.4 (−8.1–0.8)
156.2 (146.8–161.8)
P200 (Cz) 2.7
(−1.9–4.1)
196.8
(190.0–218.4) − 1.5 (−5.0–1.5)
208.0 (196.4–224.4)
0.5 (−0.9–4.9)
203.4 (198.2–227.7)
P260 (FCz) 4.0
(2.9–6.8)
279.2 (266.8–302.8)
1.3 (−0.6–4.1)
255.6 (250.0–266.0)
5.7 (2.5–8.2)
284.4 (265–305.2)
P350 (Cz) 3.6
(2.5–7.3)
355.6 (320.8–380.0)
3.0 (0.6–5.1)
348.4 (332.0–372.4)
4.3 (3.0–8.9)
336.8 (327–351.5)
Note: Shown are the medians (and interquartile ranges) of the ERP amplitudes and latencies of the different groups.
Dovepress Cortical stimulus processing after breast cancer surgery
Journal of Pain Research downloaded from https://www.dovepress.com/ by 118.70.13.36 on 24-Aug-2020
When we look at the clinical and demographic charac-teristics (Table 1), the proportion of premenopausal status among the healthy women compared to the patients without pain is different. Theoretically, this could be a further factor explaining the differences in P260 amplitude between the two groups.
Persistent pain and cortical processing
The comparison between the patients with and without pain reveals the effect of the presence of persistent postsurgical pain on cortical processing. Based on the results mentioned in the previous section, we suggest that breast cancer treatment (ie, chemotherapy) affects late ERP activity, ie, lower ERP
amplitude and shorter latency. The larger ERP amplitude (and increased latency) seen in the patients with pain compared to the patients without pain is likely the result of the presence of pain additional to the effect of breast cancer treatment. Therefore, we conclude that persistent pain after breast cancer treatment is associated with delayed (increased P260 latency) and enhanced (larger P260 amplitude) stimulus processing.
Interestingly, Karl et al,30 using an oddball paradigm,
compared visual P3 amplitude between upper limb amputees with and without persistent pain and healthy volunteers. Patients with pain showed significantly higher P3 amplitudes than patients without pain, but neither group were statistically different from the healthy volunteers. The latter result could
700 600 500 400 300 200 100 0
−100 800 900 1000
Time (ms)
700 600 500 400 300 200 100 0
−100 800 900 1000
Time (ms)
Amplitude
(
µ
V)
Amplitude
(
µ
V)
5 4 3 2 1 0
−1
−2
−3
−4
−5
5 4 3 2 1 0
−1
−2
−3
−4
−5
A
B
FCz - P260
FCz - P260
Healthy volunteers Patients without pain
Patients without pain Patients with pain
Figure 4 Event-related potential (ERP) waveforms. Grand average ERPs observed from FCz showing the P260 differences (A) effect of treatment, (B) effect of pain.
Notes: Upward deflection is positive charge and downward is negative charge. Representations of ERPs are with respect to common reference.
Dovepress
van den Broeke et al
Journal of Pain Research downloaded from https://www.dovepress.com/ by 118.70.13.36 on 24-Aug-2020
be due to the small sample sizes (patients with pain, N = 5;
patients without pain, N = 5; and healthy volunteers, N = 10).
However, the ERP findings observed in the study of Karl et al appear to involve later ERP activity (between 300–500 ms) than in our study (between 250–310 ms). Possible explana-tions for the different ERP activities affected in the two studies are the type of stimulus and paradigm used.
Methodological considerations
Defining (late) ERP components
The positivity around 260 ms (ie, P260) shares the same time course and topographic distribution as the previously described SP5 component (233–277 ms) evoked after painful
electrical stimulation.31 This ERP component seems to
over-lap with the greater later positivity SP6 or pain-related P2. The positivity around 350 ms, labeled as P350, might be the pain-related P2 evoked after painful electrical
stimulation.31,32 By comparing laser stimulation with
electri-cal sural nerve stimulation, Dowman showed that this P2, evoked after painful stimulation, has similar properties to the
commonly described P2, associated with selective Aδ fiber
activation, evoked after painful laser stimulation.33–36
However, Mouraux et al35 recently compared electrical
intraepidermal, electrical nonnociceptive transcutaneous and
laser stimulation for their selectivity in generating Aδ
fiber-associated evoked brain responses. They showed that only laser and low intensity electrical intraepidermal stimulation
are able to evoke Aδ-associated evoked brain responses.
Additionally, they showed that intraepidermal stimula-tion loses its selectivity with increasing stimulus intensity,
something that occurred above intensities of 2.5 mA.35
In the present study we used transcutaneous electrical stimu-lation with stimustimu-lation intensities around 3.0 mA, which indicates against the possibility that we selectively evoked
Aδ-associated brain responses.
Alternatively, the P350 could be a P3a-like component.31,37,38
This hypothesis can be supported by the facts that:
1. A “single stimulus” paradigm as used in the present study, in which only target but no standard stimuli are delivered with long, variable and random interstimulus intervals, is
able to evoke a P3a-like component,39,40 also after painful
electrical stimulation,31 and
2. this positivity shares the same generators in the brain as the classic P3a, as is demonstrated via intracranially-recorded cortical responses evoked after painful electrical stimulation. These generators include the dorsolateral and medial prefrontal cortices, temporal-parietal junction and
posterior hippocampus.37
Area of stimulation
In the present study, the painful stimuli were applied to a body part somatopically remote from the initially injured or painful area. We choose to do this because we wished to investigate cortical changes in pain processing (which one would expect to be generalized). For this, we need to stimulate in an area remote from the spinal segment undergoing nociceptive input due to breast cancer treatment. Our study therefore reflects only gener-alized but not locgener-alized effects of surgery or radiation therapy.
Sample size
An important methodological limitation of this study is the small sample size. This was the result of our opting for more strict inclusion and exclusion criteria (to avoid confound-ing factors), but has the advantage that the resultconfound-ing patient groups are very homogenous. Nevertheless, the ERP effects observed in the present study should be confirmed in a new future study with larger sample sizes.
Conclusions
This observational study shows that the two conditions, ie, treatment and persistent pain, have opposite effects regarding cortical responsiveness. Breast cancer treatment is associated with an acceleration of and a tendency to less intense stimulus processing. Persistent pain after breast cancer treatment is associated with delayed and enhanced stimulus processing. To our knowledge, this is the first study to investigate cortical processing by means of EEG and with this kind of stimuli in this group of patients.
Acknowledgments
The authors would like to thank drs Magarethe Schlooz and drs Annelies Werner for their efforts regarding the recruit-ment of the patients and Jos Wittebrood for the technical support. Finally they would like to thank all the patients and healthy subjects. This study was supported by the unrestricted EFIC Grünenthal Grant 2008 (see http://www.e-g-g.info/ grt-egg/EFIC_GRUENENTHAL_GRANT/Awards/2008/ Winners/78700358.jsp).
Disclosure
The authors report no conflicts of interest in this work.
References
1. Moisset X, Bouhassira D. Brain imaging of neuropathic pain. Neuroimage. 2007;37 Suppl 1:S80–S88.
2. Kupers R, Kehlet H. Brain imaging of clinical pain states: a critical review and strategies for future research. Lancet Neurol. 2006;5(12): 1033–1044.
Dovepress Cortical stimulus processing after breast cancer surgery
Journal of Pain Research downloaded from https://www.dovepress.com/ by 118.70.13.36 on 24-Aug-2020
Journal of Pain Research
Publish your work in this journal
Submit your manuscript here: http://www.dovepress.com/journal-of-pain-research-journal
The Journal of Pain Research is an international, peer-reviewed, open access, online journal that welcomes laboratory and clinical findings in the fields of pain research and the prevention and management of pain. Original research, reviews, symposium reports, hypoth-esis formation and commentaries are all considered for publication.
The manuscript management system is completely online and includes a very quick and fair peer-review system, which is all easy to use. Visit http://www.dovepress.com/testimonials.php to read real quotes from published authors.
3. Steegers MA, Wolters B, Evers AW, Strobbe L, Wilder-Smith OH. The effect of axillary lymph node dissection on prevalence and inten-sity of chronic and phantom pain after breast cancer surgery. J Pain. 2008;9(9):813–822.
4. Kehlet H, Jensen TS, Woolf CJ. Persistent postsurgical pain: risk factors and prevention. Lancet. 2006;367(9522):1618–1625.
5. Macdonald L, Bruce J, Scott NW, Smith WCS, Chambers WA. Long-term follow-up of breast cancer survivors with post-mastectomy pain syndrome. Br J Cancer. 2005;92(2):225–230.
6. Jung BF, Ahrendt GM, Oaklander AL, Dworkin RH. Neuropathic pain following breast cancer surgery: proposed classification and research update. Pain. 2003;104(1–2):1–13.
7. Stevens PE, Dibble SL, Miaskowski C. Prevalance, characteristics, and impact of postmastectomy pain syndrome: an investigation of women’s experiences. Pain. 1995;61(1):61–68.
8. Andersen KG, Kehlet H. Persistent pain after breast cancer treatment: a critical review of risk factors and strategies for prevention. J Pain. 2011;12(7):725–746.
9. Dijkstra PU, Rietman JS, Geerzen JHB. Phantom breast sensations and phantom breast pain: a 2-year prospective study and methodological analysis of literature. Eur J Pain. 2007;11(1):99–108.
10. Macrea WA. Chronic pain after surgery. Br J Anaesth. 2001;87(1): 88–98.
11. Graham LE, McGuigan C, Kerr S, et al. Complex regional pain syndrome post mastectomy. Rheumatol Int. 2002;21(4):165–166. 12. Leidenius M, Leppanen E, Krogerus L, et al. Motion restriction and
axillary web syndrome after sentinel node biopsy and axillary clearance in breast cancer. Am J Surg. 2003;185(2):127–130.
13. Torres Lacomba M, Mayoral del Moral O, Coperias Zazo JL, Gerwin RD, Zapico Goñi A. Incidence of myofascial pain syndrome in breast cancer surgery: a prospective study. Clin J Pain. 2010;26(4):320–325. 14. Maier C, Baron R, Tölle TR, et al. Quantitative sensory testing in the
German Research Network on Neuropathic Pain (DFNS): somatosen-sory abnormalities in 1236 patients with different neuropathic pain syndromes. Pain. 2010;150(3):439–450.
15. Gottrup H, Andersen J, Arendt-Nielsen L, Jensen TS. Psychophysi-cal examination in patients with post-mastectomy pain. Pain. 2000;87(3):275–284.
16. Apkarian AV, Bushnell MC, Treede R-D, Zubieta J-K. Human brain mechanisms of pain perception and regulation in health and disease. Eur J Pain. 2005;9(4):463–484.
17. Classification of chronic pain. Descriptions of chronic pain syndromes and definitions of pain terms. Prepared by the International Association for the Study of Pain, subcommittee on taxonomy. Pain Suppl. 1986;3:S1–S226. 18. Landolt H-P, Retey JV, Tonz K, et al. Caffeine attenuates waking and
sleep electroencephalographic markers of sleep homeostasis in humans. Neuropsychopharmacology. 2004;29(10):1933–1939.
19. Petrek JA, Pressman PI, Smith RA. Lymphedema: current issues in research and management. CA Cancer J Clin. 2000;50(5):292–307. 20. Sander AP, Hajer NM, Hemenway K, Miller AC. Upper- extremity
volume measurements in women with lymphedema: a comparison of measurements obtained via water displacement with geometrically determined volume. Phys Ther. 2002;82(12):1201–1212.
21. Bouhassira D, Attal N, Alchaar H, et al. Comparison of pain syndromes associated with nervous or somatic lesions and development of a new neuropathic pain diagnostic questionnaire (DN4). Pain. 2005;114(1–2): 29–36.
22. Van Seventer R, Vos C, Meerding W, et al. Linguistic validation of the DN4 for use in international studies. Eur J Pain. 2010;14(1):58–63. 23. Katsarava Z, Ayzenberg I, Sack F, Limmroth V, Diener H-C, Kaube H.
A novel method of eliciting pain-related potentials by transcutaneous electrical stimulation. Headache. 2006;46(10):1511–1517.
24. Gratton G, Coles MGH, Donchin E. A new method for off-line removal of ocular artifact. Electroencephalogr Clin Neurophysiol. 1983;55(4):468–484.
25. Skrandies W. Global field power and topographic similarity. Brain Topogr. 1990;3(1):137–141.
26. Boyle Y, El-Deredy W, Montes EM, Bentley DE, Jones AKP. Selective modulation of nociceptive processing due to noise distraction. Pain. 2008;138(3):630–640.
27. Picton TW, Bentin S, Berg P, et al. Guidelines for using human event-related potentials to study cognition: recording standards and publication criteria. Psychophysiology. 2000;37(2):127–152.
28. Reznik J, Cicchetti MG, Degaspe B, Fitzgerald TJ. Analysis of axillary coverage during tangential radiation therapy to the breast. Int J Radiat Oncol Biol Phys. 2005;61(1):163–168.
29. Kreukels BPC, Hamburger HL, de Ruiter MB, et al. ERP amplitude and latency in breast cancer survivors treated with adjuvant chemotherapy. Clin Neurophysiol. 2008;119(3):533–541.
30. Karl A, Diers M, Flor H. P300-amplitudes in upper limb amputees with and without phantom limb pain in a visual oddball paradigm. Pain. 2004;110(1–2):40–48.
31. Dowman R. The pain-evoked P2 is not a P3a event-related potential. Brain Topogr. 2004;17(1):3–12.
32. De Tommaso M, Santostasi R, Devitofrancesco V, et al. A comparative study of cortical responses evoked by transcutaneous electrical vs CO2 laser stimulation. Clin Neurophysiol. 2011;122(12):2482–2487. 33. Dowman R. Topographic analysis of painful laser and sural nerve
electrical evoked potentials. Brain Topogr. 2004;16(3):169–179. 34. Mobascher A, Brinkmeyer J, Warbrick T, et al. Laser-evoked
poten-tial P2 single-trial amplitudes covary with the fMRI BOLD response in the medial pain system and interconnected subcortical structures. Neuroimage. 2009;45(3):917–926.
35. Mouraux A, Iannetti GD, Plaghki L. Low intensity intra-epidermal electrical stimulation can activate Aδ-nociceptors selectively. Pain. 2010;150(1):199–207.
36. Arendt-Nielsen L, Bjerring P. Selective averaging of argon laser induced pre-pain and pain related cortical responses. J Neurosci Methods. 1988;24(2):117–123.
37. Dowman R, Darcey T, Barkan H, Thadani V, Roberts D. Human intracranially-recorded cortical responses evoked by painful electrical stimulation of the sural nerve. Neuroimage. 2007;34(2):743–763. 38. Polich J. Updating P300: An integrative theory of P3a and P3b. Clin
Neurophysiol. 2007;118(10):2128–2148.
39. Polich J, Heine MRD. P300 topography and modality effects from a single stimulus paradigm. Psychophysiology. 1996;33(6):747–752. 40. Mertens R, Polich J. P300 from a single-stimulus paradigm: passive
versus active tasks and stimulus modality. Electroencephalogr Clin Neurophysiol. 1997;104(6):488–497.
Dovepress
Dove
press
van den Broeke et al
Journal of Pain Research downloaded from https://www.dovepress.com/ by 118.70.13.36 on 24-Aug-2020