Open Access
Research
Are there differences between unconditional and conditional
demand estimates? implications for future research and policy
Budi Hidayat
Address: Department of Health Policy and Administration, Faculty of Public Health, University of Indonesia, Indonesia
Email: Budi Hidayat - [email protected]
Abstract
Background: Estimations of the demand for healthcare often rely on estimating the conditional probabilities of being ill. Such estimate poses several problems due to sample selectivity problems and an under-reporting of the incidence of illness. This study examines the effects of health insurance on healthcare demand in Indonesia, using samples that are both unconditional and conditional on being ill, and comparing the results.
Methods: The demand for outpatient care in three alternative providers was modeled using a multinomial logit regression for samples unconditional on being ill (N = 16485) and conditional on being ill (N = 5055). The ill sample was constructed from two measures of health status – activity of daily living impairments and severity of illness – derived from the second round of panel data from the Indonesian Family Life Survey. The recycling prediction method was used to predict the distribution of utilization rates based on having health insurance and income status, while holding all other variables constant.
Results: Both unconditional and conditional estimates yield similar results in terms of the direction of the most covariates. The magnitude effects of insurance on healthcare demand are about 7.5% (public providers) and 20% (private providers) higher for unconditional estimates than for conditional ones. Further, exogenous variables in the former estimates explain a higher variation of the model than that in the latter ones. Findings confirm that health insurance has a positive impact on the demand for healthcare, with the highest effect found among the lowest income group.
Conclusion: Conditional estimates do not suffer from statistical selection bias. Such estimates produce smaller demand effects for health insurance than unconditional ones do. Whether to rely on conditional or unconditional demand estimates depends on the purpose of study in question. Findings also demonstrate that health insurance programs significantly improve access to healthcare services, supporting the development of national health insurance programs to address under-utilization of formal healthcare in Indonesia.
Background
Several published studies on healthcare demand estimate the probabilities of using healthcare services conditional
on being ill sample [1-4]. The ill sample is usually gener-ated from self-assessments of health status. Conditional estimates are the preferred method because an
individ-Published: 5 August 2008
Cost Effectiveness and Resource Allocation 2008, 6:15 doi:10.1186/1478-7547-6-15
Received: 16 October 2007 Accepted: 5 August 2008
This article is available from: http://www.resource-allocation.com/content/6/1/15
© 2008 Hidayat; licensee BioMed Central Ltd.
ual's decision to seek treatment implies that they are ill, which is especially true in developing countries. Estima-tions of healthcare demand, therefore, often rely on esti-mating these marginal and conditional probabilities.
However, estimating healthcare demand conditional on the event of illness poses several problems. First, there may be an association between self-assessed health status and healthcare use [5], raising the possibility of endog-eneity (on the grounds that there are unobservable factors correlated with both the likelihood to report illness and to seek health care). The estimated responses of health care demand to exogenous variables based on an ill sample only would therefore be biased [6]. Second, conditional estimates may also be susceptible to an underreporting of the incidence of illness in surveys and, hence, would yield only a lower-bound estimate [7]. Finally, the total effects of prices on the demand can be inferred only from uncon-ditionalestimation [8] and such estimations would pro-duce long-run price effects [6].
This study examines the effects of health insurance on the demand for outpatient care, using the second round of the Indonesian Family Life Survey. The analysis was based both on samples of unconditional responses and on sam-ples of responses conditional on being ill. To construct the latter sample, this study used a definition of sickness that more accurately identifies people more likely to have used healthcare services. Individuals included in the definition were those who reported having at least one activity of daily living (ADL) impairment and/or a serious illness. This approach identified 5055 individuals in the condi-tional sample, around 31% of the total uncondicondi-tional sample (N = 16485).
The purpose of this study is two-fold: first, to compare the results of two approaches estimations – unconditional and conditional estimates; second, to investigate the effects of health insurance on the use of public and private outpatient care.
The setting for this study is the country of Indonesia. Located in Southeast Asia, Indonesia is an archipelago con-sisting of more than 17,000 islands. With a population of 231.6 million in 2007, Indonesia is the fourth largest country in the world after China, India and the United States [9]. Inadequate access to formal health care is a seri-ous problem in Indonesia. Following the economic crisis during 1997–1998, the proportion of household survey respondents who reported an illness or injury and sought care from a modern health care provider declined by 25% [10]. A policy option to improve access to formal health care has been articulated by enacted the National Social Security Law (UU No. 40/2004), which is now used as a basis for introducing a national health insurance program.
This article contributes more evidence on the relative magnitudes of conditional and unconditional demand effects on healthcare demand. It also adds to the existing evidence base by analyzing the effect of health insurance programs on healthcare demand in the context of a devel-oping country. In particular, this article provides evidence on whether proposing a national health insurance pro-gram would be welfare-enhancing in terms of increasing access to formal healthcare in Indonesia.
Methods
Data – Indonesian Family Life Survey
This study uses data from the second round of the Indo-nesian Family Life Survey (IFLS2), a panel survey carried out by the RAND Corporation in conjunction with Indo-nesian researchers and various international agencies. The first round of survey (IFLS1) included interviews with 7,224 households covering 22,347 individuals within those households. The second round of the survey, IFLS2, re-contacted the same households interviewed in IFLS1 and successfully re-interviewed 6,751 (93.5%) of the IFLS1 households. An overview of the IFLS1 and IFLS2 survey is described elsewhere [11,12].
Estimation – Multinomial Logit
The demand for healthcare is a function of health insur-ance and a set of exogenous variables. The dependent var-iable is outpatient care during the previous four weeks of interview in three provider options: self-treatment, public and private. I estimated a multinomial logit (MNL) model in the form [13]:
Equation (1) was estimated using the maximum likeli-hood procedure. The reference group is those who used self-treatment. The vector xi represents a set of exogenous variables and βrepresents regression parameters to be esti-mated. The estimated equations above provide a set of probabilities for the j+1 choices for an individual with characteristics xi.
The MNL model assumes that the stochastic portions of the conditional utility functions are uncorrelated across alternatives. The model therefore requires the assumption of 'independence of irrelevant alternatives (IIA)' be satis-fied [13]. To validate this assumption, both a Hausman specification and Small-Hsiao tests of IIA assumption were employed. Another alternative to the MNL, which is based on a reasonable distributional assumption on the behavior of the disturbance term, is a nested multinomial logit (NMNL). Yip et al. (1998) pointed out that the
Pr(Y j) e j i , ,
e k i k
j i= =
′ ′ = ∑
=
b
b x
x
for or
0
NMNL model produces essentially the same results as the MNL model [14].
To ascertain the pure effects of insurance, specifically on changes in the predicted probability of insurance across income groups and to show the magnitude effects implied by the coefficients, I used the recycling prediction method [15]. From the MNL estimation, the predicted probabili-ties were calculated by changing only insurance status and income quintile, while holding all other characteristics of the sample constant.
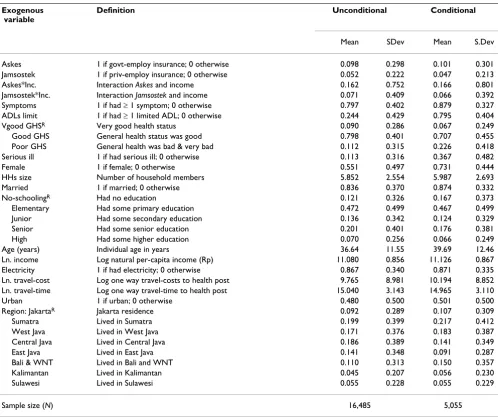
Table 1 provides a complete list of the variables used, with their definitions and descriptive statistics. The exogenous variables (xi) that were used in the analysis are detailed below.
Health Insurance
Health insurance is expected to improve demand for healthcare. Two types of health insurance programs were included in the model: (i) health insurance for govern-ment employees, known as Asuransi Kesehatan (Askes) and (ii) health insurance for private sector employees, known as Jaminan Sosial Tenaga Kerja (Jamsostek). The
Askes represents a mandatory insurance that covers all civil
servants, pensioners of civil servants and armed forces. It also covers their families and survivors. The scheme pro-vides the benefit of comprehensive health care, provided mainly through public health facilities. The Jamsostek scheme covers private employees and their dependents up to a maximum of three children. Benefits include compre-hensive health services through both public and private providers [16].
Table 1: Definition variables used in the analysis
Exogenous variable
Definition Unconditional Conditional
Mean SDev Mean S.Dev
Askes 1 if govt-employ insurance; 0 otherwise 0.098 0.298 0.101 0.301
Jamsostek 1 if priv-employ insurance; 0 otherwise 0.052 0.222 0.047 0.213
Askes*Inc. Interaction Askes and income 0.162 0.752 0.166 0.801
Jamsostek*Inc. Interaction Jamsostek and income 0.071 0.409 0.066 0.392
Symptoms 1 if had ≥ 1 symptom; 0 otherwise 0.797 0.402 0.879 0.327
ADLs limit 1 if had ≥ 1 limited ADL; 0 otherwise 0.244 0.429 0.795 0.404
Vgood GHSR Very good health status 0.090 0.286 0.067 0.249
Good GHS General health status was good 0.798 0.401 0.707 0.455
Poor GHS General health was bad & very bad 0.112 0.315 0.226 0.418
Serious ill 1 if had serious ill; 0 otherwise 0.113 0.316 0.367 0.482
Female 1 if female; 0 otherwise 0.551 0.497 0.731 0.444
HHs size Number of household members 5.852 2.554 5.987 2.693
Married 1 if married; 0 otherwise 0.836 0.370 0.874 0.332
No-schoolingR Had no education 0.121 0.326 0.167 0.373
Elementary Had some primary education 0.472 0.499 0.467 0.499
Junior Had some secondary education 0.136 0.342 0.124 0.329
Senior Had some senior education 0.201 0.401 0.176 0.381
High Had some higher education 0.070 0.256 0.066 0.249
Age (years) Individual age in years 36.64 11.55 39.69 12.46
Ln. income Log natural per-capita income (Rp) 11.080 0.856 11.126 0.867
Electricity 1 if had electricity; 0 otherwise 0.867 0.340 0.871 0.335
Ln. travel-cost Log one way travel-costs to health post 9.765 8.981 10.194 8.852
Ln. travel-time Log one way travel-time to health post 15.040 3.143 14.965 3.110
Urban 1 if urban; 0 otherwise 0.480 0.500 0.501 0.500
Region: JakartaR Jakarta residence 0.092 0.289 0.107 0.309
Sumatra Lived in Sumatra 0.199 0.399 0.217 0.412
West Java Lived in West Java 0.171 0.376 0.183 0.387
Central Java Lived in Central Java 0.186 0.389 0.141 0.349
East Java Lived in East Java 0.141 0.348 0.091 0.287
Bali & WNT Lived in Bali and WNT 0.110 0.313 0.150 0.357
Kalimantan Lived in Kalimantan 0.045 0.207 0.056 0.230
Sulawesi Lived in Sulawesi 0.055 0.228 0.055 0.229
Sample size (N) 16,485 5,055
Health insurance programs in this study are assumed to be exogenous given that such programs are mandated either by the government or employers, and hence unobservable individual factors to join particular health insurance scheme are not likely to be a serious problem. If insurance is indeed endogenous, then evaluating the impact of insurance on healthcare demand without correcting for endogeneity will yield biased estimates [17-19]. To guar-antee that health insurance is indeed exogenous, I tested for the possible endogeneity of insurance using the fol-lowing two steps [17]. First, a reduced form of insurance participation was estimated using a probit model (a first-stage regression). This regression included all covariates in the demand equation in addition to proposed identifying variables. Second, the predicted values of the insurance variable derived from the first-stage regression and the observed values of the insurance variable were then included in the demand equation. If the predicted coeffi-cient for insurance is not significant, then one can assume that health insurance is an exogenous variable. Testing for endogeneity was also performed using an instrumental variable (IV) estimation [20].
Health
Three measures of individual health status were taken into account: symptoms, activity of daily living (ADL) impair-ment, and general assessment of health status (GHS). Individuals who reported having at least one symptom and one difficulty of ADL impairment were grouped as having symptoms and ADL impairment, respectively. GHS respondents were reclassified into three groups: very good, good and poor (aggregated from very bad and bad of the GHS). A dummy variable indicating whether an individual had a serious illness in the last four years was also included. The severity of the disease was self-reported.
Since the study used a sample that was conditional on being ill, health status was also potentially endogenous due to a sample selection problem [5,6]. A probit model with the sample selection was carried out to investigate whether conditional estimates are affected by selection bias [21,22].
Income
Income is considered an important determinant of the demand for healthcare. This study used household expenditure as a proxy for income. Information about income is biased and difficult to assess in many develop-ing countries, particularly in subsistence farmdevelop-ing house-holds. Income data is also typically prone to under-reporting and measurement error, ignoring the contribu-tion of own produccontribu-tion and in-kind transfers. Household expenditures were adjusted with the 1997 consumer price index data, using Jakarta as a reference in order to correct
for price differences in various locations. To control the effect of household size, per-capita household tures were used. For the remainder of the paper, expendi-tures are referred to as income.
The effects of insurance may differ across income groups. An interaction term for insurance and income was there-fore included in the model. This interaction allows one to test whether income has different effects of insurance on the demand.
Other variables that were considered and included are: female (1/0), household size, married (1/0), education (a dummy variable indicating: no school [the reference] ele-mentary, junior, senior and high), electricity (1/0), age (years), one way travel cost (Rupiah) and travel time (minutes) to health facilities, and urban (1/0). To control for regional differences, dummy variables for the regional location of the survey site were also included.
Results
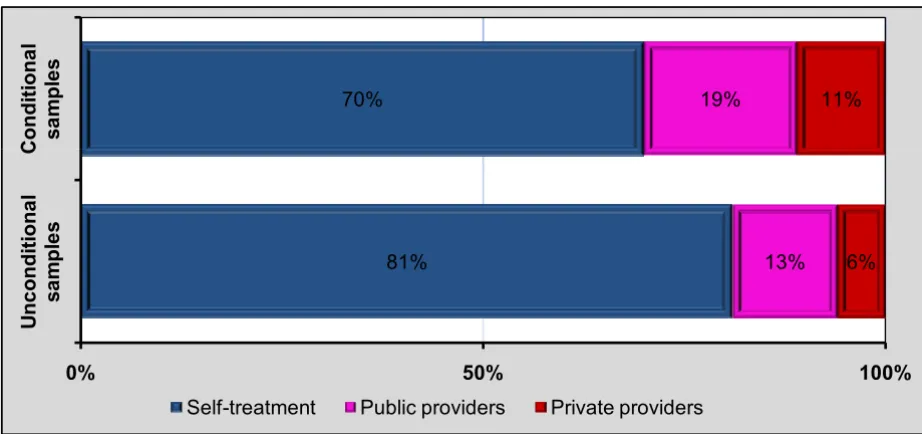
Figure 1 shows that 70% of ill individuals used self-treat-ment, 19% saw a private provider and the remaining 11% sought a public provider. The distribution of uncondi-tional samples was 81%, 13%, and 6% for self-treatment, private and public provider, respectively.
Testing the Endogeneity of Insurance
Results of the endogeneity test suggest that having health insurance is indeed an exogenous variable (i.e., the pre-dicted value of the insurance variable when inserted in the demand equation is not significantly different from zero). The predicted value of insurance was generated from a probit model of insurance participation. This was esti-mated separately for Askes and Jamsostek, using identifying variables and all other exogenous variables in the MNL model. The identifying variables used included: employ-ment status of the household head (whether public or pri-vate employee); whether individual were active in community meetings or water organizations, and; whether an individual's relationship to the household head is as a spouse. These variables were selected as appro-priate instruments since they turned out to be insignifi-cant in the demand equation, but were highly correlated with insurance participation. R2 for the insurance
equa-tion (first-stage regression) in the uncondiequa-tional estimate was 0.31 and 0.21 for Askes and Jamsostek, respectively. While for conditional estimate, it was 0.26 and 0.31 for
Askes and Jamsostek, respectively.
esti-mates, the p-values of the Sargan-test for the public and private models were 0.36 and 0.11, respectively. Whilst in conditional estimates, the p-values were 0.513 and 0.363 for the public and private models, respectively. This sug-gests that the models are reasonably well specified and the instruments are valid.
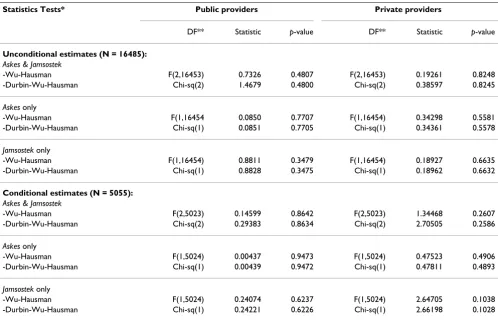
Using the IV estimation, the endogeneity test also failed to reject the null hypothesis. Table 2 reports summary statis-tics for testing the endogeneity of health insurance derived from the IV estimation. The test for both Askes and
Jam-sostek in all cases was not significantly different from zero,
indicating that the suspected endogenous variable is indeed exogenous, and no corrections for endogeneity are needed.
Sample Selection Model
As noted earlier, conditional estimates are likely to be biased. A probit model with a sample selection was employed using the 'heckprob' command in STATA [15]. Determinants of sickness included all covariates that were used in the demand equation plus several other indentify-ing variables. The instruments used included: smokindentify-ing status; household head's employment status (whether public or private employee); whether individuals used a septic tank for defecation; whether individual were involved in community activities, and; four dummy vari-ables indicating type of garbage disposal (e.g. collected, burned, discarded on premises, and other). The results of
the probit model with a sample selection yielded an insig-nificant correlation between the error terms – i.e., Chi-squared(1) = 0.02, with a p-value 0.88 – ruling out any possibility of sample selection bias [22].
Model Estimation Results
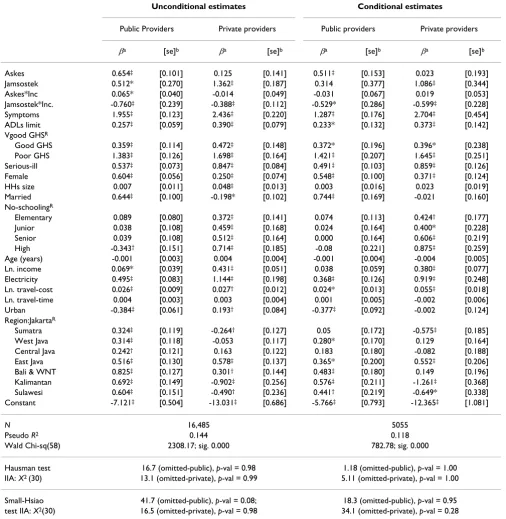
Table 3 displays the results of unconditional (left panel) and conditional (right panel) demand estimates. The last row of the table reports R-squared values as well as the results of IIA assumption tests. The R-squared values sug-gest that the covariates explain 14% and 12% variation in the unconditional and conditional models, respectively. Both Hausman and Small-Hsiao tests indicated that the MNL model passed the IIA assumption, suggesting that retaining the present model does not lead to inconsistent estimates [13].
The MNL estimates show that the coefficient estimate for
Askes insurance was positive for public and private
provid-ers, but only significant for the former with a p-value at the 1% level. The findings hold true for both unconditional and conditional estimates. The coefficient estimate of the interaction between Askes and income resulted only in a positive and significant effect for public services providers for the unconditional sample. The effect was negative for the conditional sample but not statistically significant.
The coefficient estimate of Jamsostek insurance in the unconditional estimates was positive for both provider The distribution of providers used four-weeks prior to the IFLS survey
Figure 1
The distribution of providers used four-weeks prior to the IFLS survey.
70% 19% 11%
C
ondi
ti
ona
l
sa
mp
le
s
81% 13% 6%
0% 50% 100%
U
n
c
ondi
ti
ona
l
sa
mp
le
s
C
S lf t t t P bli id P i t id
types, although there was a difference in the level of signif-icance (i.e., 10% at public providers and 1% at private ones). While in the conditional estimates, the coefficient
of Jamsostek was significant for the private provider only.
The coefficient estimate of the interaction (between
Jam-sostek and income) was negative for both provider types
and significant at the 1% levels, except for public provider in the conditional estimates. The negative coefficients of the interaction terms taken together suggest that the effects of Jamsostek insurance on the probability of using formal health care were higher among the poor.
Results of most covariates were consistent with expecta-tions. A general picture emerges that both unconditional and conditional estimates yielded similar results with respect to the direction of most covariates. This includes health status, gender, household size, marital status, edu-cation, income, electricity usage and travel costs.
Recycling Prediction Results
This section presents the results of the recycling prediction method to ascertain the pure effects of insurance and to show the magnitude effects implied by the coefficients.
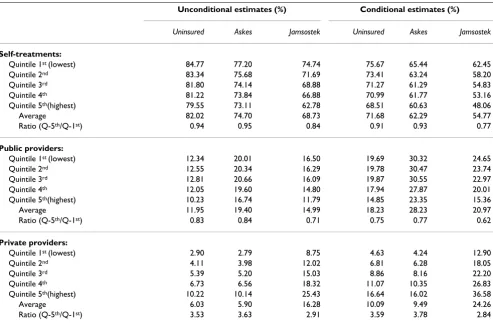
Based upon unconditional and conditional MNL estima-tions, I predicted the probabilities of using outpatient care (self-treatment, care with public providers and care with private providers) by changing only the health insurance status while holding all other variables at their mean. Three scenarios were used to change the value of health insurance status: (i) assigning all individuals in the sam-ple as 'uninsured,' (ii) expansion of Askes insurance to all individuals in the sample, and (iii) expansion of Jamsostek to all individuals in the sample. For each scenario, a pre-diction was then made for each income level. The con-stant differences in the probabilities predicted under these scenarios (uninsured, Askes, and Jamsostek), therefore, are exclusively owing to the effects of insurance. Table 4 sum-marizes the results of the predictions.
The first panel of Table 4 shows that about 72% of the uninsured who reported being ill opted, on average, for self-treatments compared with 62% for Askes beneficiaries and only 55% for Jamsostek members, suggesting that uninsured persons have the highest probability of using self-treatment. Individuals covered by Askes significantly demonstrated the highest probability of choosing public Table 2: Summary statistics testing for the endogeneity of the health insurance variable
Statistics Tests* Public providers Private providers
DF** Statistic p-value DF** Statistic p-value
Unconditional estimates (N = 16485):
Askes & Jamsostek
-Wu-Hausman F(2,16453) 0.7326 0.4807 F(2,16453) 0.19261 0.8248
-Durbin-Wu-Hausman Chi-sq(2) 1.4679 0.4800 Chi-sq(2) 0.38597 0.8245
Askes only
-Wu-Hausman F(1,16454 0.0850 0.7707 F(1,16454) 0.34298 0.5581
-Durbin-Wu-Hausman Chi-sq(1) 0.0851 0.7705 Chi-sq(1) 0.34361 0.5578
Jamsostek only
-Wu-Hausman F(1,16454) 0.8811 0.3479 F(1,16454) 0.18927 0.6635
-Durbin-Wu-Hausman Chi-sq(1) 0.8828 0.3475 Chi-sq(1) 0.18962 0.6632
Conditional estimates (N = 5055):
Askes & Jamsostek
-Wu-Hausman F(2,5023) 0.14599 0.8642 F(2,5023) 1.34468 0.2607
-Durbin-Wu-Hausman Chi-sq(2) 0.29383 0.8634 Chi-sq(2) 2.70505 0.2586
Askes only
-Wu-Hausman F(1,5024) 0.00437 0.9473 F(1,5024) 0.47523 0.4906
-Durbin-Wu-Hausman Chi-sq(1) 0.00439 0.9472 Chi-sq(1) 0.47811 0.4893
Jamsostek only
-Wu-Hausman F(1,5024) 0.24074 0.6237 F(1,5024) 2.64705 0.1038
-Durbin-Wu-Hausman Chi-sq(1) 0.24221 0.6226 Chi-sq(1) 2.66198 0.1028
providers, consistent across all income quintiles (second panel). Evidence from the conditional estimates indicates that beneficiaries of Askes had, on average, a 55% higher probability (increasing from 18.2% to 28.2%) to use
pub-lic providers than the uninsured. Jamsostek beneficiaries also had a 25% higher predicted probability to use outpa-tient care in public providers compared to the uninsured. Table 3: MNL estimation results using self-treatment as the comparison group
Unconditional estimates Conditional estimates
Public Providers Private providers Public providers Private providers
βa [se]b βa [se]b βa [se]b βa [se]b
Askes 0.654‡ [0.101] 0.125 [0.141] 0.511‡ [0.153] 0.023 [0.193]
Jamsostek 0.512* [0.270] 1.362‡ [0.187] 0.314 [0.377] 1.086‡ [0.344]
Askes*Inc 0.065* [0.040] -0.014 [0.049] -0.031 [0.067] 0.019 [0.053]
Jamsostek*Inc. -0.760‡ [0.239] -0.388‡ [0.112] -0.529* [0.286] -0.599‡ [0.228]
Symptoms 1.955‡ [0.123] 2.436‡ [0.220] 1.287‡ [0.176] 2.704‡ [0.454]
ADLs limit 0.257‡ [0.059] 0.390‡ [0.079] 0.233* [0.132] 0.373‡ [0.142]
Vgood GHSR
Good GHS 0.359‡ [0.114] 0.472‡ [0.148] 0.372* [0.196] 0.396* [0.238]
Poor GHS 1.383‡ [0.126] 1.698‡ [0.164] 1.421‡ [0.207] 1.645‡ [0.251]
Serious-ill 0.537‡ [0.073] 0.847‡ [0.084] 0.491‡ [0.103] 0.859‡ [0.126]
Female 0.604‡ [0.056] 0.250‡ [0.074] 0.548‡ [0.100] 0.371‡ [0.124]
HHs size 0.007 [0.011] 0.048‡ [0.013] 0.003 [0.016] 0.023 [0.019]
Married 0.644‡ [0.100] -0.198* [0.102] 0.744‡ [0.169] -0.021 [0.160]
No-schoolingR
Elementary 0.089 [0.080] 0.372‡ [0.141] 0.074 [0.113] 0.424† [0.177]
Junior 0.038 [0.108] 0.459‡ [0.168] 0.024 [0.164] 0.400* [0.228]
Senior 0.039 [0.108] 0.512‡ [0.164] 0.000 [0.164] 0.606‡ [0.219]
High -0.343† [0.151] 0.714‡ [0.185] -0.08 [0.221] 0.875‡ [0.259]
Age (years) -0.001 [0.003] 0.004 [0.004] -0.001 [0.004] -0.004 [0.005]
Ln. income 0.069* [0.039] 0.431‡ [0.051] 0.038 [0.059] 0.380‡ [0.077]
Electricity 0.495‡ [0.083] 1.144‡ [0.198] 0.368‡ [0.126] 0.919‡ [0.248]
Ln. travel-cost 0.026‡ [0.009] 0.027† [0.012] 0.024* [0.013] 0.055‡ [0.018]
Ln. travel-time 0.004 [0.003] 0.003 [0.004] 0.001 [0.005] -0.002 [0.006]
Urban -0.384‡ [0.061] 0.193† [0.084] -0.377‡ [0.092] -0.002 [0.124]
Region:JakartaR
Sumatra 0.324‡ [0.119] -0.264† [0.127] 0.05 [0.172] -0.575‡ [0.185]
West Java 0.314‡ [0.118] -0.053 [0.117] 0.280* [0.170] 0.129 [0.164]
Central Java 0.242† [0.121] 0.163 [0.122] 0.183 [0.180] -0.082 [0.188]
East Java 0.516‡ [0.130] 0.578‡ [0.137] 0.365* [0.200] 0.552‡ [0.206]
Bali & WNT 0.825‡ [0.127] 0.301† [0.144] 0.483‡ [0.180] 0.149 [0.196]
Kalimantan 0.692‡ [0.149] -0.902‡ [0.256] 0.576‡ [0.211] -1.261‡ [0.368]
Sulawesi 0.604‡ [0.151] -0.490† [0.236] 0.441† [0.219] -0.649* [0.338]
Constant -7.121‡ [0.504] -13.031‡ [0.686] -5.766‡ [0.793] -12.365‡ [1.081]
N 16,485 5055
Pseudo R2 0.144 0.118
Wald Chi-sq(58) 2308.17; sig. 0.000 782.78; sig. 0.000
Hausman test 16.7 (omitted-public), p-val = 0.98 1.18 (omitted-public), p-val = 1.00
IIA: X2 (30) 13.1 (omitted-private), p-val = 0.99 5.11 (omitted-private), p-val = 1.00
Small-Hsiao 41.7 (omitted-public), p-val = 0.08; 18.3 (omitted-public), p-val = 0.95
test IIA: X2(30) 16.5 (omitted-private), p-val = 0.98 34.1 (omitted-private), p-val = 0.28
aThe estimated parameters β; superscript ‡,†, and *significance at 1%, 5%, and 10% level, respectively. bRobust standard errors given in [brackets].
Table 4 also shows that the gap between the lowest- and highest-income quintiles of uninsured healthcare users was wider in private providers than public ones. The ratio of the highest to the lowest-income quintile among the uninsured, derived from a conditional estimation, was 0.75 (14.85/19.69) for public providers and 3.59 for pri-vate ones. The gap between the lowest and highest-income quintiles in private outpatient use among
Jam-sostek member was the smallest (2.9 and 2.8 de rived from
unconditional and conditional estimates, respectively). It is also worth noting that the highest income bracket of uninsured people had the lowest probability of choosing self-treatment and the highest probability of using private providers.
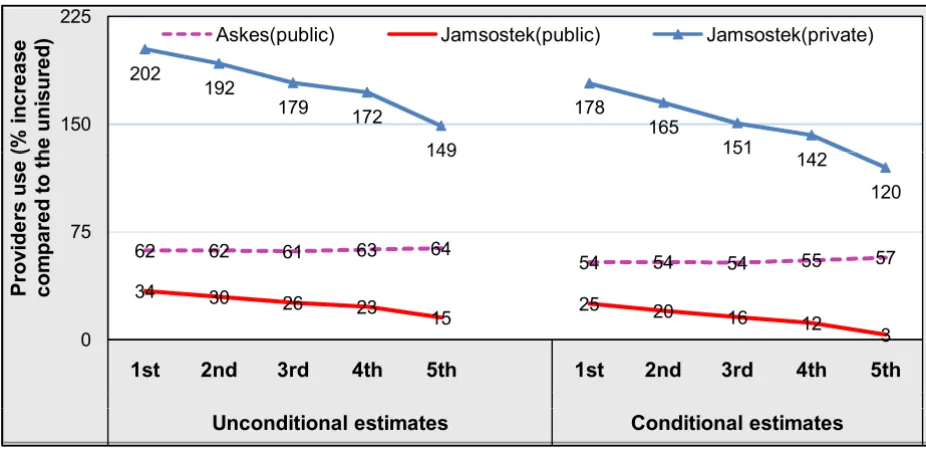
Figure 2 depicts the effects of health insurance programs on the demand for public and private outpatient care. The greatest effect of Jamsostek insurance on both public and private outpatient use was found in the lowest income quintile. The effect declines as the quintile level increases. This pattern corresponds with the estimated coefficient of the interaction term between Jamsostek and income, which is always negative (see Table 3).
Discussion
Estimating healthcare demand conditional on an event of illness poses a problem due to possibility endogeneity of self-reported illnesses resulting from sample selection bias [5,6,21]. Sample selection bias refers to the problem where the dependent variable is only observed for a restricted (non-random) sample. This study, however, confirms that conditional estimates do not suffer from the sample selectivity problem, in-line with a study con-ducted in Côte d'Ivoire [6]. Another problem with condi-tional estimates relates to the underreporting of incidents of illness in surveys [7]. However, this study minimizes the risk of underreporting by adopting two health status measurements (i.e., activity of daily living impairments and the incidence of severe illness) to capture the event of illness.
This study found that both unconditional and conditional estimates yielded similar results, especially in term of the sign of the variable of interest as well as most of the other covariates. However, the results suggest that conditional estimates yield a lower insurance effect on the utilization of outpatient care than unconditional ones. The effects of
Askes on the use of public outpatient care were about 7.5
percent lower in the conditional estimates (55%) than in Table 4: Predicted probabilities of provider usage under different insurance schemes and income quintiles
Unconditional estimates (%) Conditional estimates (%)
Uninsured Askes Jamsostek Uninsured Askes Jamsostek
Self-treatments:
Quintile 1st (lowest) 84.77 77.20 74.74 75.67 65.44 62.45
Quintile 2nd 83.34 75.68 71.69 73.41 63.24 58.20
Quintile 3rd 81.80 74.14 68.88 71.27 61.29 54.83
Quintile 4th 81.22 73.84 66.88 70.99 61.77 53.16
Quintile 5th(highest) 79.55 73.11 62.78 68.51 60.63 48.06
Average 82.02 74.70 68.73 71.68 62.29 54.77
Ratio (Q-5th/Q-1st) 0.94 0.95 0.84 0.91 0.93 0.77
Public providers:
Quintile 1st (lowest) 12.34 20.01 16.50 19.69 30.32 24.65
Quintile 2nd 12.55 20.34 16.29 19.78 30.47 23.74
Quintile 3rd 12.81 20.66 16.09 19.87 30.55 22.97
Quintile 4th 12.05 19.60 14.80 17.94 27.87 20.01
Quintile 5th(highest) 10.23 16.74 11.79 14.85 23.35 15.36
Average 11.95 19.40 14.99 18.23 28.23 20.97
Ratio (Q-5th/Q-1st) 0.83 0.84 0.71 0.75 0.77 0.62
Private providers:
Quintile 1st (lowest) 2.90 2.79 8.75 4.63 4.24 12.90
Quintile 2nd 4.11 3.98 12.02 6.81 6.28 18.05
Quintile 3rd 5.39 5.20 15.03 8.86 8.16 22.20
Quintile 4th 6.73 6.56 18.32 11.07 10.35 26.83
Quintile 5th(highest) 10.22 10.14 25.43 16.64 16.02 36.58
Average 6.03 5.90 16.28 10.09 9.49 24.26
the unconditional ones (62%). The demand effects of
Jamsostek for outpatient care with private providers were
about 20 percent lower in the conditional estimates than in the unconditional ones (156% and 176%, respec-tively). This is inconsistent with the finding of a previous study. Dow found that conditional estimates yielded price elasticity about 25% higher than those derived from unconditional estimates [6]. Unconditional estimates are preferred since conditional estimates may be statistically biased. Even when properly estimated, such estimates can only be interpreted as short-run effects.
A critical question is when should we use unconditional estimates and when should we rely on conditional esti-mates? The answer depends on the purpose of the research. When the research aims to measure long-run price effects, unconditional estimates are the desired option. However, if the research is designed, for instance, to measure equity in healthcare utilization, conditional estimates are preferable [4,23]. Because conditional esti-mations do not suffer from statistical selection bias, they are acceptable for short-term analysis, and may even be preferable since they are less costly to implement. For instance, questionnaires need only be administered to those who are sick. Conditional surveys are worthwhile, especially in developing countries like in Indonesia, since
research resources (i.e., time, money, manpower, etc.) are usually inadequate.
This study also investigated the effects of health insurance on healthcare demand. The findings show that health insurance has a strongly positive impact on the demand for outpatient care in Indonesia. This supports theories of health insurance [24], and concurs with previously pub-lished studies conducted in other contexts [17-19,25,26].
The findings reveal problems for the uninsured and their predicted probability of using outpatient care with private providers, particularly those in the lowest income quin-tile. Examining the ratio of healthcare use among the highest to lowest-income quintiles among uninsured peo-ple, we see that the lowest income groups are less likely to use private outpatient services. This is due to increasingly expensive private health facilities. The poor are therefore more likely to opt for cheaper treatments for their illness, such as using outpatient public facility or self-treatment (i.e., buying drug from a pharmacy or simply not seeking care at all). The implication for equitable outcomes in this situation gives cause for concern.
However, once people are covered by insurance, particu-larly those in the lowest income groups, they utilize sub-The effects of health insurance on the use of public and private providers
Figure 2
The effects of health insurance on the use of public and private providers. (Dash purple-line indicates the effects of Askes on the demand public outpatient care. Red-line and blue-line with triangle marker point to the effects of Jamsostek on the demand public and private outpatient care, respectively. In all lines, the value of the percentage (%) reveals the magnitude effects of health insurance on healthcare demand as compared to the uninsured).
202
192
179 172
149
178
165
151 150
225
(%
in
cr
eas
e
h
e
uni
s
ure
d) Askes(public) Jamsostek(public) Jamsostek(private)
62 62 61 63 64
54 54 54 55 57
34 30
26 23
15 25 20 16 12
3
149 151
142
120
0 75
1st 2nd 3rd 4th 5th 1st 2nd 3rd 4th 5th
Pro
v
id
ers
u
s
e
(
co
m
p
ar
ed
t
o
t
h
stantially more health services. This study demonstrated an over-proportional demand effect of insurance with the effects more pronounced in the lowest income groups. These findings implicitly indicate that low-income people have a higher price elasticity of demand, a finding that is consistent with empirical evidence elsewhere [1,19,25,26]. A study done by Pradhan et al. (2007) also found that the effect of the targeted price subsidy offered through the health card program was largest for the poor-est quintile [27]. From a public health perspective, these findings are of substantial interest. It suggests that expand-ing health insurance in Indonesia, as is the current policy thrust, will have a stronger impact on increasing formal care usage rates among the poor. The introduction of a demand-side subsidy to insure the 76.4 million poor in Indonesia is supported by the findings of this study.
Research findings also indicate that among uninsured people the poorest have a higher probability of using pub-lic providers than the richest quintile. Arguably, this is particularly the case with regards to the extensive subsidi-zation of medical care costs by the government that keep user costs in public health facilities generally low. Mean spending on outpatient medical care was only 1.5% and 4.8% of total income for public and private health facili-ties, respectively. Therefore, poorest uninsured people who devoted on average about 4% of their income on healthcare are still able to afford healthcare. A study con-ducted in Indonesia also found that the share of house-hold expenditures spent on health in 1997 was only 1.9% for urban areas and 1.6% for rural areas [10].
Conclusion
This study estimates the effects of health insurance on healthcare demand in Indonesia using samples that are both unconditional and conditional on being ill. The lat-ter approach does not suffer from the sample selectivity problem. Both estimations yield very similar outputs with respect to the direction of most of the covariates. The mag-nitude effects of insurance on demand for healthcare, however, are higher in the former estimates than the lat-ter. The choice between using unconditional or condi-tional estimates for future studies should be determined by the main purpose of the research.
This study supports growing literature that health care demand is regressive irrespective of insurance status. Health insurance significantly improves access to health care services, with the largest demand effect of insurance found among individuals in the lowest income quintile. This study therefore supports the expansion of insurance programs or the establishment of a national health insur-ance program in order to address under-utilization of for-mal healthcare in Indonesia. A demand-side subsidy to
pay insurance premiums for the poor is also recom-mended.
Competing interests
The author declares that they have no competing interests.
Authors' contributions
The author is fully responsible for all parts of the study. The author has made contributions to conception, design, managing data, running model and interpretation of results; has drafted the manuscript and has revised it crit-ically for important intellectual content; and has approved the final version to be published.
Acknowledgements
The author is grateful to the RAND Corporation for providing the data. All views expressed and errors encountered in this article are those of the author and not of the RAND Corporation. The author would like to thank the reviewers for comments on earlier draft of the paper and provided val-uable inputs. The author is thankful to Edgar Janz for editorial support.
References
1. Sauerborn R, Nougtara A, Latimer E: The elasticity of demand for health care in Burkina Faso: differences across age and income groups. Health Policy and Planning 1994, 9:185-192. 2. Fabricant SJ, Kamara CW, Mills A: Why the poor pay more:
household curative expenditures in rural Sierra Leone. Inter-national Journal of Health Planning and Management 1999, 14:179-199. 3. Baltussen RMP, Yé Y, Haddad S, Sauerborn R: Perceived quality of care of primary health care services in Burkina Faso. Health Policy and Planning 2002, 17:42-48.
4. Hidayat B, Thabrany H, Dong H, Sauerborn R: The effects of man-datory health insurance on equity in access to outpatient care in Indonesia. Health Policy and Planning 2004, 19:322-335. 5. Akin JS, Guilkey DK, Hutchinson P, McIntosh : Price elasticity of
demand for curatives health care with control for sample selectivity on endogenous illness: An analysis for Sri Lanka.
Health Economics 1998, 7:509-531.
6. Dow WH: Unconditional demand for health care in Cote
d'Ivoire: does selection on health status matter? In LSMS Working Paper No. 127 Washington DC: The World Bank; 1996. 7. Sauerborn R, Nougtara A, Hien M, Diesfeld HJ: Seasonal variations
of household costs of illness in Burkina Faso. Social Science and Medicine 1996, 43:281-290.
8. Hidayat B: Modelling the effects of health insurance on health-care demand in Indonesia. In PhD thesis Ruprecht-Karls-Univer-sity of Heidelberg, Department of Public Health and Tropical Medicine; 2004.
9. United Nation Statistics Division: Demographic, social and hous-ing statistics. 2007.
10. Waters H, Saadah F, Pradhan M: The impact of the 1997–98 East Asian economic crisis in health and health care in Indonesia.
Health Policy and Planning 2003, 18:172-181.
11. Frankenberg E, Karoly L: The 1993 Indonesian Family Life Sur-vey: overview and field report. RAND Corporation, USA; 1995. 12. Frankenberg E, Thomas D: The Indonesia Family Life Survey (IFLS): Study design and results from waves 1 and 2. RAND Corporation, USA; 2000.
13. Greene W: Econometric analysis 3rd edition. Prentice-Hall: Englewood Cliffs NJ; 1997.
14. Yip W, Wang H, Liu Y: Determinants of patient choice of med-ical provider: a case study in rural China. Health Policy and Plan-ning 1998, 13:311-322.
15. Stata Corporation: Stata statistical software Release 7.0 Texas: College Station; 2001.
16. Thabrany H, Pujianto : Health Insurance and access to health care. The Journal of the Indonesian Medical Association 2000,
Publish with BioMed Central and every scientist can read your work free of charge
"BioMed Central will be the most significant development for disseminating the results of biomedical researc h in our lifetime."
Sir Paul Nurse, Cancer Research UK
Your research papers will be:
available free of charge to the entire biomedical community
peer reviewed and published immediately upon acceptance
cited in PubMed and archived on PubMed Central
yours — you keep the copyright
Submit your manuscript here:
http://www.biomedcentral.com/info/publishing_adv.asp
BioMedcentral
17. Waters HR: Measuring the impact of health insurance with correction for selection bias: a case study of Ecuador. Health Economics 1999, 8:473-483.
18. Schllhron M: The effect of variable health insurance deducti-bles on the demand for physician visits. Health Economics 2001,
10:441-456.
19. Trujillo AJ: Medical care use and selection in a social health insurance with an equalization fund: evidence from Colom-bia. Health Econ 2002, 12(3):231-246.
20. Baum CF, Schaffer ME, Stillman S: Instrumental variables and GMM: estimation and testing. Stata Journal 2003, 3:1-31. 21. Heckman J: Sample selection bias as a specification error.
Econometrica 1979, 47:153-161.
22. Ven W van de, van Pragg B: The demand for deductibles in pri-vate health insurance: a probit model with sample selection.
Journal of Econometrics 1981, 17:229-252.
23. Waters HR: Measuring equity in access to health care. Social Science and Medicine 2000, 51:599-612.
24. Feldstein PJ: Health care economics 4th edition. New York Albany; 1993.
25. Yip W, Berman P: Targeted health insurance in a low income country and its impact on access and equity in access: Egypt's school health insurance. Health Economics 2001, 10:207-220. 26. Jowett M, Deolalikar A, Martinsson P: Health insurance and
treat-ment seeking behaviour: evidence from a low-income coun-try. Health Economics 2004, 13:845-857.
27. Pradhan M, Saadah F, Sparrow R: Did the health card program ensure access to medical care for the poor during Indone-sia's economic crisis? World Bank Economic Review 2007,