Pathway-phenotypes of non-responders and partial responders to treatment with antipsychotics in schizophrenia: a machine learning study.
Hussein Kadhem Al-Hakeim, a Rana Fadhil Mousa, b Arafat Hussein Al-Dujaili, c Michael Maes
d,e,f.
a Department of Chemistry, College of Science, University of Kufa, Iraq. E-mail:
b Faculty of Veterinary Medicine, University of Kerbala, Iraq. E-mail: [email protected] c Senior Clinical Psychiatrist at the Faculty of Medicine, University of Kufa, Iraq. E-mail:
d Corresponding Author: Department of Psychiatry, Faculty of Medicine, Chulalongkorn
University, Bangkok, Thailand.
e Department of Psychiatry, Medical University of Plovdiv, Plovdiv, Bulgaria.
f School of Medicine, IMPACT Strategic Research Centre, Deakin University, PO Box 281,
Geelong, VIC, 3220, Australia. E-mail: [email protected].
Corresponding author:
Prof. Dr. Michael Maes, M.D., Ph.D., Department of Psychiatry,
King Chulalongkorn Memorial Hospital, Faculty of Medicine,
E-mail:
Abstract
Objective: About a third of schizophrenia patients are treatment-resistant to antipsychotic therapy. No studies established the fingerprints or pathway-phenotypes of treatment-resistant schizophrenia. The present study aimed to delineate the pathway-phenotypes of non-responders (NRTT) and partial responders (PRTT) to treatment using machine learning.
Methods: We recruited 115 schizophrenia patients and 43 healthy controls and measured schizophrenia symptom dimensions, neurocognitive tests, plasma CCL11,interleukin-(IL)-6, IL-10, Dickkopf protein 1 (DKK1), high mobility group box-1 protein (HMGB1), κ- and µ-opioid receptors (KOR and MOR, respectively), endomorphin-2 (EM-2), and β-endorphin.
Results: Machine learning showed that the NRTT group is a qualitatively distinct class and is significantly discriminated from PRTT with an accuracy of 100% using a neuro-immune-opioid-cognitive (NIOC) pathway-phenotype with as main determinants list learning, controlled word association, and Tower of London test scores, CCL11, IL-6, and EM2. The top-5 symptom domains separating NRTT from PRTT were in descending order: psychomotor retardation, negative symptoms, psychosis, depression, and mannerism. Moreover, a NIOC pathway also discriminated PRTT from healthy controls with an accuracy of 100% while all PRTT and controls were authenticated as belonging to their respective classes.
Introduction
Schizophrenia is a severe psychiatric disorder that has major implications for the patients and family members as well (1). A substantial part of patients with schizophrenia fails to show an adequate response to treatment with antipsychotic drugs (2, 3). Treatment-resistant schizophrenia (TRS) may be defined as the persistence of schizophrenia symptoms after two trials with different antipsychotic medications of adequate dose and duration (3) (4). Nevertheless, there is a lack of consensus on how to delineate TRS and some case definitions are based on the severity of schizophrenia symptoms including hallucinations, conceptual disorganization, unusual thought content and suspiciousness (5). Other more clinically oriented case definitions proposed to use the Clinical Global Impression, Severity (GCI-S) (6) and the CGI-Change (CGI-I) to delineate TRS (5). However, such case definitions do not consider that also cognitive deficits, negative symptoms, affective and physiosomatic (that is chronic fatigue and fibromyalgia-like) symptoms are part of the phenome of schizophrenia (7, 8) and, therefore, maybe the phenome of TRS.
schizophrenia. Recently, we established that schizophrenia is also accompanied by increased levels of high mobility group box 1 (HMGB1) protein, a master pro-inflammatory damage-associated molecular pattern (DAMP) that is released by injured cells and stimulates the release of IL-6 and tumor necrosis factor (TNF)-α (13). Nevertheless, in schizophrenia, also the compensatory immune-regulatory system (CIRS) is activated in parallel with IRS activation, whereby the CIRS tends to downregulate a primary IRS (10, 14). CIRS activation in schizophrenia is indicated by increased levels of the interleukin-1 receptor antagonist (sIL-1RA), attenuating IL-1 signaling, soluble tumor necrosis factor (TNF) receptors (sTNF-R1) and (sTNF-R2), attenuating TNF-α signaling, and Th-2 and T regulatory (Treg) cytokines including IL-10, the major immune-regulatory cytokine (10, 15). Some of the IRS/CIRS biomarkers coupled with impairments in cognitive functions shaped a neuroimmune - brain circuit axis (NIBCA) pathway-phenotype (16). This NIBCA index comprised CCL2, CCL11, TNF-α, the soluble TNF receptors (sTNF-R)1, sTNF-R2, IL-1β, sIL-1RA, and neurocognitive deficits and explained up to 75.0% of the variance in PHEMN (psychotic, hostility, excitation, mannerism and negative) symptoms (16). As such, this NIBCA pathway-phenotype mediates the effects of genome X environmentome interactions on the late phenome of schizophrenia, namely symptomatology, and phenomenology (16).
antagonize the canonical Wnt signaling transduction pathway thereby interfering with tissue regeneration and repair (13).
Recently, it was found that the endogenous opioid system (EOS) contributes to schizophrenia symptomatology, neurocognitive impairments and a non-response to treatment (21). Thus, increased µ-opioid (MOR) and κ-opioid (KOR) receptor levels were observed in schizophrenia while levels of MOR, β-endorphin, and endomorphin 2 (EM2) were also significantly higher in TRS than in non-treatment resistant schizophrenia (21). These EOS peptides/receptors may exert CIRS functions, whereas increased KOR and EM2 levels may contribute to the pathophysiology of schizophrenia (21). We also reported that a large part of the variance in a latent vector extracted from PHEM, negative, affective and psychosomatic symptoms and cognitive deficits, which reflect overall severity of schizophrenia (OSOS), was explained by the combined effects of CCL11, HMGB1, DKK1, MOR and EM2 (21). Nevertheless, no research has delineated the symptom and neurocognitive fingerprints of TRS and the pathway-phenotype of TRS and a favorable response to treatment.
Subjects and methods Participants
This study included 115 patients with SCZ and 43 healthy controls of both genders and aged between 18 and 65 years old. Patients were recruited at the Psychiatry Unit at Imam Al-Hussain Medical City in Karbala Governorate, Iraq. They complied with the DSM-IV-TR diagnostic criteria of schizophrenia. The controls were family members or friends of staff or patients and they were recruited from the same catchment area as the patients (Karbala, Iraq).
Exclusion criteria for schizophrenia patients and healthy controls were: (a) medical disorders including psoriasis, diabetes type 1, inflammatory bowel disease, COPD, autoimmune disorders, and rheumatoid arthritis; (b) neuroinflammatory disorders including multiple sclerosis, stroke, Parkinson’s disease, and Alzheimer’s disease; (c) lifetime uses of immunomodulatory drugs including glucocorticoids and immunosuppressive; (d) use of omega-3 or antioxidant supplements in therapeutic doses three months before the study; and (e) pregnant and lactating women. Exclusion criteria for patients included: an axis-1 DSM-IV-TR diagnosis other than schizophrenia such as autism, bipolar disorder, major depression, psycho-organic disorders, and schizoaffective disorder. Controls were omitted from participation for a current and lifetime diagnosis of axis-I DSM-IV-TR diagnosis or when they showed a positive family history of psychosis. Moreover, serum concentrations of C-reactive protein (CRP) of patients and controls were < 6 mg/L excluding subjects with overt inflammation.
Health Department (1331/2019), which complies with the International Guidelines for Human Research protection as required by the Declaration of Helsinki, The Belmont Report, Council for International Organizations of Medical Sciences (CIOMS) Guideline and International Conference on Harmonization in Good Clinical Practice (ICH-GCP).
Measurements
Clinical assessments
mannerism (PHEM), PMR (psycho-motor retardation) and FTD (formal thought disorders) (11, 29). To assess the severity of physiosomatic symptoms we used the Fibromyalgia and Chronic Fatigue Syndrome Rating Scale (FF) (30). The Brief Assessment of Cognition in SCZ (BACS) (22) was assessed on the same day by a psychologist blinded to the clinical diagnosis. We assessed the List Learning test (episodic memory); the Digit Sequencing Task (working memory); Category Instances and Controlled Word Association (COWA) tests (semantic memory and verbal fluency); Symbol Coding (attention); and the Tower of London (executive functions). Finally, the diagnosis of Tobacco Use Disorder (TUD) was made using DSM-IV-TR criteria and body mass index (BMI) was assessed as body weight (kg) / length (m2).
Assays
Five mL of venous blood was sampled between 8.00 and 9.00 a.m. after an overnight fast in all patients and controls using disposable needles and plastic syringes. The blood tubes were transferred into a clean plain tube and blood was left at room temperature for clotting for 15 minutes. Subsequently, blood was centrifuged at 3000 rpm for 10 minutes and serum was separated and transported into two Eppendorf tubes to be stored at -80 °C until thawed for assay. CCL11, DKK1, HMGB1, and IL-10 were measured using Elabscience® (Inc. CA, USA), IL-6 and β-endorphin using the Melsin Medical Co (Jilin, China), MOR, KOR, and EM-2 using Mybiosource®
sensitivity of the assay (sensitivity=4.69 pg/mL). However, no left-censoring was applied, and we used the actual measured concentration in the statistical analyses. The intra-assay coefficients of variation (CV) were all < 10.0%. Serum CRP was assayed using a kit supplied by Spinreact®, Spain.
Statistical analysis
We used analysis of variance (ANOVA) to assess differences in continuous variables between categories and analysis of contingency tables (χ2-test) to check associations between
categorical variables. Univariate and multivariate general linear model (GLM) analysis was employed to assess the associations between diagnosis (NRTT versus PRTT, and PRTT versus controls) and the symptoms, cognitive function and biomarkers while controlling for background variables including age, sex, and education. Tests for between-subject effects were performed to check the associations between diagnosis and each of the symptoms, cognitive test results, and biomarkers and we computed effect sizes using partial eta-squared values. Model-generated estimated marginal mean (SE) values were computed. Variables were transformed into z scores and the latter were displayed in bar plots. Statistical tests were 2-tailed and a p-value of 0.05 was used for statistical significance. All statistical analyses were performed using IBM SPSS windows version 25, 2017.
Machine learning
Multilayer perceptron Neural Network (NN) models (IBM SPSS windows version 25, 2017), were used to delineate the more complex relationships between cognitive test results and biomarkers (entered as input variables) in predicting the diagnostic classes (e.g. NRTT versus PRTT). The models were trained using an automated feedforward architecture with two hidden layers with up to 8 nodes in each layer, employing minibatch training with gradient descent, 30-250 epochs and one consecutive step with no further decrease in the error term as stopping rule. We considered three samples, i.e., “a training sample to estimate the network parameters (46.67% of all participants), testing set to prevent overtraining (20.0%) and a holdout set to evaluate the final network (33.33%). Error, relative error, and importance and relative importance of all input variables were computed” (21).
Results.
Recruitment of NRTT and PRTT
less incisive antipsychotic) and during that period we lost 7 patients. Finally, we recruited 60 NRTT and 55 PRTT to participate in the present study. Consequently, we have examined the differences in symptoms and pathway-phenotypes between NRTT and PRTT and between PRTT and healthy controls. Table 1 shows the CGI values that were used to classify patients as NRTT and PRTT. Both CGI-I and CGI-S were significantly higher in NRTT versus PRTT.
Socio-demographic data
Table 1 shows the sociodemographic data of NRTT versus PRTT. We found no significant differences in age, sex ratio, marital status, BMI, TUD, residency, employment status, age at onset, and family history of psychosis between both groups. Years of education was marginally lower in NRTT than in PRTT. This table also shows the drugs that were used during the second trial. Thus, NRTT showed a higher frequency of treatments with clozapine, quetiapine, and risperidone than PRTT, who showed a higher ratio of treatment with haloperidol, and olanzapine. Since there are some differences in treatment between both study groups, we have examined the effects of the drug state of the patients on the results (see below).
Symptom differences between NRTT and PRTT
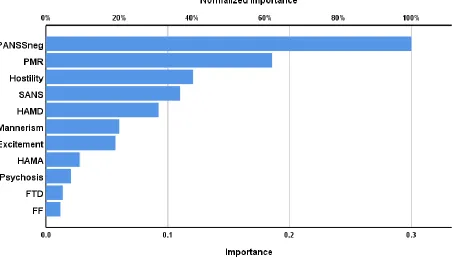
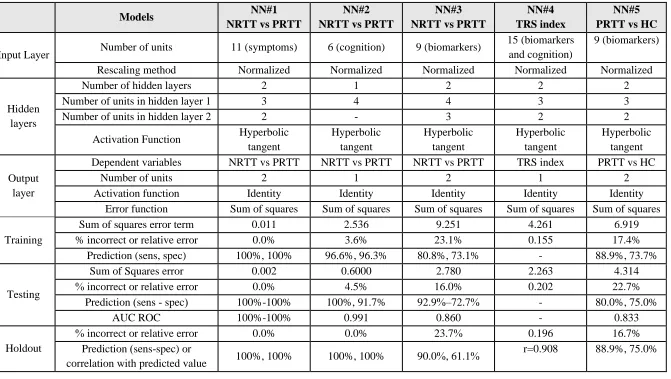
groups using neural networks with the NRTT and PRTT as output variables and the 11 symptoms as input variables. NRTT were significantly separated from PRTT using a NN model with 11 units, 2 hidden layers, with 3 units in hidden layer 1 and 2 in hidden layer 2. We used hyperbolic tangent as the activation function in the hidden layers and identity in the output layer. There were no incorrect classifications in the three sets. Figure 1 shows the importance chart and that the PANSS negative symptom subscale score, PMR, hostility and total SANS score were the most important predictors.
Cognitive phenotype differences between NRTT and PRTT
Biomarker differences between NRTT and PRTT
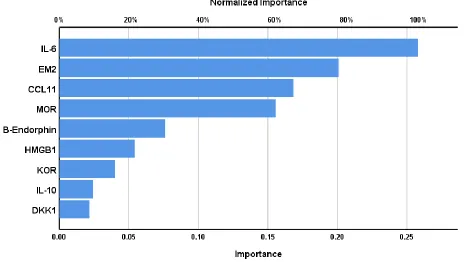
Table 1 shows that NRTT had significantly higher levels of IL-6, DKK1, β-endorphin, EM-2 and MOR as compared with PRTT. ESF, Figure 3 shows a bar plot with the mean (SE) biomarker z scores in both NRTT and PRTT displaying major differences, especially in IL-6 and MOR. Table 2 NN#3 shows the best neural network separating NRTT from PRTT using the 9 biomarkers. This network was trained with 2 hidden layers, with 4 units in layers 1 and 4 in layer 2. Hyperbolic tangent was the activation function in the hidden layers and identity in the output layer. The error term (sum of squares) was much lower in the testing set (2.780) than in the training set (9.251) and the percentage of incorrect classifications was somewhat lower, indicating that the model learned to generalize from the trend. Figure 3 shows the (relative) importance of the 9 biomarkers with IL-6 and MOR displaying the highest predictive power of the model, followed at a distance by CCL11 and EM-2 and again at a distance by β-endorphins.
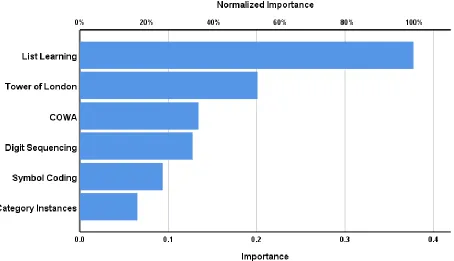
COWA, and Tower of London had the greatest predictive power of this model, followed at distance by CCL11, IL-6, EM-2 and Category Instances, and again at a distance by Digit Sequencing, Symbol Coding and MOR. The correlation between the actual values of this index and the predicted value was r=0.908.
Discrimination of NRTT and PRTT using the Unscrambler
Table 3 displays the results of SVM with ten-fold cross-validation and shows the training and testing accuracy. We found very accurate discrimination of NRTT and PRTT using the 11 symptom domains (validating accuracy 100%), 6 cognitive tests results and 11 symptom domains (validating accuracy: 100%), 6 cognitive tests (accuracy: 93.04%) and 6 cognitive tests and 9 biomarkers (accuracy: 94.78%).
Table 3 shows also the results of SIMCA analysis and that NRTT and PRTT were significantly discriminated from each other using the 11 symptom domains (model-to-model distance=50.0331), 6 cognitive test results and 11 symptom domains (21.2341), 6 cognitive tests (64.6991) and the cognitive tests and 9 biomarkers (9.4236). This table also lists the most important input variables. For example, the top 7 most important symptom domains discriminating NRTT from PRTT are in descending order of importance: total SANS score, HAM-D, FF, Excitation, HAM-A, mannerism, and PMR. When considering both the 6 cognitive tests and 11 symptom domains, the top-7 was: PMR, Tower of London, Psychosis, Category Instances, Symbol Coding, SANS, and HAM-D.
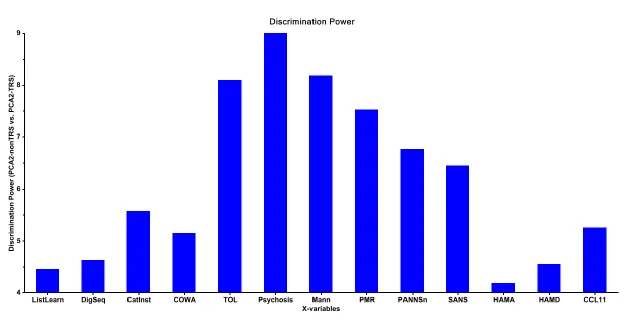
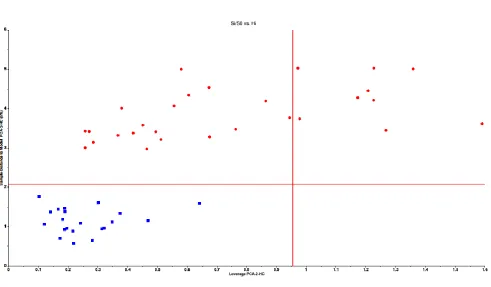
feature selection based on both the modeling and discriminatory power of the input variables in SIMCA. Two patients were statistical outliers, one in the NRTT and on in the PRTT group, and these two cases were omitted from further modeling. The class envelope of NRTT patients was modeled using 7 PCs and that of PRTT using 5 PCs. The model-to-model distance was highly significant, namely 37.2781. ESF, Figure 5 displays the NTRR group-membership (Si/So) plot. The latter displays the distance of each cross-validation case to the NTRR model on the y-axis and the distance of each case to the NRTT model center (leverage) on the x-axis. NRTT is represented as red circles and PRTT as blue squares. The lower left quadrant represents the group limits of the NRTT class model. This plot shows that all NRTT of the validation set is authenticated as belonging to the NRTT class model and that there were two aliens, namely two PRTT intruding in the NRTT class model. ESF, Figure 6 displays the PRTT group-membership (Si/So) plot. All PRTT except one was correctly authenticated, while two NTRR aliens were intruding into the PRTT group limits (aliens). Cross-validation showed an overall accuracy of 94.7%. Figure 4 shows the discrimination power of the input variables. The top-5 discriminatory variables were in descending order: psychosis, mannerism, Tower of London test scores, PMR, and PANSS negative score. Based on all different results of neural networks and SIMCA obtained in this study we ranked the symptom domains in order of importance discriminating NRTT from PRTT; the top-6 was in descending order of importance was: PMR, SANS, psychosis, PANSS negative score, HAM-D and mannerism. Likewise, we also ranked the neurocognitive test in descending order of importance: Tower of London, COWA, Category Instances, List learning, Digit Sequencing, and Symbol Coding.
Multivariate and univariate GLM analysis showed that there were no significant effects of age and sex on the symptoms, cognitive tests, and biomarkers. BMI and TUD did not affect the biomarkers. Univariate GLM showed that there were significant effects of education on List Learning (p=0.038), Digit Sequencing (p=0.003), Symbol Coding (p<0.001) and Tower of London (p<0.001) (all positively associated) and the FF score (p=0.008; inverse association). There were no significant effects of the use of haloperidol, quetiapine, haloperidol, olanzapine and risperidone on the neurocognitive test results and biomarkers even without p-correction for multiple testing. There was however a significant effect of quetiapine on the symptom domains (F=3.56, df=11/95, p<0.001), although univariate GLM showed (after p-correction) an effect on the HAM-D score only (p=0.00109). The HAM-D score was significantly lowered by the use of quetiapine (mean ±SE: 12.4 ±4.1 versus 26.1 ±2.1). Most importantly, the intergroup differences between NRTT and PRTT in the clinical, cognitive and biomarker data remained significant after adjusting for these background variables.
Differences PRTT versus healthy controls
Table 2, NN#5 shows the results of a neural network model differentiating PRTT from controls (output variables) using the 9 biomarkers as input variables. This model was trained with two hidden layers with three units in hidden layer 1 and 2 units in hidden layer 2. We used hyperbolic tangent and identity as activation functions in the hidden layers and output layer, respectively. The error term was significantly lower in the testing than in training set indicating than the model has learned to generalize from the trend. Moreover, the percentage incorrect classifications were fairly stable across the three samples indicating that the model is not overfitted. ESF, Figure 8 shows the (relative) importance of the 9 biomarkers discriminating PRTT from controls, namely HMGB1 is by far the most important determinant of the predictive power of the neural network, while EM-2, β-endorphin, and IL-6 follow at a distance.
Tower of London, COWA, HMGB1, Category Instances, List learning, and EM2. The overall accuracy was 100%.
Discussion
The first major finding of this study is that the top-5 features of the symptomatic fingerprint of NRTT versus PRTT were (in descending order of importance): PMR, negative symptoms, psychosis, depressive symptoms, and mannerism. Previous studies often delineated TRS based on the severity of psychosis, including hallucinations, conceptual disorganization, unusual thought content and suspiciousness (5). However, the present study shows that when we examined the fingerprint of NRTT, psychosis was not the most important symptom domain discriminating NRTT from PRTT. Our ANOVA findings show that all symptom domains are more severe in NRTT than in PRTT, which extends the view that TRS is a more severe phenotype of schizophrenia (3). Our results of analysis of variance also show that hostility, excitement, FTD and physiosomatic symptoms are more expressed in NRTT than in PRTT, although in machine learning models these symptoms were less relevant. We found that the top-3 features of the cognitive fingerprint comprised (in descending order of importance): deficits in executive functions, and semantic and episodic memory. These findings extend those of a previous study reporting that cognitive deficits are more deficient in NRTT than in PRTT and are associated with clinical symptoms (32).
research including glutamatergic, but no dopaminergic aberrations, reduced grey matter and a higher familial load there is tentative evidence to conceptualize TRS as a qualitatively different class to non-TRS (34). However, these authors failed to explain why some “quantitative” differences in biomarkers could indicate that TRS is a distinct class. In fact, this kind of result allows to differentiate classes from each other, but not to make inferences on their quantitative versus qualitative distinctions (8, 16). In different studies, we have discussed that SIMCA should be used to explore whether classes are qualitatively different from each other (23, 35, 36). This machine learning method builds PC models around the models of different classes (e.g. NRTT and PRTT) and allows to compute model-to-model distances, as well as the discriminatory power of the input variables used to separate the classes. Large distances indicate that the classes are qualitatively different from each other as they occupy different subspaces (the SIMCA class models), which contain all cases grouped based on their similarities (8, 16, 23). Using SIMCA, we were able to show that NRTT and PRTT are two qualitatively distinct classes based on clinical symptom domains, neurocognitive tests and the combination of these two phenome indices as well. As such, the NRTT group is a qualitatively distinct class defined by (in descending order of importance): PMR, deficits in executive functions, psychosis, impairments in semantic memory and attention, and negative and depressive symptoms.
be used for diagnostic purposes (8). Prediction models built using SVM models yields, overall, better diagnostic accuracy than those obtained with SIMCA (8, 37-39) although knowledge acquisition through SVM is mainly limited to the interpretation of the support vectors (8, 16). In the present study, SVM and neural networks yielded a comparable classification accuracy, which agrees with a previous report that neural networks may have comparable performance as SVM (40). However, it is important to stress, that the NRTT and PRTT classes, as classified using CGI-I and CGCGI-I-S results, are externally validated by the different symptom domains of schizophrenia, various cognitive disorders and biomarkers as well. This indicates that in the clinical practice, TRS may be defined using CGI-I and CGI-S scores, and that future research should optimize our NRTT classification rule by performing unsupervised machine learning on a larger study group and cross-validating the new classification through supervised learning (23). As such, new TRS diagnostic criteria should be based on models obtained through machine learning rather than on consensus criteria as advocated previously (3).
TRS showed that CCL2, sTNFR1, and sTNFR2 levels were strongly associated with TRS, while CCL11 was elevated in schizophrenia but not in TRS (20). These, at first sight, contradictory results may be explained by differences in statistical approaches between the studies. Thus, in our study, CCL11 and KOR became relevant predictors when using machine learning models, which consider the more complex, including non-linear, interactions between biomarkers.
MOR (59-61). As such, the psychotomimetic and neurotoxic properties of these EOS peptides may contribute to the neuro-immune-opioid pathophysiology of TRS.
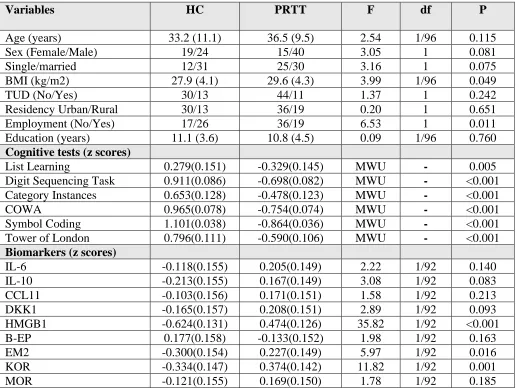
The third major finding of this study is that the PRTT subgroup is significantly discriminated from the healthy control group when using the cognitive tests coupled with HMGB1, KOR, and EM2. Moreover, using a NIOC pathway-phenotype constructed with SIMCA, we observed that the PRTT subgroup is a qualitatively distinct class that it is modeled and shaped by impairment in attention, executive functions, and semantic memory as well as increased HMGB1. These results show that non-remission in schizophrenia is partly determined by activated neuro-immune pathways and residual neurocognitive deficits, which additionally may be induced by HMGB1 (13). HMGB1 is released from necrotic cells thereby stimulating the production of pro-inflammatory cytokines, including IL-6, and neurotoxic factors leading to BBB breakdown and neurodegenerative processes, which are associated with memory impairments (62-65). Most importantly, we observed that using SIMCA, all controls were authenticated as belonging to the control class, and all PRTT were authenticated a belonging to the PRTT class. This indicates that none of the schizophrenia patients showed complete remission and that all schizophrenia patients showed no or only a partial response to two treatments with antipsychotic agents. Previously, it was proposed that antipsychotic treatments may be ineffective in TRS patients because they do not show an increased dopamine turnover and may show a different underpinning pathophysiology (66). However, our study indicated that none of the patients achieved total remission due to the impact of NIOC pathway-phenotypes.
The NRTT subgroup is a qualitatively distinct nosological entity and is significantly discriminated from the PRTT group with 100% accuracy using a NIOC pathway-phenotype model characterized by impairments in episodic and semantic memory and executive functions, CCL11, IL-6, and EM2. A NIOC pathway-phenotype also modeled and shaped the PRTT subgroup as a qualitatively distinct group that can be discriminated from the healthy control group with a 100% accuracy. None of the PRTT intruded the class limits of the normal controls - as constructed using NIOC variables - indicating that none of the patients achieved complete remission. Treatment with antipsychotic drugs did not result in any effect in around 50% of the patients while the remaining patients showed only a partial response. This treatment non-response, as well as the non-remitting in PRTT, appears to be determined by different NIOC pathway-phenotypes indicating cognitive deficits, activation of immune-inflammatory pathways and increased EOS activity.
Acknowledgment
We thank the staff of the Psychiatry Unit at Al-Imam Al-Hussain Medical City in Karbala city for their help in the collection of samples and the high-skilled staff members of Asia Clinical Laboratory, Najaf city, for their help in the assays.
Funding
No specific funding
Conflict of interest
Author’s contributions
References
1. Świtaj P, Anczewska M, Chrostek A, Sabariego C, Cieza A, Bickenbach J, et al. Disability and schizophrenia: a systematic review of experienced psychosocial difficulties. BMC psychiatry. 2012;12(1):193.
2. Kane J, Honigfeld G, Singer J, Meltzer H. Clozapine for the treatment-resistant schizophrenic: a double-blind comparison with chlorpromazine. Archives of general psychiatry. 1988;45(9):789-96.
3. Howes OD, McCutcheon R, Agid O, De Bartolomeis A, Van Beveren NJ, Birnbaum ML, et al. Treatment-resistant schizophrenia: treatment response and resistance in psychosis (TRRIP) working group consensus guidelines on diagnosis and terminology. American Journal of Psychiatry. 2017;174(3):216-29.
4. Lally J, Ajnakina O, Di Forti M, Trotta A, Demjaha A, Kolliakou A, et al. Two distinct patterns of treatment resistance: clinical predictors of treatment resistance in first-episode schizophrenia spectrum psychoses. Psychol Med. 2016;46(15):3231-40.
5. Suzuki T, Remington G, Mulsant BH, Uchida H, Rajji TK, Graff-Guerrero A, et al. Defining treatment-resistant schizophrenia and response to antipsychotics: a review and recommendation. Psychiatry research. 2012;197(1-2):1-6.
6. Goodwin G, Fleischhacker W, Arango C, Baumann P, Davidson M, de Hert M, et al. Advantages and disadvantages of combination treatment with antipsychotics: ECNP Consensus Meeting, March 2008, Nice. European Neuropsychopharmacology. 2009;19(7):520-32.
7. Maes M, Sirivichayakul S, Matsumoto AK, Maes A, Michelin AP, de Oliveira Semeão L, et al. Increased Levels of Plasma Tumor Necrosis Factor-α Mediate Schizophrenia Symptom Dimensions and Neurocognitive Impairments and Are Inversely Associated with Natural IgM Directed to Malondialdehyde and Paraoxonase 1 Activity. Molecular Neurobiology. 2020.
8. Al-Hakeim HK, Almulla AF, Maes M. The Neuroimmune and Neurotoxic Fingerprint of Major Neurocognitive Psychosis or Deficit Schizophrenia: a Supervised Machine Learning Study. Neurotoxicity Research. 2020;37(3):753-71.
9. Smith R, Maes M. The macrophage-T-lymphocyte theory of schizophrenia: additional evidence. Medical hypotheses. 1995;45(2):135-41.
10. Roomruangwong C, Noto C, Kanchanatawan B, Anderson G, Kubera M, Carvalho AF, et al. The role of aberrations in the immune-inflammatory response system (IRS) and the compensatory immune-regulatory reflex system (CIRS) in different phenotypes of schizophrenia: the IRS-CIRS theory of schizophrenia. Molecular neurobiology. 2020;57(2):778-97.
11. Sirivichayakul S, Kanchanatawan B, Thika S, Carvalho AF, Maes M. A New Schizophrenia Model: Immune Activation is Associated with the Induction of Different Neurotoxic Products which Together Determine Memory Impairments and Schizophrenia Symptom Dimensions. CNS & Neurological Disorders-Drug Targets (Formerly Current Drug Targets-CNS & Neurological Disorders). 2019;18(2):124-40.
thought disorders, and psychopathology in schizophrenia patients. Neurotoxicity research. 2019;35(1):122-38.
13. Al-Dujaili AH, Mousa RF, Al-Hakeim HK, Maes M. High Mobility Group Protein 1 and Dickkopf-Related Protein 1 in Schizophrenia and Treatment-Resistant Schizophrenia: Associations with Interleukin-6, Symptom Domains, and Neurocognitive Impairments. 2019.
14. Noto MN, Maes M, Nunes SOV, Ota VK, Rossaneis AC, Verri Jr WA, et al. Activation of the immune-inflammatory response system and the compensatory immune-regulatory system in antipsychotic naive first episode psychosis. European Neuropsychopharmacology. 2019;29(3):416-31.
15. Maes M, Bosmans E, Ranjan R, Vandoolaeghe E, Meltzer HY, De Ley M, et al. Lower plasma CC16, a natural anti-inflammatory protein, and increased plasma interleukin-1 receptor antagonist in schizophrenia: effects of antipsychotic drugs. Schizophr Res. 1996;21(1):39-50.
16. Al-Hakeim HK, Almulla AF, Hussein Al-Dujaili A, Maes M. Construction of a neuro-immune-cognitive pathway-phenotype underpinning the phenome of deficit schizophrenia. Current topics in medicinal chemistry. 2020.
17. Lin A, Kenis G, Bignotti S, Tura G-J-B, De Jong R, Bosmans E, et al. The inflammatory response system in treatment-resistant schizophrenia: increased serum interleukin-6. Schizophrenia research. 1998;32(1):9-15.
18. Maes M, Bocchio Chiavetto L, Bignotti S, Battisa Tura GJ, Pioli R, Boin F, et al. Increased serum interleukin-8 and interleukin-10 in schizophrenic patients resistant to treatment with neuroleptics and the stimulatory effects of clozapine on serum leukemia inhibitory factor receptor. Schizophr Res. 2002;54(3):281-91.
19. Zhang XY, Zhou DF, Cao LY, Wu GY, Shen YC. Cortisol and cytokines in chronic and treatment-resistant patients with schizophrenia: association with psychopathology and response to antipsychotics. Neuropsychopharmacology : official publication of the American College of Neuropsychopharmacology. 2005;30(8):1532-8.
20. Noto C, Maes M, Ota VK, Teixeira AL, Bressan RA, Gadelha A, et al. High predictive value of immune-inflammatory biomarkers for schizophrenia diagnosis and association with treatment resistance. The World Journal of Biological Psychiatry. 2015;16(6):422-9. 21. Moustafa SR, Al-Rawi KF, Al-Dujaili AH, Supasitthumrong T, Al-Hakeim HK, Maes M.
The Endogenous Opioid System in Schizophrenia and Treatment Resistant Schizophrenia: Increased Plasma Endomorphin 2, and κ and μ Opioid Receptors are Associated with Interleukin-6. 2020.
22. Keefe RS, Goldberg TE, Harvey PD, Gold JM, Poe MP, Coughenour L. The Brief Assessment of Cognition in Schizophrenia: reliability, sensitivity, and comparison with a standard neurocognitive battery. Schizophrenia research. 2004;68(2-3):283-97.
23. Maes M, Schotte C, Maes L, Cosyns P. Clinical subtypes of unipolar depression: Part II. Quantitative and qualitative clinical differences between the vital and nonvital depression groups. Psychiatry research. 1990;34(1):43-57.
24. Haro J, Kamath S, Ochoa S, Novick D, Rele K, Fargas A, et al. The Clinical Global Impression–Schizophrenia scale: a simple instrument to measure the diversity of symptoms present in schizophrenia. Acta Psychiatrica Scandinavica. 2003;107:16-23.
26. Overall JE, Gorham DR. The brief psychiatric rating scale. Psychological reports. 1962;10(3):799-812.
27. Hamilton M. A rating scale for depression. Journal of neurology, neurosurgery, and psychiatry. 1960;23(1):56.
28. Kay SR, Fiszbein A, Opler LA. The positive and negative syndrome scale (PANSS) for schizophrenia. Schizophrenia bulletin. 1987;13(2):261-76.
29. Kanchanatawan B, Hemrungrojn S, Thika S, Sirivichayakul S, Ruxrungtham K, Carvalho AF, et al. Changes in tryptophan catabolite (TRYCAT) pathway patterning are associated with mild impairments in declarative memory in schizophrenia and deficits in semantic and episodic memory coupled with increased false-memory creation in deficit schizophrenia. Molecular neurobiology. 2018;55(6):5184-201.
30. Zachrisson O, Regland B, Jahreskog M, Kron M, Gottfries CG. A rating scale for fibromyalgia and chronic fatigue syndrome (the FibroFatigue scale). Journal of psychosomatic research. 2002;52(6):501-9.
31. CAMO. The Unscrambler Appendices: Method References, 2019. As assessed 19-3-2020 wwwcamocom/helpdocs/The_Unscrambler_Method_Referencespdf. 2019.
32. Frydecka D, Beszłej JA, Gościmski P, Kiejna A, Misiak B. Profiling cognitive impairment in treatment-resistant schizophrenia patients. Psychiatry research. 2016;235:133-8.
33. Correll CU, Brevig T, Brain C. Exploration of Treatment-Resistant Schizophrenia Subtypes Based on a Survey of 204 US Psychiatrists. Neuropsychiatric Disease and Treatment. 2019;15:3461.
34. Gillespie AL, Samanaite R, Mill J, Egerton A, MacCabe JH. Is treatment-resistant schizophrenia categorically distinct from treatment-responsive schizophrenia? a systematic review. BMC Psychiatry. 2017;17(1):12.
35. Maes M, Stevens WJ, Declerck LS, Bridts CH, Peters D, Schotte C, et al. Significantly increased expression of T-cell activation markers (interleukin-2 and HLA-DR) in depression: Further evidence for an inflamatory process during that illness. Progress in Neuro-Psychopharmacology and Biological Psychiatry. 1993;17(2):241-55.
36. Kanchanatawan B, Sriswasdi S, Maes M. Supervised machine learning to decipher the complex associations between neuro-immune biomarkers and quality of life in schizophrenia. Metabolic brain disease. 2019;34(1):267-82.
37. De Maesschalck R, Candolfi A, Massart D, Heuerding S. Decision criteria for soft independent modelling of class analogy applied to near infrared data. Chemometrics and Intelligent Laboratory Systems. 1999;47(1):65-77.
38. de Pierrefeu A, Löfstedt T, Laidi C, Hadj‐Selem F, Bourgin J, Hajek T, et al. Identifying a neuroanatomical signature of schizophrenia, reproducible across sites and stages, using machine learning with structured sparsity. Acta Psychiatrica Scandinavica. 2018;138(6):571-80.
39. Rácz A, Gere A, Bajusz D, Héberger K. Is soft independent modeling of class analogies a reasonable choice for supervised pattern recognition? RSC Advances. 2018;8(1):10-21. 40. Zaghloul W, Lee SM, Trimi S. Text classification: neural networks vs support vector
machines. Industrial Management & Data Systems. 2009.
42. Benedetti F, Lucca A, Brambilla F, Colombo C, Smeraldi E. Interleukine-6 serum levels correlate with response to antidepressant sleep deprivation and sleep phase advance. Progress in Neuro-Psychopharmacology and Biological Psychiatry. 2002;26(6):1167-70. 43. Liu L, Wan W, Xia S, Kalionis B, Li Y. Dysfunctional Wnt/β-catenin signaling contributes
to blood–brain barrier breakdown in Alzheimer’s disease. Neurochemistry international. 2014;75:19-25.
44. Na K-S, Jung H-Y, Kim Y-K. The role of pro-inflammatory cytokines in the neuroinflammation and neurogenesis of schizophrenia. Progress in Neuro-Psychopharmacology and Biological Psychiatry. 2014;48:277-86.
45. Davidson G, Mao B, del Barco Barrantes I, Niehrs C. Kremen proteins interact with Dickkopf1 to regulate anteroposterior CNS patterning. Development (Cambridge, England). 2002;129(24):5587-96.
46. Dickins EM, Salinas PC. Wnts in action: from synapse formation to synaptic maintenance. Front Cell Neurosci. 2013;7:162.
47. Orellana JA, Sáez JC, Bennett MVL, Berman JW, Morgello S, Eugenin EA. HIV increases the release of dickkopf‐1 protein from human astrocytes by a Cx43 hemichannel‐dependent mechanism. Journal of neurochemistry. 2014;128(5):752-63.
48. Marzo A, Galli S, Lopes D, McLeod F, Podpolny M, Segovia-Roldan M, et al. Reversal of Synapse Degeneration by Restoring Wnt Signaling in the Adult Hippocampus. Current biology : CB. 2016;26(19):2551-61.
49. Seib DR, Corsini NS, Ellwanger K, Plaas C, Mateos A, Pitzer C, et al. Loss of Dickkopf-1 restores neurogenesis in old age and counteracts cognitive decline. Cell stem cell. 2013;12(2):204-14.
50. Jessop DS, Major GN, Coventry TL, Kaye SJ, Fulford AJ, Harbuz MS, et al. Novel opioid peptides endomorphin-1 and endomorphin-2 are present in mammalian immune tissues. Journal of neuroimmunology. 2000;106(1-2):53-9.
51. Jessop D, Richards L, Harbuz M. Opioid Peptides Endomorphin-1 and Endomorphin-2 in the Immune System in Humans and in a Rodent Model of Inflammation. Annals of the New York Academy of Sciences. 2002;966:456-63.
52. Li ZH, Chu N, Shan LD, Gong S, Yin QZ, Jiang XH. Inducible expression of functional mu opioid receptors in murine dendritic cells. Journal of neuroimmune pharmacology : the official journal of the Society on NeuroImmune Pharmacology. 2009;4(3):359-67.
53. Ninković J, Roy S. Role of the mu-opioid receptor in opioid modulation of immune function. Amino acids. 2013;45(1):9-24.
54. Clark SD, Abi-Dargham A. Dynorphin and the Kappa Opioid Receptor’s Role in the Symptomatology of Schizophrenia: A Review of the Evidence. Biological psychiatry. 2019. 55. Russjan E, Andrzejewski K, Sulejczak D, Kleczkowska P, Kaczyńska K. Endomorphin-2- and Neurotensin- Based Chimeric Peptide Attenuates Airway Inflammation in Mouse Model of Nonallergic Asthma. International journal of molecular sciences. 2019;20(23). 56. Land BB, Bruchas MR, Lemos JC, Xu M, Melief EJ, Chavkin C. The dysphoric component
of stress is encoded by activation of the dynorphin κ-opioid system. Journal of Neuroscience. 2008;28(2):407-14.
58. Shekhar A. Role of Kappa Opioid Receptors in Symptoms of Schizophrenia: What Is the Neurobiology? Biological psychiatry. 2019;86(7):494-6.
59. Heinke B, Gingl E, Sandkühler J. Multiple Targets of -Opioid Receptor-Mediated Presynaptic Inhibition at Primary Afferent A - and C-Fibers. The Journal of neuroscience : the official journal of the Society for Neuroscience. 2011;31:1313-22.
60. Chen Y-B, Huang F-S, Fen B, Yin J-B, Wang W, Li Y-Q. Inhibitory effects of endomorphin-2 on excitatory synaptic transmission and the neuronal excitability of sacral parasympathetic preganglionic neurons in young rats. Frontiers in cellular neuroscience. 2015;9:206.
61. Leff Gelman P, González Herrera NE, Matus Ortega ME, Pavón Romero L, Téllez Santillán C, Salazar Juárez A, et al. Endomorhin peptides: pharmacological and functional implications of these opioid peptides in the brain of mammals. Part one. 2010.
62. Fang P, Schachner M, Shen Y-Q. HMGB1 in development and diseases of the central nervous system. Molecular neurobiology. 2012;45(3):499-506.
63. Gao H-M, Zhou H, Zhang F, Wilson BC, Kam W, Hong J-S. HMGB1 acts on microglia Mac1 to mediate chronic neuroinflammation that drives progressive neurodegeneration. Journal of Neuroscience. 2011;31(3):1081-92.
64. Fujita K, Motoki K, Tagawa K, Chen X, Hama H, Nakajima K, et al. HMGB1, a pathogenic molecule that induces neurite degeneration via TLR4-MARCKS, is a potential therapeutic target for Alzheimer’s disease. Scientific reports. 2016;6(1):1-15.
65. Andersson U, Tracey KJ. HMGB1 is a therapeutic target for sterile inflammation and infection. Annual review of immunology. 2011;29:139-62.
Figure 1. Results of neural network (importance chart) with non and partial responders to treatment as output variables and symptom domains
as input variables. PANSSneg: Negative subscale of the Positive and Negative Syndrome Scale, PMR: psychomotor retardation, SANS: Scale for
the Assessment of Negative Symptoms, HAMD HAMA: Hamilton Depression and Anxiety Rating Scale, FTD: formal thought disorders, FF:
Figure 4. Results of SIMCA (discrimination plot) separating non (TRS) from partial responders (nonTRS). Shown in the discrimination power of the selected input variables. ListLearn: List Learning, DigSeq: Digit Sequencing, CatInst: category instances, COWA: Controlled Oral Word Association, TOL: Tower of London, Mann: mannerism, PMR: psychomotor retardation, PANSSn: Negative subscale of the Positive and
Table 1: Demographic and clinical data of healthy controls (HC) and schizophrenia patients divided into partial (PRTT) and non (NRTT) responders to treatment.
Variables PRTT
(n=55)
NRTT (n=60)
F/ψ/χ2 df p
CGI-I 2.73 (0.45) 4.20 (0.40) 342.92 1/113 <0.001
CGI-S 4.38 (0.49) 5.95 (0.70) 190.63 1/113 <0.001
Age (years) 36.5 (9.5) 36.2 (12.3) 0.02 1/113 0.889
Sex (Female/Male) 15/40 22/38 1.16 1 0.281
Single/married 35/30 32/28 0.71 1 0.399
BMI (kg/m2) 29.6 (4.3) 28.4 (4.9) 1.82 1/113 0.180
TUD (No/Yes) 44/11 40/20 2.59 1 0.107
Residency Urban/Rural 36/19 39/21 0.003 1 0.959
Employment (No/Yes) 36/19 43/17 0.515 1 0.473
Education (years) 10.8 (4.5) 8.9 (4.7) 5.12 1/113 0.026
Age at onset (years) 27.5 (7.5) 29.3 (10.2) 1.14 1/113 0.287
Family history (Yes/No) 41/14 51/9 1.96 1 0.161
Clozapine (No/Yes) 55/0 46/14 Ψ=0.356 - <0.001
Quietiapin (No/Yes) 55/0 54/6 Ψ=0.225 - 0.016
Haloperidol (No/Yes) 43/12 60/0 Ψ=0.357 - <0.001
Olanzapine (No/Yes) 2/53 25/35 Ψ=0.448 - <0.001
Risperidone 53/2 48/12 Ψ=0.250 - 0.007
Symptom domains
Psychosis -0.35 (0.36) 1.15 (0.33) 532.09 1/113 <0.001
Hostility -0.41 (0.35) 1.14 (0.48) 393.87 1/113 <0.001
Excitement -0.30 (0.34) 1.07 (0.63) 206.88 1/113 <0. 001
Mannerism 0.11 (0.46) 0.83 (0.71) 41.03 1/113 <0. 001
FTD -0.18 (0.40) 1.05 (0.50) 213.15 1/113 <0.001
PMR -0.48 (0.32) 1.12 (0.66) 267.90 1/113 <0.001
PANSSneg 19.4 (4.6) 36.5 (5.6) 318.61 1/113 <0. 001
SANS total score * 52.5 (12.2) 91.95 (16.9) 201.93 1/113 <0.001
FF-total 15.1 (9.7) 25.1 (11.0) 26.85 1/113 <0. 001
HAM-A 23.6 (4.3) 35.3 (7.2) 109.45 1/113 <0.001
HAM-D 21.3 (5.9) 30.9 (8.7) 47.82 1/113 <0.001
List learning * 48.2 (1.5) 21.4 (1.4) 166.10 1/110 <0.001
Digit sequencing task * 6.8 (0.4) 2.7 (0.4) 49.85 1/110 <0.001
Category instances * 41.4 (1.4) 29.7 (1.3) 28.53 1/110 <0.001
COWA * 20.3 (0.9) 6.5 (0.9) 98.71 1/110 <0.001
Symbol coding * 8.1 (0.9) 3.3 (0.9) 30.58 1/110 <0.001
Tower of London * 8.6 (0.5) 2.5 (0.5) 74.59 1/110 <0.001
Biomarkers
IL-6* pg/mL 5.25 (6.13) 7.61 (4.99) 15.85 1/109 <0.001
IL-10 pg/mL 12.90 (4.67) 14.29 (7.27) 0.81 1/109 0.371
CCL11 pg/mL 194.01 (55.93) 220.19 (73.45) 2.93 1/109 0.090
DKK1* pg/mL 812.77 (519.43) 1106.01(628.50) 5.66 1/109 0.019
HMGB1* ng/mL 19.46 (10.98) 22.24 (11.76) 1.54 1/109 0.217
β-EP * pg/mL 17.23 (9.65) 24.80 (21.32) 7.55 1/109 0.007
EM2 * pg/mL 32.88 (22.08) 48.23 (30.23) 10.06 1/109 0.002
KOR * ng/mL 7.67 (10.16) 7.29 (4.82) 2.10 1/109 0.150
MOR pg/mL 3.48 (2.23) 4.76 (2.63) 12.45 1/109 0.001
Results are shown as mean (SD), except the neuropsychological test scores which are shown as estimated marginal mean (SE) values after adjusting for the effects of age, sex and education
Table 2. Results of neural networks (NN) with the non (NRTT) and partial responders (PRTT) to treatment groups as output variables.
Models NN#1
NRTT vs PRTT
NN#2 NRTT vs PRTT
NN#3 NRTT vs PRTT
NN#4 TRS index
NN#5 PRTT vs HC
Input Layer Number of units 11 (symptoms) 6 (cognition) 9 (biomarkers)
15 (biomarkers and cognition)
9 (biomarkers)
Rescaling method Normalized Normalized Normalized Normalized Normalized
Hidden layers
Number of hidden layers 2 1 2 2 2
Number of units in hidden layer 1 3 4 4 3 3
Number of units in hidden layer 2 2 - 3 2 2
Activation Function Hyperbolic tangent Hyperbolic tangent Hyperbolic tangent Hyperbolic tangent Hyperbolic tangent Output layer
Dependent variables NRTT vs PRTT NRTT vs PRTT NRTT vs PRTT TRS index PRTT vs HC
Number of units 2 1 2 1 2
Activation function Identity Identity Identity Identity Identity
Error function Sum of squares Sum of squares Sum of squares Sum of squares Sum of squares
Training
Sum of squares error term 0.011 2.536 9.251 4.261 6.919
% incorrect or relative error 0.0% 3.6% 23.1% 0.155 17.4%
Prediction (sens, spec) 100%, 100% 96.6%, 96.3% 80.8%, 73.1% - 88.9%, 73.7%
Testing
Sum of Squares error 0.002 0.6000 2.780 2.263 4.314
% incorrect or relative error 0.0% 4.5% 16.0% 0.202 22.7%
Prediction (sens - spec) 100%-100% 100%, 91.7% 92.9%–72.7% - 80.0%, 75.0%
AUC ROC 100%-100% 0.991 0.860 - 0.833
Holdout
% incorrect or relative error 0.0% 0.0% 23.7% 0.196 16.7%
Prediction (sens-spec) or
correlation with predicted value 100%, 100% 100%, 100% 90.0%, 61.1%
r=0.908 88.9%, 75.0%
Table 3. Results of Support vector machine (SVM) and SIMCA discriminating non-responders to treatment (NRTT) from partial responders to treatment (PRTT) and the latter from healthy controls (HC)
Dichotomy
SVM accuracy SIMCA TOP 7 discriminating variables + discriminatory power
Discriminating variables Training (%) Validating (%)
Distance Top 1 Top 2 Top 3 Top 4 Top 5 Top 6 Top 7
NRTT vs PRTT
11 Symptoms 100% 100% 50.0331 SANS
10.6101 HAMD 10.0293 FF 8.9708 Excitation 8.6907 HAMA 8.2859 Mannerism 7.9892 PMR 7.2788 NRTT vs PRTT
6 NC tests + 11 symptoms
100% 100% 21.2341 PMR
7.8132 TOL 6.3677 Psychosis 6.1197 CI 5.7244 SC 5.4330 SANS 5.3560 HAMD 5.0646 NRTT vs PRTT
6 NC tests 96.52% 93.04% 64.6991 TOL
10.1187 SC 8.5338 DS 7.5817 COWA 7.4520 LL 7.1601 CI 6.8338 - NRTT vs PRTT
6 NC tests + 9 biomarkers
99.13% 94.78% 9.4236 CI
4.7118 TOL 4.5308 DS 3.6251 COWA 3.5751 LL 3.3230 SC 3.1711 KOR 2.8218 PRTT vs HC
6 NC tests + 9 biomarkers
100% 100% 58.2855 SC
17.0587 TOL 11.6761 COWA 10.5431 HMGB1 8.4726 CI 7.8050 LL 7.4181 EM2 7.4057
NC: neurocognitive tests
Table 4. Differences in biomarkers and cognitive tests between partial responders to treatment (PRTT) and healthy controls (HC)
Variables HC PRTT F df P
Age (years) 33.2 (11.1) 36.5 (9.5) 2.54 1/96 0.115
Sex (Female/Male) 19/24 15/40 3.05 1 0.081
Single/married 12/31 25/30 3.16 1 0.075
BMI (kg/m2) 27.9 (4.1) 29.6 (4.3) 3.99 1/96 0.049
TUD (No/Yes) 30/13 44/11 1.37 1 0.242
Residency Urban/Rural 30/13 36/19 0.20 1 0.651
Employment (No/Yes) 17/26 36/19 6.53 1 0.011
Education (years) 11.1 (3.6) 10.8 (4.5) 0.09 1/96 0.760
Cognitive tests (z scores)
List Learning 0.279(0.151) -0.329(0.145) MWU - 0.005
Digit Sequencing Task 0.911(0.086) -0.698(0.082) MWU - <0.001
Category Instances 0.653(0.128) -0.478(0.123) MWU - <0.001
COWA 0.965(0.078) -0.754(0.074) MWU - <0.001
Symbol Coding 1.101(0.038) -0.864(0.036) MWU - <0.001
Tower of London 0.796(0.111) -0.590(0.106) MWU - <0.001
Biomarkers (z scores)
IL-6 -0.118(0.155) 0.205(0.149) 2.22 1/92 0.140
IL-10 -0.213(0.155) 0.167(0.149) 3.08 1/92 0.083
CCL11 -0.103(0.156) 0.171(0.151) 1.58 1/92 0.213
DKK1 -0.165(0.157) 0.208(0.151) 2.89 1/92 0.093
HMGB1 -0.624(0.131) 0.474(0.126) 35.82 1/92 <0.001
B-EP 0.177(0.158) -0.133(0.152) 1.98 1/92 0.163
EM2 -0.300(0.154) 0.227(0.149) 5.97 1/92 0.016
KOR -0.334(0.147) 0.374(0.142) 11.82 1/92 0.001
Electronic Supplementary File (ESF)
Pathway-phenotypes of non-responders and partial responders to treatment with antipsychotics in schizophrenia: a machine learning study.
Hussein Kadhem Al-Hakeim, a Rana Fadhil Mousa, b Arafat Hussein Al-Dujaili, c Michael Maes d,e,f.
a Department of Chemistry, College of Science, University of Kufa, Iraq. E-mail: [email protected]. b Faculty of Veterinary Medicine, University of Kerbala, Iraq. E-mail: [email protected].
c Senior Clinical Psychiatrist at the Faculty of Medicine, University of Kufa, Iraq. E-mail: [email protected]. d Corresponding Author: Department of Psychiatry, Faculty of Medicine, Chulalongkorn
University, Bangkok, Thailand.
e Department of Psychiatry, Medical University of Plovdiv, Plovdiv, Bulgaria.
f School of Medicine, IMPACT Strategic Research Centre, Deakin University, PO Box 281,
ESF, Figure 5. Results of SIMCA showing the Si/So plot. This plot displays the distance of all cases in the validation set to the class model of non-responders to treatment (NRTT or TRS) on the y-axis and the distance of each case to the NRTT model centre