GWSVM Algorithm for a Grid System
P.vishvapathi#1, Dr.S.Ramachandram*2, Dr.A.Govardhan#3#Department of CSE, CMR Engineering College, Hyderabad, India
*Professor, Department of CSE, University College of Engineering,Osmania University, Hyderabad, India #Professor, Department of CSE, JNT University, Hyderabad, India
Abstract— This paper focuses on distributed data mining algorithm that we propose GWSVM (Grid Weighted Support Vector Machine) algorithm for our grid based system. In this we proposed a regression model based on weighted SVM for analytics purpose. Weighted SVM based regression model can predict the future out comes also based on present data. We test our algorithm on our collected dataset and compare our results with SVM based model and Decision tree. GWSVM performs better compare with SVM based model. We focus on the data mining aspects of IMR (infant mortality rate) and MMR (maternal mortality rate) related to grid based health care system. The paper discusses the importance of health care center and grid computing. The main objective is to reduce the number of deaths related to child and women thereby meeting the Millenium Development Goals.
Keywords— Distributed data mining, Grid, SVM, WSVM, IMR, MDGs and MMR.
I. INTRODUCTION
In this world there are many environments which are distributed in nature. We need to analyze and monitor these distributed data sources for various distributed applications. Sometimes available resources and human factors control scalable solutions for distributed applications. Those kind of distributed architectures are needed which can focus on the distributed resources related to data, computing and communication in order to consume them in a near optimal fashion. In the Figure 1 below, we can visualize the distributed data mining framework.
In this diagram the interconnection between data source and data mining algorithm. There is connection of data mining algorithm, local model, local model aggregation and final model. The decision in the DDM is generally based on the properties of computing, storage and communication capabilities.
Fig. 1 Distributed Data Mining Framework
II. DATA MINING APPROACHES
There are two major steps in distributed systems to predict values first we collect the data and apply some pre-processing steps and extract some features. Then features are used to builds our predictive model. In this step we apply data mining algorithm to build model based on extracted features from first stage.
A. Decision tree based approach
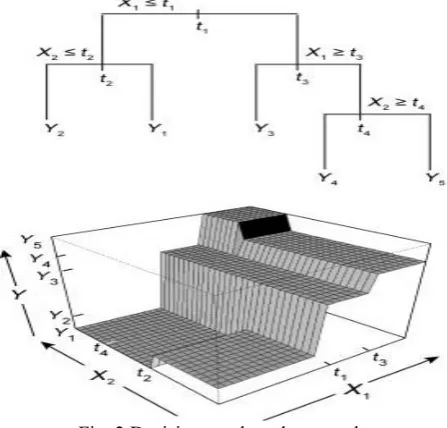
Decision tree-based models partition the operational space into rectangles.
To divide into rectangle use a series of rules to identify regions which have most homogeneous responses. They then fit a constant to each region with classification trees fitting the most probable class as the constant, and regression trees fitting the mean response for observations in that region, as
Fig. 2 Decision tree based approach
For example, in Figure 2 the two predictor variables X1 and X2 and the response Y. Regions Y1, Y2,etc. are terminal nodes or leaves, and t1, t 2, etc. are split points. Predictors and split points are chosen such a way that it minimizes prediction errors.
B. Regression based approach
Regression [1][2][3]refers to relationship between one dependent variable and a series of other changing variables. The classification of regression can be into linear and non-linear. In linear regression the association between the dependent and independent variables is linear. Regression may be multiple or simple depending on the independent variables.
Fig. 3 Linear Regression A simple linear regression form is the form:
In this case Y needs to be predicted. X is the
independent variable where as, ‘a’ is the intercept, ‘b’ is
the slope and ‘u’ is the regression residual. It takes the
following form:
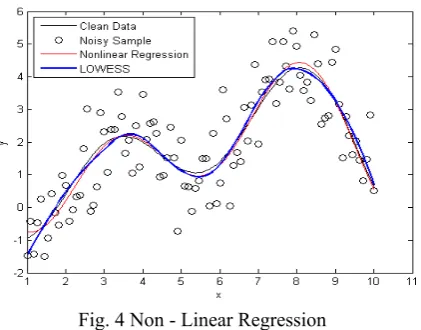
Nonlinear regression is other category. The association between the models is described in the form of a quadratic equation or any higher degree polynomial. The data is fitted by a method of successive approximations.
Fig. 4 Non - Linear Regression
To solve non-linear least squares problems the Gauss– Newton algorithm method is used. It has limitations for example the problem with Gauss Newtonian method is that it can only be used to minimize a sum of squared function values.
The Gradient Descent algorithm represents an extension of the normalized least mean square (NLMS) algorithm by means of an additional gradient adaptive term in the denominator of the learning rate of NLMS. The Levenberg-Marquardt algorithm is a combination of both Gauss Newtonian Algorithm and Gradient Descent algorithm. Due to non-linear associations such algorithms are used.
Even for higher degree of linearity the Gradient Descent algorithm works. Even though we have many regression algorithms still we face many problems. The data is very huge and the associations in them are complex when it comes to optical character recognition or image processing or voice recognition. Sometimes we have to compromise either on accuracy or time complexity.
All these algorithms may not give us a generic regression model for the data. Sometimes whole model needs to be regenerated even if it means that even for a slightest change in the data. Support Vector Machine based Regression is developed to overcome all these problems.
The solution is unique and optimum as there is no local minima. It also produces a generalized regression model based on the data. For small changes in the dataset the model need not be generated. Other benefit of this technique is that, the model can be generated even with small amounts of data.
C. Support Vector machine Regression
Support Vector Machines [4][5][6][7][8] based on statistical learning theory, developed by Cortes and Vapnik
(1995), has attracted attention and gained extensive
application in classification and regression problems.SVM can handle multiple categorical and continuous attribute values.
In the regression problem dataset X can be separated linearly by an optimal hyper plane which is also called maximal margin hyper plane.
Data is non-linearly separable than it transforms the input data samples from low dimensional input space to a higher dimensional space that is known as feature space. For mapping the input data into higher dimensional space kernel function is used and then SVM constructs an optimal separating hyper plane in this higher dimensional feature space. A mathematical model is built using dataset which called training dataset.
Given a set of data points , such that xkϵRnis an input
and ykϵ R is a target output, the linear SVM regression
algorithm tries to find the function f(x,w)= wx+b
Where f is an unknown target function, b is the bias term; w
is the weight factor, SVM regression equation as follows
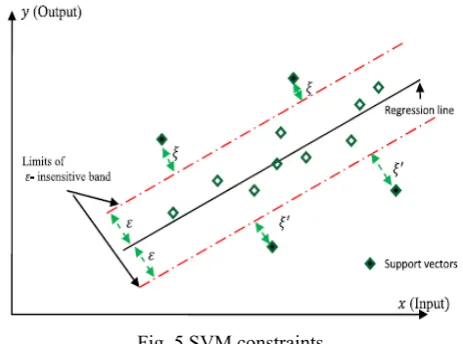
Subject to constraints
Where C is a regularization parameter used to decide a trade-off between the training error and the margin. Xk is
a vector of k-sample is dataset mapped to a higher dimensional space by the kernel function φ and ξ'k denotes
Fig. 5 SVM constraints
D. Weighted SVM model
In the weighted SVM [4][5][6][7][8]based regression approach we add additional weight factors. Weighted SVM equations are given below
Where wi is the weight for the ith sample, 0 ≤ wi ≤ 1. Good fitting function can be got by choosing appropriate functional space. Here the weight of WSVM is taken as follows
Where η, p are prefixed positive constants. The new weight doesn’t relate to the test samples, so it consumes shorter CPU time than general WSVM does. WSVM is superior to ε-SVM when there are some singularities in the training samples. But there should be a premise if this WSVM performs well.
The premise is that the number of the singularities of the two sides of function curve should be similar, and the distance of singularities of the two sides to the function curve should be similar, or the fitted curve will direct towards one side with more and larger singularities. This makes the algorithm short of bad generalization.
III. PROPOSED FOUR LAYER HEALTHGRID
ARCHITECTURE
The Proposed Four Layered Health Grid Architecture is as shown in the Figure 6. The idea is to connect all the four major centers that include village health center (Sub Center), Primary Health Care Center, Community Health Care Center, District Health Care Center and Super Specialty Center.
Fig. 6 Proposed 4-layered Grid Health Care Architecture
IV. GWSVM (Grid Weighted Support Vector Machine)
Algorithm
Step 1: In W-SVM, we used radial basis function (RBF,
equation shown below) Kernel (literature shows RBF is good kernel when solving nonlinear regression problems by WSVM).
Where x is the data sample and x’ inverse of x and σ is the width of kernel.
Step 2: Two important parameters c and σ2 of W-SVM
models were determined Using grid level.
Step 3: Convert the text features into numerical values at
each grid level Assuming
a) For this conversion Yes=1;
b) No = 0
c) Any other values has get score in between 0 and 1
Step 3: For every Grid level for each pair (c, σ2) in
the Cartesian product of these two sets and evaluates their performance on each level of grid using cross-validation on the training set, in which case multiple WSVMs are trained per levels). Once parameters are optimized at one level use as starting points for next level and again we optimize for that particular level and so on. Finally at the highest level we get optimized parameters.
Step 4: After finding the optimal parameters in grid level
search approach we Trained our W-SVM model using our training data set with these optimal Parameters.
Step 5: Now our model is ready, we predict the future
values based on this trained model, which is optimized on grid level based approach.
V. EXPERIMENTS AND RESULTS
The Data sets of 1000 Infants and 1000 Women at each grid layer are collected. Three diseases malaria, Diarrhea and measles are considered for experimentation.
For regression methods, the following adjustments were carried out. For W-SVM, the radial basis function (RBF) kernel was used and two important parameters c and
σ2 of W-SVM models were determined by a grid level
search. Weka Toolbox, Scikit learn library and python based library are used.
The training set is divided into n subsets of equalize. Sequentially one subset is used for testing and other n-1 used for training at each grid level.
The best Cartesian product pair(c, σ2) at each grid level
which gives highest accuracy at that grid level is taken. This procedure is performed at each grid levels. The sample data for Infant is given in Table 1 below.
TABLE 1 DISEASES SYMPTOMS
SNO Disease Sym-1 Sym-2 Sym-3 Sym-4 Sym-5 Sym-6
1 Malaria chills Fever 100.5 Headache Sweats Fatigue Vomiting and Nausea
2 Diarrhea Dehydration Fever of 102 Abdominal pain Lethargy Vomiting Blood from body
3 Measles Coryza and Dry hacking cough 101 – and goes to 103 or 105 Sneezing Conjunctivitis inflamed eyes. Watery and Photophobia
4
Acute respiratory distress syndrome symptoms
Dyspnea 96.8 hypoxemia Severe hypertension Pulmonary Tachypnea -
TABLE 2 VACCINATION DETAILS
Vaccination During pregnancy After Pregnancy
FLU (once a year) YES/NO YES/NO
HPV (Human Papillomavirus) YES/NO YES/NO
MMR (Measles, Mumps, Rubella) YES/NO YES/NO
Varicella (Chicken pox) YES/NO YES/NO
Hepatitis A YES/NO YES/NO
Hepatitis A YES/NO YES/NO
Meningococcal YES/NO YES/NO
Pneumococcal YES/NO YES/NO
Doctor Check-up Monthly YES/NO YES/NO
If During Pregnancy number of “NOs” = 3 and in “After Pregnancy”, number of “NOs” = 3, then death occurrence is high During Pregnancy = DP, After Pregnancy = AP
TABLE 3 BP DETAILS
BLOOD PRESSURE CATEGORY SYS/DIA
Normal (N) 120-129/80-84
High Normal (HN) 130-139/85-89
High Blood pressure (HBP) 135/85
High blood pressure with diabetes (HD) 140/90
TABLE 4
WOMEN DATA AT VILLAGE LEVEL
VILLAGE
Lady-name
FLU (once a
year)
HPV (Human Papillomavirus)
MMR (Measles,
Mumps, Rubella)
Varicella (Chicken
pox)
Hepatitis
A Hepatitis B Meningococcal
Hemoglobin Level (g/dl) (<9.0% or 9.0%-10.6%
or >= 11%)
Blood Pressure
DP AP DP AP DP AP DP AP DP AP DP AP DP AP DP AP DP AP
Lady -
1 Y N Y Y Y Y Y Y Y Y Y Y Y Y 9 9 N HN
Lady -
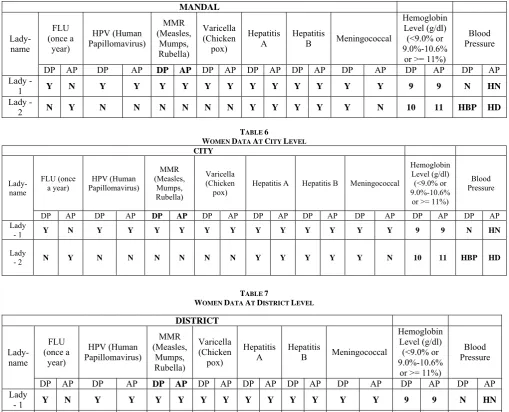
TABLE 5
WOMEN DATA AT MANDAL LEVEL
TABLE 6
WOMEN DATA AT CITY LEVEL
CITY
Lady-name
FLU (once
a year) Papillomavirus)HPV (Human
MMR (Measles, Mumps, Rubella) Varicella (Chicken
pox) Hepatitis A Hepatitis B Meningococcal
Hemoglobin Level (g/dl) (<9.0% or 9.0%-10.6%
or >= 11%)
Blood Pressure
DP AP DP AP DP AP DP AP DP AP DP AP DP AP DP AP DP AP
Lady
- 1 Y N Y Y Y Y Y Y Y Y Y Y Y Y 9 9 N HN
Lady
- 2 N Y N N N N N N Y Y Y Y Y N 10 11 HBP HD
TABLE 7
WOMEN DATA AT DISTRICT LEVEL
The data sets of 1000 Infants and 1000 women at each grid level are collected and Weka Toolbox, Scikit learn library and python are used.
The three methods for performance evaluation of the regression methods are used. To evaluate the prediction performance of each method, mean absolute error (MAE), mean square error (MSE) and correlation coefficients (R) are employed as follows: Where yt is the actual sample
value and ỹt is expected sample value, n is the total number of sample, SSE is error sum of squares and SST is the total corrected sum of squares [4][5][6][7][8].
The proposed GWSVM is efficient compared to Decision tree based approach, and SVM (support vector machine) based approach as shown in the Tables 8 and Table 9 below both for Infant data and women data.
TABLE 8
RESULTS FOR INFANT DATA
Method MAE MSE R
SVM 7.5 09.82 0.45
Decision tree 8.9 10.6 0.41
GWSVM 6.4 7.36 0.55
TABLE 9
RESULTS FOR WOMEN DATA
MANDAL Lady-name FLU (once a year) HPV (Human Papillomavirus) MMR (Measles, Mumps, Rubella) Varicella (Chicken pox) Hepatitis
A Hepatitis B Meningococcal
Hemoglobin Level (g/dl) (<9.0% or 9.0%-10.6%
or >= 11%)
Blood Pressure
DP AP DP AP DP AP DP AP DP AP DP AP DP AP DP AP DP AP
Lady -
1 Y N Y Y Y Y Y Y Y Y Y Y Y Y 9 9 N HN
Lady -
2 N Y N N N N N N Y Y Y Y Y N 10 11 HBP HD
DISTRICT Lady-name FLU (once a year) HPV (Human Papillomavirus) MMR (Measles, Mumps, Rubella) Varicella (Chicken pox) Hepatitis A Hepatitis B Meningococcal Hemoglobin Level (g/dl) (<9.0% or 9.0%-10.6%
or >= 11%)
Blood Pressure
DP AP DP AP DP AP DP AP DP AP DP AP DP AP DP AP DP AP
Lady
- 1 Y N Y Y Y Y Y Y Y Y Y Y Y Y 9 9 N HN
Lady
- 2 N Y N N N N N N Y Y Y Y Y N 10 11 HBP HD
Method MAE MSE R
SVM 5.9 07.31 0.54
Decision Tree 7.1 9.54 0.47
VI. CONCLUSIONS
The proposed GWSVM algorithm is compared with Decision Tree and SVM algorithms and shown that proposed approach performs better as the mean absolute error (MAE), mean square error (MSE) are less compared to other approaches. This shows the optimized distributed data mining algorithm on the grid thereby predicting the disease and a doctor at the village level can take an expert advice from the specialist in the city or other places over the grid and take preventive measures in turn helping to reduce the IMR and MMR to meet the MDGs in 2015.
REFERENCES
[1] http://www.investopedia.com/terms/r/regression.ap
[2] http://en.wikipedia.org/wiki/Linear_regression
[3] http://en.wikipedia.org/wiki/Nonlinear_regression
[4] http://blogs.mathworks.com/loren/2011/01/13/data-driven-fitting/
[5] A comparative predictive analysis of neural networks (NNs),
nonlinear regression and classification and regression tree (CART) models, Muhammad A. Razi, KuriakoseAthappilly, Expert Systems with Applications Volume 29, Issue 1, July 2005, Pages 65–74
[6] Cortes, Corinna; and Vapnik, Vladimir N.; "Support-Vector
Networks", Machine Learning, 20, 1995
[7] Support Vector Regression for Censored Data (SVRc): A Novel Tool
for Survival Analysis, Khan, F.M. Zubek, V.B.;Data Mining, 2008. ICDM '08. Eighth IEEE International Conference on, Pages :863 - 868
[8] Weighted Support Vector Regression Algorithm Based on Data
Description; Weimin Huang, LepingShen;Computing, Communication, Control, and Management, 2008. CCCM '08