GENETICS | INVESTIGATION
The Effects of Background and Interference
Selection on Patterns of Genetic Variation in
Subdivided Populations
Kai Zeng1and Pádraic Corcoran
Department of Animal and Plant Sciences, University of Sheffield, Sheffield S10 2TN, United Kingdom
ABSTRACTIt is well known that most new mutations that affectfitness exert deleterious effects and that natural populations are often
composed of subpopulations (demes) connected by geneflow. To gain a better understanding of the joint effects of purifying selection and population structure, we focus on a scenario where an ancestral population splits into multiple demes and study neutral diversity patterns in regions linked to selected sites. In the background selection regime of strong selection, wefirst derive analytic equations for pairwise coalescent times andFSTas a function of time after the ancestral population splits into two demes and then construct aflexible coalescent simulator that can generate samples under complex models such as those involving multiple demes or nonconservative migration. We have carried out extensive forward simulations to show that the new methods can accurately predict diversity patterns both in the nonequilibrium phase following the split of the ancestral population and in the equilibrium between mutation, migration, drift, and selection. In the interference selection regime of many tightly linked selected sites, forward simulations provide evidence that neutral diversity patterns obtained from both the nonequilibrium and equilibrium phases may be virtually indistinguishable for models that have identical variance infitness, but are nonetheless different with respect to the number of selected sites and the strength of purifying selection. This equivalence in neutral diversity patterns suggests that data collected from subdivided populations may have limited power for differentiating among the selective pressures to which closely linked selected sites are subject.
KEYWORDSbackground selection; interference selection; population subdivision; coalescent;FST
I
T was pointed out a long time ago that most mutations that affect the phenotype must be deleterious, because the bio-logical system has been under selection for billions of years to improve its performance (e.g., Muller 1950). Evidence col-lected from both mutation accumulation experiments and analyses of large-scale DNA sequence variation is consistent with the prevalence of deleterious mutations and the relative rarity of advantageous ones (reviewed by Eyre-Walker and Keightley 2007; Halligan and Keightley 2009; Charlesworth 2012a). It is therefore unsurprising that the effects of selec-tion against deleterious mutaselec-tions are an integral part in the study of many fundamental questions in evolutionary genet-ics, such as the evolution of sex and recombination (Otto andLenormand 2002), the consequences of inbreeding and self-fertilization (Charlesworth and Charlesworth 1987), and the origin and nature of genetic variation underlying diseases (Wrightet al.2003).
An important line of research is to understand the effects of selection against recurrent deleterious mutations on pat-terns of genetic diversity at linked neutral sites. This has been extensively studied in thebackground selection regime (Charlesworth et al. 1993) in which deleterious mutations are assumed to be sufficiently strongly selected against that their frequencies stay very close to the deterministic limit expected in an infinitely large population (Kimura and Maruyama 1966; Haigh 1978). It is well established that, in a panmictic population, background selection causes a re-duction in diversity and an excess of low-frequency variants in linked neutral regions relative to neutral expectations (Charlesworthet al.1995; Hudson and Kaplan 1995; Nordborg
et al. 1996; Zeng and Charlesworth 2011; Nicolaisen and
Desai 2012, 2013), regardless of whether the population is in equilibrium or has experienced recent changes in population Copyright © 2015 by the Genetics Society of America
doi: 10.1534/genetics.115.178558
Manuscript received June 4, 2015; accepted for publication September 24, 2015; published Early Online October 2, 2015.
Supporting information is available online atwww.genetics.org/content/early/2015/ 09/30/genetics.115.178558/suppl/DC3.
size (Zeng 2013). Given the ubiquity of deleterious mutations and the fact that diversity patterns under background selec-tion can be similar to those expected in the presence of re-current selective sweeps, it has been suggested that a model incorporating selection against recurrent deleterious muta-tions may be a better null hypothesis than the standard neu-tral model in the study of genome-wide polymorphism patterns (Cutter and Payseur 2013; Comeron 2014).
The effects of background selection in a subdivided pop-ulation are less well understood. Existing knowledge is mainly based on the theoretical work of Nordborg (1997) and Charlesworth et al. (1997). Their model assumes that the population is subdivided into two demes (or subpopulations; these two terms are used interchangeably) and is in statistical equilibrium between mutation, selection, drift, and migration. Analytical equations were derived forTBandTS;the expected
coalescent time for a pair of alleles sampled either from two different demes or from the same deme, respectively. These are then used to examine how background selection af-fectsFST, the standard measure of population differentiation,
which can be defined as
FST¼
TB2TS
TB
(1)
(cf. Slatkin 1991) (for other definitions, see Charlesworth 1998 or Holsinger and Weir 2009). Under this model, the effects of background selection on pairwise coalescent times andFSTcan be approximated as a reduction in the effective
population size, denoted byNe, such that the effective
num-ber of migrants is reduced relative to neutrality, leading to an increase inFST(Charlesworthet al.1997; Nordborg 1997).
Because, all else being equal, theFST-elevating effect of
back-ground selection is expected to increase as local recombina-tion rates decrease, the fact that most species studied to date show substantial variation in recombination rate across their genomes (Smukowski and Noor 2011) implies that back-ground selection alone can generate large“genomic islands” that have significantly higher differentiation levels compared to the rest of the genome (Charlesworth 1998). Indeed, the importance of excluding background selection as a confounding factor in the search for genes underlying local adaptation and speciation, which can also lead to genomic islands (Wu 2001; Beaumont 2005), has been highlighted in recent reviews (Noor and Bennett 2009; Cruickshank and Hahn 2014).
Although the model of Nordborg (1997) and Charlesworth
et al.(1997) has provided important insights into the joint
effects of background selection and population subdivision, it has several limitations. First, the equilibrium assumption means that it is not applicable to the study of populations that consist of demes derived recently from a common ances-tral population (e.g.,Drosophila melanogasterand humans). Second, the effect of background selection is modeled as a reduction inNe. However, analyses of models with panmixia
have shown that this approximation does not capture the fact
that background selection causes an excess of low-frequency variants in the site-frequency spectrum (SFS) (Charlesworth
et al. 1995; Zeng and Charlesworth 2011; Nicolaisen and
Desai 2012, 2013). It is unclear how the SFS is affected under the joint influence of population structure and background selection. Finally, the model provides predictions about expected diversity levels for individual neutral sites. But with the ever-increasing availability of large-scale data sets, it is desirable to be able to generate predictions for statistics that make use of multiple linked sites (e.g., measures of linkage disequilibrium, the number of haplotypes), so that informa-tion in the data can be used more effectively.
In contrast to the background selection regime, the
inter-ference selection regimeconsiders models with a large number
of tightly linked selected sites (McVean and Charlesworth 2000; Comeron and Kreitman 2002). Interference selection is therefore an important factor for the study of asexual or highly self-fertilizing organisms as well as large genomic re-gions in sexually reproducing organisms that lack recombi-nation (e.g., the fourth chromosome of D. melanogaster). Models in this regime generally behave very differently from those in the background selection regime (reviewed by Neher 2013), and analytical results derived under background se-lection are typically not applicable (Kaiser and Charlesworth 2009; O’Fallon et al. 2010; Seger et al. 2010; Zeng and Charlesworth 2010). An interesting result obtained recently by
Goodet al.(2014) is that, in an equilibrium panmictic
pop-ulation, diversity patterns in linked neutral regions are de-termined by the variance infitness at the selected sites, such that models that have different parameter values (i.e., dif-ferent numbers of selected sites and selection coefficients) but nevertheless identical variance in fitness will produce indistinguishable neutral diversity patterns. This
equiva-lencebetween models implies that there is a limit to how
much neutral diversity patterns can inform us about selec-tion in their vicinity. It is of considerable interest to examine whether such a limit also exists when the population is subdivided.
In this study, we analyze models in both the background selection and interference selection regimes to address the questions raised above. In both cases, we focus on a demo-graphic scenario where a panmictic ancestral population splits into multiple demes and examine diversity patterns for a period starting from the nonequilibrium phase immediately after the split, until the establishment of a new equilibrium. For the background selection regime, wefirst derive analytical results for bothTBandTSas a function of time since the split
in subdivided populations, we present forward simulation results. Specifically, we consider models that have different parameter values but identical variance infitness in the pan-mictic ancestral population and ask whether they also have similar neutral diversity patterns following the emergence of population structure.
The Model
Our analysis in both the background selection and inter-ference selection regimes is concerned with a haploid population with a diploid phase in the life cycle where recombination may take place (e.g., Zeng and Charlesworth 2011). Forward in time, the model initially contains a single panmictic ancestral population, which later splits instantly intoKdemes (K$2). Definetas the number of generations before the present and letT represent the time when the ancestral population gave rise to the demes (T$1). The size of the ancestral population is denoted by N0(t) (t . T),
whereas the sizes of the demes are denoted byNk(t) (k=
1, 2,. . .,K). In each generation, a proportionmkl(t) of
indi-viduals in demekare immigrants from demel(k6¼l). We focus on a genomic region withSlinked selected sites. New mutations arise at theith selected at rateuiper generation.
Mutation is unidirectional, from ancestral (the wild type) to derived (deleterious). The fitness of an individual with a mutation at theith site is reduced by a fraction 1–si
(mul-tiplicativefitness), wheresiis the selection coefficient.
Mu-tations are assumed to accumulate in a similar manner at the neutral sites in the region.
We can describe the life cycle, using the parameters defined above. An individual in the next generation in demekis a migrant from deme l(l6¼k) with probabilitymkl(t). A
mi-grant is created from a parent or a pair of parents in the deme of origin, depending on whether recombination occurs; oth-erwise, it is created from parent(s) in the current deme. Par-ents are chosen according to their relativefitnesses within the deme of their origin. The number of new deleterious muta-tions arising in each chromosome is Poisson distributed with mean U=Sui; neutral mutations are added similarly. The
number of crossovers between two parental chromosomes is Poisson distributed with meanR, whereRis the total genetic distance between the two ends of the genomic region of in-terest. This life cycle corresponds to fertility selection among adults, followed by reproduction and juvenile migration.
Approximations in the Background Selection Regime
In this section, we derive analytical results and construct a coalescent simulator, assuming that purifying selection is
suf-ficiently strong that the frequencies of deleterious mutations are maintained close to their deterministic limit (i.e.,ui/siat
theith selected site), which requiresNk(t)si1 anduisi
(i= 1, 2,. . .,Sandk= 0, 1,. . .,K) (seeResultsfor more discussion on the condition under which the approxima-tions are expected to be valid).
Recursion equations for a two-deme model
Assume that the ancestral population split intoK= 2 demes at time T in the past. We focus on a single neutral site embedded in a genomic region withSlinked selected sites. We seek tofind the effects of selection at the selected sites on the distribution of coalescent times at the neutral site. The restrictive assumptions set out here are later relaxed to allow multiple neutral sites and more than two demes when the coalescent simulator is constructed. We refer to the single neutral site as the focal site. The genetic distance between the focal site and theith selected site is denoted byri.
First, consider the panmictic ancestral population. With strong selection, it has been shown that the selected sites behave approximately independently (Hudson and Kaplan 1995; Johnson 1999; Nicolaisen and Desai 2013). This prop-erty can be used to derive the effective population size in the presence of background selection backward in time. Specifi -cally, if we follow the ancestry of a chromosome sampled from the present-day population, the number of deleterious mutations linked to the focal site changes because of muta-tion and recombinamuta-tion (e.g.,figure 2 of Zeng 2013). LetP(Di,t)
be the probability that, at timetin the past, the focal site in an ancestral lineage (chromosome) had variant Diat selected
sitei, whereDi= 0 or 1 depending on whether the wild type
or the mutant type occurs at the site. Nicolaisen and Desai (2013) have shown that
PðDi¼1;tÞ ¼12PðDi¼0;tÞ
¼li
ri
riþsi
þ si
riþsi
e2ðriþsiÞt
; (2)
where li = ui/si. The statistical independence between
selected sites suggests that the joint probability that an ancestral lineage carried variants Di (i = 1, 2, . . ., S)
t generations ago, denoted by PðD1;D2;. . .;DS;tÞ;can be
calculated as
PðD1;D2;. . .;DS;tÞ ¼
YS
i¼1
PðDi;tÞ: (3)
Note that, whenuisi, the random variableDiis
approxi-mately Poisson distributed with meanliat timet= 0. Thus, PiP(Di, 0) is equivalent to the well-known result that the
number of deleterious mutations that a randomly sampled chromosome carries follows a Poisson distribution with mean
l=Pili(Johnson 1999).
Two ancestral lineages in the ancestry of a sample can coalesce only when they are in the samegenetic background (i.e., having exactly the same set of variants at the selected sites) (Hudson and Kaplan 1995; Zeng and Charlesworth 2011), which occurs with probability PðD1;D2;. . .;DS;tÞ2: When this happens, the two lineages coalesce with probabil-ity 1/Ngb(t), where Ngb(t) is the total number of
that, with strong selection, the selected sites remain ap-proximately independent and the frequencies of mutants remain close to ui/si, even in the presence of changes
in the population size (Zeng 2013), suggesting that NgbðtÞ ¼N0ðtÞPiPðDi;0Þ ¼N0ðtÞPðD1;D2;. . .;DS;0Þ:Finally, the probability that a pair of ancestral chromosomes coalesce at timet,Pc(t), can be interpreted as 1/Ne0(t), whereNe0(t) is
the effective population size of the ancestral population. Put together, we arrive at the result of Nicolaisen and Desai (2013):
PcðtÞ ¼ 1 Ne0ðtÞ
¼ P
fAll possible combinations of values of D1;D2;...; and DSg
PðD1;D2;. . .;DS;tÞ2 N0ðtÞPðD1;D2;. . .;DS;0Þ
¼ 1
N0ðtÞ YS
i¼1
"
PðDi¼1;tÞ2
PðDi¼1;0Þþ
PðDi¼0;tÞ2
PðDi¼0;0Þ #
1
N0ðtÞ exp
( XS
i¼1
li
si
riþsi
12e2ðriþsiÞt
2) :
(4)
Rearranging Equation 4, the effective population size at timet is approximately
Ne0ðtÞ ¼exp
2PS
i¼1
li
si riþsi
12e2ðriþsiÞt
2
N0ðtÞ
¼BðtÞN0ðtÞ:
(5)
Lettingtapproach infinity, we obtain
Ne0ðNÞ ¼exp
(
2XS
i¼1
li
si
riþsi
2)
N0ðtÞ ¼CN0ðtÞ; (6)
which is the classic result derived by Hudson and Kaplan (1995) and Nordborg et al. (1996) (C = limt/NB(t)). In other words, the classic result approximates the effects of background selection by using a neutral model with a re-duced Neand therefore does not predict that the shape of
the SFS should deviate from neutral expectations. In con-trast, Equation 5 shows that Ne0(0) =N0(0) andNe0(t)
declines as time proceeds backward (see Supporting
Information,Figure S1). Put differently, forward in time,
Equation 5 approximates the effects of background selection by using a neutral model with a growing population size, which explains the characteristic excess of low-frequency variants (Charlesworthet al.1995; Zeng and Charlesworth 2011; Nicolaisen and Desai 2013). Hence, we expect Equa-tion 5 to provide better approximaEqua-tions when there is a significant chance for coalescent events to occur at a stage whereNe0(t) differs substantially fromNe0(N) (e.g., when
the sample size is large;Figure S1).
When the ancestral population splits, because the juvenile populations of the two demes that exist before migration are propagated in the same way as a new generation is created in the ancestral population, the dynamics (backward in time) of
a chromosome sampled randomly from either deme are de-termined by Equation 3. Therefore, we can use Equation 5 to model the coalescent process for a sample of chromosomes. For a chromosome sampled from demekafter migration, it originates from the juvenile population of either demekor demelwith probability 1–mklandmkl, respectively
(assum-ing, for simplicity, that the migration rate is constant over time). In this case, Equation 3 can still be employed to de-termine the distribution of variants at the linked selected sites because PðD1;D2;. . .;DS;tÞ= [1–mkl]PiP(Di,t) + mklPiP
(Di,t) = PiP(Di,t). The same heuristic argument can be
used to show that Equation 3 is approximately true for any generation after the split. In other words, the popula-tion structure introduced by the split does not change the frequency of the mutant variant at each selected site (see also Maruyama 1972), nor does it affect the statistical in-dependence between selected sites. Therefore, the proba-bility that two ancestral chromosomes coalesce in demekat timetbefore the present is given by Equation 4 withN0(t)
replaced by Nk(t). Thus, the effective population size of
demek(k= 1, 2) under the influence of background selec-tion can be modeled as
NekðtÞ ¼BðtÞNkðtÞ: (7)
Equations 5 and 7 suggest that the effects of background selection on diversity patterns at the focal site can be approx-imated by neutral models with time-dependent population (deme) sizes. Thus, we can derive recursion equations to describe the coalescent process, using the neutral framework developed by Teshima and Tajima (2002). As is the case for most coalescent models (Hudson 1990), we assume the pop-ulation (deme) sizes [i.e.,Nek(t)] to be sufficiently large and
the migration rates [i.e.,mkl(t)] to be sufficiently small that
the chances of the following events occurring are negligible: (1) a coalescent event involving more than two ancestral lineages, (2) more than one coalescent event happening in a generation, and (3) an individual migrating multiple times in a generation.
First, consider the ancestral population. The probability that there arenancestral lineages at timet,Qn(t), satisfies
QnðtÞ ¼Qnðt21Þ 12
n 2
Ne0ðtÞ
0 B B @
1 C C
AþQnþ1ðt21Þ
nþ1
2
Ne0ðtÞ
(8)
fort.T, with the initial conditionQn(T) = 1, ifnis equal to
the number of ancestral lineages at timeT, and 0 otherwise. The first term on the right-hand side describes a scenario where thenlineages at timet–1 persist to timetdue to a lack of coalescence, whereas the second term considers the possibility of a coalescent event at timet, reducing the num-ber of lineages fromn+ 1 ton.
the probability that there areaandn–aancestral lineages in demes 1 and 2, respectively, at timet[(a,n–a) is referred to as a sampling configuration], and (2)Ma,b(t|n), the
proba-bility that migration changes the sampling configuration from (a,n–a) to (b,n–b).
Using Equation 7, we can modify the result of Teshima and Tajima (2002), so that it takes into account the effects of background selection on the coalescent process at the focal site,
Qa;n2aðtÞ
¼X
n
b¼0
Qb;n2bðt21ÞMb;aðt21jnÞ 12
a
2 !
Ne1ðtÞ2
n2a
2
Ne2ðtÞ
0 B B B @
1 C C C A 0
B B B B @
1 C C C C A
þ Xnþ1 b¼0
Qb;nþ12bðt21ÞMb;aþ1ðt21jnþ1Þ
aþ1
2 !
Ne1ðtÞ
þ X nþ1
b¼0
Qb;nþ12bðt21ÞMb;aðt21jnþ1Þ
nþ12a
2 !
Ne2ðtÞ ;
(9)
where
Ma;bðtjnÞ ¼
X minða;n2bÞ
c¼maxð0;a2bÞ
a c
n2a
b2aþc
m12ðtÞcm21ðtÞb2aþc
3 12m12ðtÞ a2c
12m21ðtÞ n2b2c
:
(10)
The three terms on the right-hand side of Equation 9 describe the following events, respectively: (1) There is no coalescence in either deme and migration changes the sampling confi gu-ration from (b,n–b) at timet–1 to (a,n–a) at timet; (2) migration changes the sampling configuration from (b,n+ 1
–b) to (a+ 1,n–a), followed by a coalescent event in deme
1, leading to (a,n–a); (3) migration changes the sampling configuration from (b,n+ 1–b) to (a,n+ 1–a), followed by a coalescent event in deme 2, leading to (a,n–a). Equation 10 is the same as the corresponding equation on p. 83 of Teshima and Tajima (2002) and can be derived by noting that the number of migrants among the achromosomes in deme 1 follows a binomial distribution with parametersaand m12(t), and that in deme 2 is also binomially distributed with
parametersn–aandm21(t).
Assume that a0 and b0 chromosomes are sampled
ran-domly att= 0 (the present) from demes 1 and 2, respectively. Appealing to Equations 8 and 9, we can calculatef(n,t | a0,
b0), the probability that the number of ancestral lineages
reduces fromnton–1 at timetgiven the initial sampling configuration (a0,b0), as
fðn;tja0;b0Þ ¼
Xn
a¼0
Qa;n2aðt21Þ
"
a2 !
Ne1ðtÞþ n2a
2 !
Ne2ðtÞ
#
; 1#t#T
Qnðt21Þ
n
2 !
Ne0ðtÞ; t.T;
8 > > > > > > > > > > > > < > > > > > > > > > > > > :
(11)
with the initial condition thatQa,b(0) = 1, ifa=a0andb=b0,
and 0 otherwise. Following Teshima and Tajima (2002), we have dropped terms of order 1/[Nek(t)]2or higher in
Equa-tion 11, which include events such as migraEqua-tion followed by coalescence in the same generation or a coalescent event in-volving more than two ancestral lineages. Equation 11 can be solved numerically to obtain properties of the coalescent pro-cess at the focal site under the joint influence of background selection and population subdivision. For a two-deme model (K= 2), the complexity of the recursion equation, measured by the number ofQa,b(t) for a givent, is (n+ 4)(n–1)/2 for a
sample of size n. Moreover,f(a,t | a0,b0), where a ,n,
depends on allf(b,t | a0,b0), wherea,b#n. Thus,
eval-uating the recursion equation becomes complex even for a modestn. In this case, conducting coalescent simulations is a more efficient alternative (see below).
The theory developed above can be used to calculateTB
andTS;and henceFST(Equation 1), as a function ofT, the
time since the split of the ancestral population. We need only to consider a sample of size 2, for which there are three possible sampling configurations att= 0: (a0, b0)2 fð0;2Þ;ð1;1Þ;ð2;0ÞgEquation 11 becomes
fð2;tja0;b0Þ
¼
Q0;2ðt21Þ 1
BðtÞN2ðtÞþQ2;0ðt21Þ
1
BðtÞN1ðtÞ; 1#t#T
Q2ðt21Þ
1
BðtÞN0ðtÞ; t.T:
8 > > > > < > > > > :
(12)
TBandTScan be expressed in terms off(2,t|a0,b0) as
TB¼
XN
t¼1
tfð2;tj1;1Þ
TS¼
1 2 "
XN
t¼1
tfð2;tj0;2Þ þX
N
t¼1
tfð2;tj2;0Þ
# : 8
> > > > > < > > > > > :
(13)
It is possible to weigh the contribution of the demes differently in the definition ofTS(e.g., Hudsonet al.1992). Our choice is
partly for simplicity and partly because we used models with two equal-sized demes in most of our simulations.
We illustrate the calculation ofTBandTS;using a model
whereN0(t)[aN,N1(t)[c1N,N2(t)[c2N,m12(t)[m12,
and m21(t)[ m21. The migration probabilities Ma,b(t | 2)
A matrix Mwith elementsMa,b (0#a,b#2) can be
defined as
M¼ 0 B B @
ð12m21Þ2 2m
21ð12m21Þ m221 m12ð12m21Þ ð12m12Þð12m21Þ þm12m21 ð12m12Þm21
m212 2m12ð12m12Þ ð12m12Þ2
1 C C A:
(14)
Equation 9 reduces to
Q0;2ðtÞ ¼Q0;2ðt21ÞM0;0þQ1;1ðt21ÞM1;0þQ2;0ðt21ÞM2;0
3 12 1
c2NBðtÞ
Q1;1ðtÞ ¼Q0;2ðt21ÞM0;1þQ1;1ðt21ÞM1;1þQ2;0ðt21ÞM2;1
Q2;0ðtÞ ¼
Q0;2ðt21ÞM0;2þQ1;1ðt21ÞM1;2þQ2;0ðt21ÞM2;2
3
12 1
c1NBðtÞ
;
8 > > > > > > > > > > > > > > > < > > > > > > > > > > > > > > > :
(15)
which can be iterated numerically by using the initial condi-tionQa,b(0) = 1, ifa=a0andb=b0, and 0 otherwise. The
values ofQa,b(t) can then be fed into Equation 12 to obtainf
(2,t|a0,b0), which can in turn be used to evaluate Equation 13.
The fast approximation for a two-deme model
It is possible to obtain explicit analytical formulas for predict-ing TBandTS at the focal site by making an additional
as-sumption: If thas become sufficiently large when the two ancestral lineages coalesce thatB(t)C(seeFigure S1), then the effects of background selection on the coalescent process can be well approximated by a neutral model with appropri-ately reduced population (deme) sizes. This is based on the
fast approximationproposed by Nordborg (1997). It requires
that the rate at which the two chromosomes of interest coa-lesce is much slower than changes in the distribution of var-iants at the linked selected sites (governed by Equation 3).
Consider, as an example, a special case of the model that leads to Equations 14 and 15 in whichN0(t)[aN,N1(t)[
N2(t)[N, andm12(t)[m21(t)[m. Under the fast
approx-imation, the effects of background selection can be approxi-mated by a neutral model in which an ancestral population of sizeaCNgave rise to two demes of sizeCNin generationT before the present, with migration rates m12 =m21= m.
Thus, we can apply theoretical results derived for this neutral
“isolation with migration”model (Nath and Griffiths 1993; Wakeley 1996; Teshima and Tajima 2002; Wilkinson-Herbots 2008). Following Wilkinson-Herbots (2008; see section 3.1 therein), we scale time in units ofCNgenerations and define
te=T/(CN),tB=TB=ðCNÞ;tS=TS=ðCNÞ;Me=CNm,D =
(16Me)2+ 1, and
l6¼4Meþ16 ffiffiffiffi D
p
2 : (16)
The background selection-aware versions of equations 22 and 23 of Wilkinson-Herbots (2008) can be written as
tB¼2þ
1 2Me
þ 1ffiffiffiffi
D p lþ
a2 1
l2
e2l2te2l
2
a21
lþ
e2lþte
tS¼2þ
1 ffiffiffiffi
D p
ðlþ21Þ
a2 1
l2
e2l2teþ ð12l
2Þ
a2 1
lþ
e2lþte
:
8 > > > < > > > :
(17)
Lettingtego to infinity, we recover the well-known result for
a symmetric two-deme model (Nordborg 1997):
tB¼2þ 1 2Me;
tS¼2; FST¼ 1
4Meþ1: (18)
That is, the effects of background selection onFSTare
equiv-alent to a reduction in the scaled migration rate fromM=Nm in the absence of recurrent deleterious mutations at linked sites toMein the present model. As a result,FSTis increased
under background selection relative to neutrality (Charlesworth
et al.1997).
The coalescent simulator
The two approximations developed above consider a single neutral site embedded in a genomic region withSselected sites. Here we relax this restriction by extending the coales-cent model of Zeng and Charlesworth (2011; Zeng 2013). This extension relies on a similar set of assumptions used to obtain the recursion equations. We demonstrate the key fea-tures of the coalescent process by focusing on the following case: (1) a genomic region withLsites, all of which are sub-ject to purifying selection (i.e.,L=S); (2) the selection co-efficients, the mutation rateu, and the recombination rater are all constant across sites; and (3) the population is in equilibrium and consists of two demes of sizeN, connected by symmetric migration occurring at ratemper generation. Thus, the total mutation and recombination rates for the re-gion concerned are U =uL and R =rL, respectively. The number of deleterious variants a randomly sampled chromo-some carries is Poisson distributed with meanl=U/s. Time, denoted by t, is scaled in units ofNgenerations, witht = 0 representing the present. The dynamics of the coalescent are determined by the following scaled parameters:g=Ns,
r=Nr, andM=Nm. Specifically, to generate a random
gene-alogy for a sample ofnchromosomes, wefirst determine the number of deleterious mutations that each chromosome car-ries att= 0, which can be done by sampling from Poisson(l). Backward in time, four types of events can occur: mutation (loss of deleterious mutation), recombination, migration, and coalescent. Under the assumptions of the model, these events constitute four independent, competing Poisson processes with ratesmm,mr,mmig, andmc, respectively. The
time to the next event can be determined by sampling from an exponential distribution with ratem=mm+mr+mmig+mc.
Then, the probability that this event is a mutation event is equal tomm/m, proportional to its contribution tom; the same
applies to the other events.
The rate at which a deleterious mutation is lost isg. There-fore,mm=igwhen there are in totalimutations among all
mutation event, one of theimutations is chosen at random for removal. The rates to the next migration or recombination events aremmig=nMandmr=nrL, respectively. When
mi-gration happens, a randomly chosen chromosome is moved to the other deme. For a recombination event, we pick one chromosome at random and split it into two ancestral chro-mosomes. In this process, the deleterious mutations origi-nally carried by the affected chromosome are randomly distributed to the two ancestral chromosomes, using the al-gorithm of Zeng and Charlesworth (2011). This redistribu-tion of mutaredistribu-tions during recombinaredistribu-tion affects the coalescent probability between lineages in the coalescent process and is
a major feature that distinguishes the current method from that of Hudson and Kaplan (1995).
The calculation of the total coalescent rate is the most time-consuming, because it requires conducting pairwise compar-isons for all chromosomes existing at the time, which in turn involves examining whether the physical distributions of the deleterious mutations carried by each pair of chromosomes (determined by the mutation and recombination events that have affected them thus far) are compatible (i.e., whether it is possible for them to have been born to the same parent) and, if so, the physical distribution of these mutations in the an-cestral chromosome into which these two chromosomes may
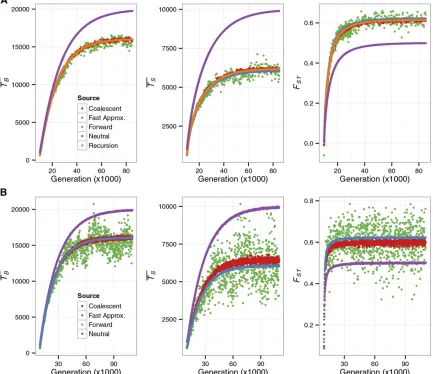
Figure 1 Pairwise coalescent times andFSTas a function of time since an ancestral population splits into multiple demes. The forward simulation began
with an ancestral population of size 1000 with no mutation. It was then allowed to evolve for 104generations when it gave rise to 2 demes of size 5000
(A) or 10 demes of size 1000 (B). The size of the simulated region wasL= 2500 (A) andL= 750 (B). In both cases, the sites in the simulated region were
completely linked and all mutations were deleterious. The mutation rate per site per generationuwas 231026(A) and 1025(B). The selection
coefficientswas set to 0.01 (A) and 0.015 (B). In both models, migration was symmetrical with ratem = mkl= 531025per generation (k6¼l). With
these parameters,n0s= 6.065 and 9.098 for A and B, respectively. For each time point after the split,TB(in generations),TS(in generations), andFST
were obtained using the following methods: the recursion (Equation 13, for A only), the fast approximation (Equation 17 for A), the coalescent simulator
(104replicates), and the forward simulator (500 replicates). In A, the recursion and the fast approximation produce very similar results forT
B;and
therefore only one of the two curves is visible. In B, the fast approximation results were obtained by conducting neutral simulations with the sizes of the
ancestral population and the demes reduced toCN= 606.531. For comparison, predictions based on neutral models with no linked selected sites were
merge (similar to the arguments leading to Equation 4; for details, see Zeng and Charlesworth 2011 and Zeng 2013). Let
mcijbe the coalescent rate between chromosomesiandj(see
equation 11 of Zeng and Charlesworth 2011). Then mc=
P
mcijfor alli6¼j(mcij= 0 if the two chromosomes in a pair
are from different demes and/or the physical locations of deleterious mutations mean that they could not have descended from the same parent in the previous generation). Given that the next event is a coalescent, we sampleiandj from a distribution with probability densitymcij/mcand merge
them into their corresponding ancestral chromosome. Introducing neutral regions into the coalescent model is straightforward, because their effects on the coalescent pro-cess are equivalent to increasing the recombination rates between selected sites. It is also possible to accommodate multiple selection coefficients, variation in recombination rate, changes in population size, multiple demes, asymmet-rical migration rates, and merging and splitting of popula-tions. We present data obtained from some of these more complex models inResults.
Simulation Methods
We used forward simulations to (1) test the validity of the three approximations that we have developed in the back-ground selection regime and (2) study neutral diversity pat-terns in the interference selection regime. In addition toTB
andTS;we also considered the following summary statistics:
(1) the site-frequency spectrum; (2) T, the total branch length; and (3)E, the ratio of the sum of all external branches (i.e., those leading to the sampled chromosomes) toT.E(T) is proportional to the expected number of segregating sites in the sample, andE(E) is the expected proportion of singletons (i.e., polymorphic sites where the derived allele appears only once). All statistics were calculated using data from neutral sites in the simulated region.
Forward simulation
The algorithm, implemented in a Java package named Forwards, is an extended version of that used by Zeng and Charlesworth (2010, 2011). It is based on the life cycle de-scribed above. In all cases, we initialized the simulation with a panmictic population of sizeN0that was free of deleterious
mutations. This population was allowed to evolve for at least 10N0generations to reach statistical equilibrium before
split-ting into multiple demes. Because forward simulations are computationally expensive, we usedN0= 1000 in most cases
and kept track of the local genealogies at only a handful of sites across the simulated region. The results reported below were typically based on 100 replicates of simulations.
Coalescent simulation
The coalescent simulator has been implemented in a computer program calledmsbgs. This program is based onms(Hudson
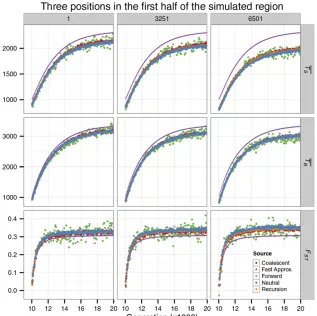
Figure 2 Pairwise coalescent times and FSTunder a
model with recombination, two types of selected sites, and nonconservative migration. The forward simulation began with an ancestral population of size 1000 with
no mutation. After 104generations it split into two
subpopulations, with deme 1 of sizeN1= 1000 and
deme 2 of size N2= 3000. Shown are the pairwise
coalescent times andFST as a function of time after
the split. The migration rate from deme 1 to deme 2
wasm12= 1024per generation and that in the other
direction wasm21= 531024per generation. A 13-kb
region was simulated and was composed of twofl
ank-ing neutral regions of 5 kb and a central selected region of 3 kb. The selected region was composed of a
se-quence of triplets. Mutations arising at thefirst two sites
of a triplet were deleterious with selection coefficients
s1= 0.01 ands2= 0.03, respectively, whereas mutations
arising at the third site were neutral. The site per-generation rates of mutation and recombination were
u= 231026andr= 1026, respectively. Because the
simulated region is symmetrical, only data from the left
end (position 1), thefirst quartile point (position 3251),
and the midpoint (position 6501) are shown. We
con-ducted 500 replicates of forward simulation and 104
replicates of coalescent simulation. To obtain results using the fast approximation, simulations were con-ducted for the three sites, using neutral models with the population (deme) sizes reduced by
C = 0.89, 0.84, and 0.79, respectively. Note that
2002). To improve efficiency, efforts have been spent on en-hancing the memory management algorithm and eliminating unnecessary comparisons between ancestral chromosomes when calculatingmc. A small-scale comparison suggests that
msbgs, written in C, is up to two orders of magnitude more efficient than a previous nonoptimized implementation and is often comparable tomsin speed (data not shown). The data presented below were typically based on 104replicates
of simulations.
Data availability
User-friendly versions of the computer programs used in this study have been made available at http://zeng-lab.group.
shef.ac.uk.
Result
The accuracy of the approximation methods in predicting pairwise coalescent times and FSTunder background selection
We assess the accuracy of the three new methods [the re-cursion (Equation 13), the fast approximation (Equation 17), and the coalescent simulator] by comparing their predictions to results obtained from forward simulations. In addition, we are interested in determining the condition under which the approximations are expected to perform well. Previous anal-ysis of the behavior of Muller’s ratchet in randomly mating populations of constant size N without recombination has found that the ratchet is unlikely to click when n0s 1,
where n0is the number of individuals in the mutation-free
class [i.e.,NPiP(Di= 0, 0)] (Gordo et al.2002; Jain 2008;
Neher and Shraiman 2012). More generally, n0 can be
expressed asCN, so that it can accommodate recombination and variation in selection coefficients. In the special case where the total deleterious mutation rate isU, the selection coefficient is s, and the total recombination rate is R, CN reduces toNe2U/(s+R/2)(Nicolaisen and Desai 2013). Thus,
we examine whethern0s1 is also a good indicator of the
validity of the new approximations. Specifically, for the rest of this study, we definen0asCNmin, whereNminis the smallest
population size among all the demes and the ancestral pop-ulation in a particular model.
We begin with cases without recombination. Figure 1, A and B, is based on models where the ancestral population splits into 2 and 10 equal-sized demes, respectively. For the 10-deme case, we conducted neutral simulations in which the population (deme) sizes were reduced by a fraction of C, equivalent to the fast approximation. The analytical equa-tions and the coalescent simulator capture the effects of back-ground selection on the two pairwise coalescent times (TB
andTS) andFSTwell. There is little difference in performance
between the three approximations during both the nonequi-librium phase after the split of the ancestral population and the equilibrium phase. This suggests that the effects of back-ground selection on these three measures of diversity can be well summarized by a reduction inNe, as assumed by the fast
approximation. This is not surprising because the pairwise coalescent times are typically long compared to the time it takes forB(t) (Equation 5) to converge toC(Nicolaisen and Desai 2012, 2013). It therefore explains the observation that TBobtained under the fast approximation and the recursion is
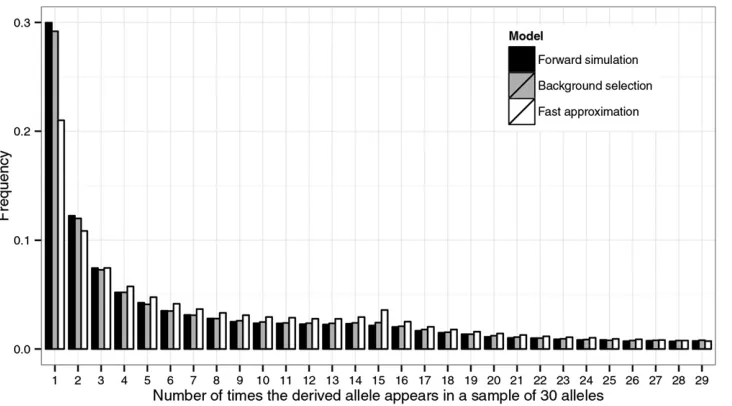
always very similar, whereas TS; which is typically much Figure 3 Site-frequency spectrum in an equilibrium model with background selection and population subdivision. A
finite-island model with two equal-sized
demes and symmetrical migration rates was simulated. The region had the same structure as the selected region used in
Figure 2 (i.e., 3000 sites composed of
triplets). Let N be the deme size. We
used the following scaled parameters in the coalescent simulations with
background selection (105 replicates):
g1 = Ns1 = 10, g2 = Ns2 = 30, u =
Nu= 0.01,r=Nr =0.005, andM=
Nm= 0.75, where the definitions ofs1,
s2,u, andrare the same as in Figure 2,
andmkl[mfor"k6¼l. Under
neutral-ity (i.e., without any selection at linked
sites), the value of M leads to FST =
0.25. In the forward simulations, the an-cestral population and the demes all had
N= 1000 individuals (the use of this relatively smallNin the forward simulations may partly explain the slight excess of low-frequency variants relative to those
predicted by the coalescent model with background selection; data not shown). To sample from equilibrium, we let the population evolve for 14Ngenerations
after the split and then sampled every 4Ngenerations until 104samples were taken. A total of 30 alleles were sampled, with each deme contributing 15. The
spectra at site 1500, the midpoint, were estimated. Given these parameters, at the midpoint,C= 0.43 andn0s1= 4.33. The fast approximation, therefore, is
equivalent to a neutral model with two equal-sized demes and an effective migration rateMe=CM. Each spectrum was normalized so that the heights of its
smaller, can be substantially different in some cases (Figure S2,
Figure S3, andFigure S4). Compared toTBandTS;FST
con-verges to its new equilibrium value at a much faster rate (Figure 1 and Figure 2;Figure S2,Figure S3, andFigure S4). Additional comparisons also suggest thatFSTpatterns obtained
from models with different parameter values are often more similar to each other than whenTBandTSare compared (data
not shown). These results imply thatFSTmay be less
informa-tive about ancestral events than other aspects of the data [e.g.,
pB(between-deme diversity) andpS(within-deme diversity),
which are proportional toTBandTS;respectively].
Based on a large number of parameter combinations (e.g.,
Figure S2,Figure S3, andFigure S4), wefind that the three
methods generally provide fairly accurate predictions when n0sU5. Whenn0s,1, all three deviate significantly from
the forward simulations, with TB always being
overesti-mated, but there is no consistent pattern regarding their abil-ities in predictingTS:Withn0s, 1, the recursion and the
coalescent simulator tend to provideFSTpredictions that are
closer to the forward simulation results.
In Figure 2, we consider a model with recombination, two types of selected sites that are subject to different intensities of purifying selection, and nonconservative migration be-tween the two demes (i.e.,N1m126¼N2m21). Because
Equa-tion 17, which requires symmetric migraEqua-tion, no longer applies, fast approximation results were obtained by simulat-ing a neutral model with reduced deme sizes. Background selection depresses both TBandTS;with the effects on the
latter being more pronounced. The net effect is an elevation of FST. This phenomenon is strongest in the center of the
selected region (position 6501 in Figure 2) and weakens as we move farther into theflanking neutral regions (e.g., posi-tion 1 in Figure 2). Overall, the new methods agree with the forward simulations very well.
The joint effects of background selection and
population subdivision on the site-frequency spectrum
When the sample size increases, so that more coalescent events took place in the recent past whenB(t) deviates sig-nificantly fromC(Nicolaisen and Desai 2012, 2013), we ex-pect the coalescent simulator to perform better than the fast approximation. We illustrate this point, in Figure 3, using a two-deme model, by comparing the SFS obtained from for-ward simulations with those obtained from conducting coalescent simulations using either the full background se-lection model or a neutral model with the deme size reduced fromNtoCN(the fast approximation). A total of 30 alleles were sampled, with each deme contributing 15. As expected, the SFS shifts toward low-frequency variants under the infl u-ence of background selection. However, the effects on inter-mediate- and high-frequency variants seem complex. In this particular example, background selection makes the charac-teristic uptick in the middle of the SFS less visible and even causes a slight excess of high-frequency variants. Although the fast approximation fails to capture these features, predic-tions generated by the coalescent simulator are fairly accu-rate (Figure 3).
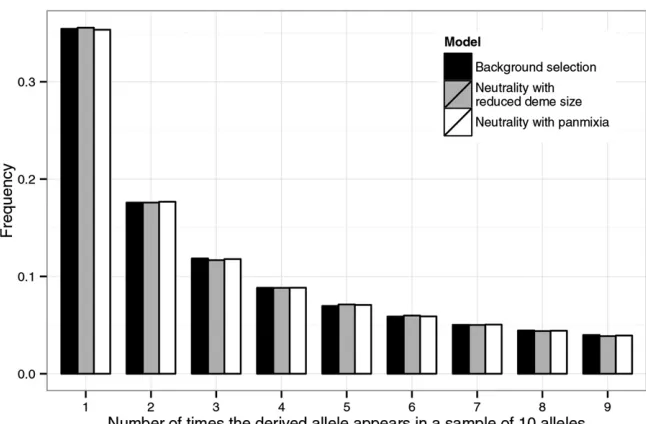
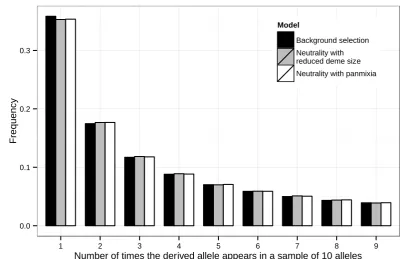
Not surprisingly, when coalescence within demes is negli-gible (which tends to occur in the more recent past), as is the case when there are many demes and only one allele is taken from each deme, background selection has little effect on the shape of the SFS (Figure 4; seeFigure S5for another exam-ple). In fact, as the number of demes Kincreases, the SFS converges to that expected under a panmictic population of constant sizeNe_large_K=CNK[1 + 1/(2CNmK)], whereNis
the deme size andm[mkl(cf. Chap. 6 of Wakeley 2008).
This “scattered”sampling scheme (reviewed in Chap. 6 of Wakeley 2008) can potentially be exploited in the analysis
Figure 4 The effects of the“scattered”sampling scheme on the site-frequency spectrum in a model with background selection and population
subdi-vision. An equilibrium finite-island model with
50 equal-sized demes and symmetrical migration rates was simulated using the coalescent simula-tor. The structure of the simulated region and the
parametersg1,g2,u,r, andCwere the same as
those used in Figure 3. The scaled migration rate
M was set to 33 1022. Under neutrality (i.e.,
without any selection at linked sites), this value
of Mleads to FST = 0.25. The sample size was
10, with each allele coming from a different deme. The spectra at site 1500 were obtained using three models: (1) the full background selection model (solid bars), (2) a neutral model with deme size
CN(the fast approximation, shaded bars), and (3)
of data from structured populations. It should, however, be noted that, due toNe_large_K’s dependency onC, the scattered
sampling scheme does not remove background selection’s influence on local diversity levels. Thus, everything else being equal, regions with more frequent recombination are expected to have more polymorphic sites (Figure S6).
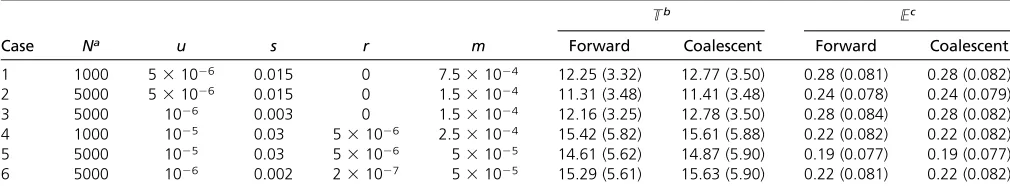
In Table 1, we further explore how diversity patterns depend on the parameters. Cases 1 and 2 have identical u,s,r(and thus, identicalC), andM(=Nm), meaning that they are equivalent under the fast approximation; the same applies to cases 4 and 5. However, forward and coalescent simulations suggest that these models have different aver-age total branch lengths (proportional to the number of segregating sites) and different average proportions of the tree accounted for by external branches (proportional to the number of singletons). In contrast, models with iden-ticalu,g,r, andMbehave in a similar manner (case 1vs. case 3; case 4vs.case 6). These data thus provide further evidence of the inaccuracy of the fast approximation. They also suggest that, although Equations 5 and 9 depend onu, s,r, andm, it is the scaled counterparts of these parameters (i.e., u, g, r, and M) that determine the behavior of the model.
Equivalence of neutral diversity patterns in the interference selection regime
We have thus far focused exclusively on cases where selection is strong (i.e.,n0s1). However, for the study of large
non-recombining genomic regions (e.g., in asexual and highly self-fertilizing organisms), it is important to explore the in-terference selection regime. In this case,U, the total delete-rious mutation rate, can become large due to tight linkage, such thatU/s1, andn0sapproaches 0. Goodet al.(2014)
have shown that, in an equilibrium panmictic population of
sizeN, neutral diversity patterns are determined by the
var-iance in fitness, denoted by s2. Specifically, for a given N,
different combinations ofUandsthat lead to the same com-posite parameterUs2will have not only the sames2, but also
indistinguishable neutral diversity patterns. Here we use
forward simulations to explore models with the sames2in
the ancestral population (which can be calculated numeri-cally using the Python package provided by Goodet al.2014) and follow their dynamics after the emergence of population structure and geneflow.
There is evidence for the existence of the equivalence between models with respect to neutral diversity patterns, both in the nonequilibrium phase following the divergence from an ancestral population and later in equilibrium. This has been observed for models withNs,1 (Figure 5) and those withNssubstantially.1 (Figure 6), as well as in the follow-ing cases: (1) models with selection coefficients and sampling schemes different from those shown in Figure 5 (Figure S7
and Figure S8), (2) selection coefficients sampling from a
distribution of fitness effects (Figure 6), (3) more than two demes (Figure 5B; Figure S9), and (4) a two-deme model with nonconservative migration (i.e.,N1m126¼ N2m21 and
m126¼ 0 andm216¼ 0;Figure S10). However, we found a
few exceptions, for instance, in a two-deme model in which only one of the migration rates is nonzero (Figure S11). In this case, for a fairly long period after the split, neutral di-versity patterns produced by the different selection models clearly overlap before they eventually diverge from one an-other, suggesting that these models could still be very hard to distinguish for a substantial amount of time.
We have also investigated the effects of the scattered sampling strategy on the SFS in the many-deme limit. Since conducting forward simulations in the presence of a large number of demes is very time-consuming, only two pairs of models have been attempted (Figure 7). Interestingly, al-though the shape of the SFS remains similar for models with the sames2in the ancestral population (i.e., models 1 and 2;
models 3 and 4), there is an excess of both low- and high-frequency variants. This U-shaped SFS, which is characteris-tic for panmiccharacteris-tic populations under interference selection (Neher and Hallatschek 2013), is markedly different from those observed in the background selection regime (cf. Figure 4), suggesting some fundamental differences between the two regimes.
Table 1 Diversity patterns under different combinations of parameters
Tb Ec
Case Na u s r m Forward Coalescent Forward Coalescent
1 1000 531026 0.015 0 7.531024 12.25 (3.32) 12.77 (3.50) 0.28 (0.081) 0.28 (0.082)
2 5000 531026 0.015 0 1.531024 11.31 (3.48) 11.41 (3.48) 0.24 (0.078) 0.24 (0.079)
3 5000 1026 0.003 0 1.531024 12.16 (3.25) 12.78 (3.50) 0.28 (0.084) 0.28 (0.082)
4 1000 1025 0.03 531026 2.531024 15.42 (5.82) 15.61 (5.88) 0.22 (0.082) 0.22 (0.082)
5 5000 1025 0.03 531026 531025 14.61 (5.62) 14.87 (5.90) 0.19 (0.077) 0.19 (0.077)
6 5000 1026 0.002 231027 531025 15.29 (5.61) 15.63 (5.90) 0.22 (0.081) 0.22 (0.082)
In all cases, an equilibrium island model with two equal-sized demes was considered. The simulated region was of lengthL= 2000 and new mutations were deleterious. A sample of 50 alleles, with each deme contributing 25, was considered for all parameter combinations. Genealogies at the midpoint of the region were recorded and were used to estimate the mean values ofTandEand their standard errors (shown in parentheses), using 500 and 105replicates of forward and coalescent simulations, respectively.
aDeme size.
bThe total branch length, in units ofNgenerations.
Discussion
Advantages and limitations of the three approximations in the background selection regime
The above analyses show thatFSTvalues at neutral sites are
expected to be higher in genomic regions that either have lower recombination frequencies (see Jackson et al. 2015 for a recent analysis inD. melanogaster) or are more tightly linked to functionally important elements (Figure 2). This heterogeneity may lead to false positives in genomic scans for outlier loci with unusually high FST(Noor and Bennett
2009; Cruickshank and Hahn 2014). A possible use of the new approximations is to generate baseline FST values in
the presence of background selection for comparison. An illustrative example is a recent study by Comeron (2014) in which, by applying analytical results developed for panmictic populations (Equation 6) to aD. melanogasterdata set, it was found that a model with background selection and recombi-nation (induced by both crossing over and gene conversion) provides a much better explanation of patterns of diversity (as measured byp, nucleotide diversity, in putatively neutral regions) than variation in recombination rates alone. Fur-thermore, Comeron (2014) identified possible targets of re-cent positive selection (i.e., loci with lower diversity levels than predicted) and balancing selection (i.e., loci with higher than expected diversity levels). From previous studies of sin-gle populations (Charlesworth 1996, 2012b; McVickeret al. 2009; Cutter and Choi 2010; Rockmanet al.2010; Flowers
et al.2012; Comeron 2014), it is clear that applying these
methods requires knowledge of the deleterious mutation rate, the distribution offitness effects of new mutations, the recombination rate (both crossover and gene conversion), and genome annotations that specify the physical locations of various functional elements. Additionally, for subdivided populations, migration rates and the time since the demes derived from the ancestral population are also needed. With the rapid accumulation of large-scale genomic resources, estimates of these parameters are becoming available to an increasingly large array of taxa (see a recent survey by Corbett-Detiget al.2015). On the other hand, by examining thefit between model predictions and observations [e.g.,pB
(between-deme diversity),pS(within-deme diversity), orFST],
the new methods may assist the estimation of some of the parameters (cf. Corbett-Detiget al.2015).
For predicting FST, the three methods behave similarly
(Figure 1 and Figure 2). Hence, the computationally more expensive coalescent simulator is probably not the method of choice. Since none of the methods are expected to work well in the interference regime, they should not be applied to genomic regions with severely restricted recombination rates. The fast approximation is the easiest to compute and can make use of known results derived for neutral models. In cases where analytical results for corresponding neutral mod-els are unavailable, neutral simulations can be employed (see Figure 2). However, becauseCvaries across putatively neu-tral sites in the presence of recombination (Equation 6), each focal site requires its own set of simulations (Figure 2), which may be computationally prohibitive. The recursion can readily
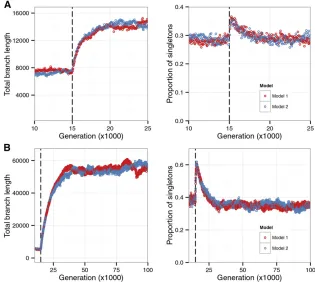
Figure 5 Equivalence in neutral diversity patterns be-tween interference selection models with the same
N0sand weak selection. In both A and B, the forward
simulation started with a single panmictic ancestral
population of sizeN0= 1000. It was allowed to evolve
for 15N0 generations (vertical dashed lines) before
splitting into demes of size 1000 that were connected by symmetrical migration. In both models, sites in the simulated region were completely linked and all mu-tations were deleterious. In A, two demes were
sim-ulated andM= 1 (i.e.,FST= 0.2 under neutrality and
no selection at linked sites), whereas in B,five demes
were included andM= 0.025 (i.e.,FST= 0.8 under
neutrality and no selection at linked sites). Parameters for the two weak selection models are, for model 1,
N0U= 20 (a 2-kb region) andg=N0s= 0.1 and, for
model 2,N0U= 80 (an 8-kb region) andg= 0.05.
Both models haveN0s= 0.396. In A, the sample size
is 25, with 5 from one deme and 20 from the other deme; in B, the sample size is 10, with two demes contributing one allele, one deme contributing two alleles, and two demes contributing three alleles. Ge-nealogies of the samples were recorded, and at each time point we calculated (based on 100 replicates) the mean values of two summary statistics, the total branch length (in generations) and the proportion of
singletons. The first statistic is proportional to the
accommodate complicating factors such as time-dependent migration rates and/or varying population sizes. (These fac-tors often defy the derivation of analytical equations under neutrality and hence the applicability of the fast approxima-tion.) For a model withKdemes, the complexity of the re-cursion, measured by the number of Qk=a,l=22a(t) (i.e., the
chance that, at timetin the past,aof the two chromosomes were in demekand the rest were in demel), isK(K+ 1)/2. Hence, it should be applicable to models with a modestK.
The coalescent simulator possesses several advantages over the other two methods. First, it is the only one that can generate large samples with multiple linked sites and can therefore be used to assess the joint impact of population structure and background selection on statistics such as the number of segregating sites, the number of haplotypes, and measures of linkage disequilibrium, which are often included in inference methods (e.g., Duchenet al.2013). Second, the coalescent simulator is the most flexible among the three with respect to incorporating biologically important factors. In addition to those presented above, it should be possible to include variation in recombination rates (Hellenthal and Stephens 2007) and gene conversion (Wiuf and Hein 2000). An important area for future research is the generation of predictions about genome-wide diversity patterns for samples containing more than two chromosomes. It is known that the standard implementation of theneutralancestral recombina-tion graph suffers from reduced efficiency when the recom-bination rate is high (e.g., as a result of simulating a very large genomic region) (Marjoram and Wall 2006; Staab et al. 2015). The efficiency and reliability of the coalescent simu-lator with background selection also decline as a function of the recombination rate (see Zeng 2013 for a method for assessing this potential problem), meaning that it is not ap-plicable to genome-level data sets. A solution proposed for the neutral case is the sequential Markov coalescent model (McVean and Cardin 2005). This approach requires that each genomic position has the same distribution of marginal geneal-ogies, which does not apply in the presence of background
selection (e.g., Figure 2) and is therefore probably not appli-cable (data collected from a small-scale experiment agree with this intuition; K. Zeng, unpublished results). Another possibility is to employ a sliding-window approach that in-volves dividing the genome intolinkage blockswhereby sites within a block are in strong linkage disequilibrium and are treated as if they were completely linked, whereas different blocks are treated as though they were unlinked (Goodet al. 2014; Weissman and Hallatschek 2014). Because the depen-dence of diversity levels on the population size under models in the background selection regime is much stronger than under the models in the interference selection regime con-sidered by Goodet al.(2014) and Weissman and Hallatschek (2014), ignoring the diversity-reducing effects of unlinked blocks on the focal block as in those previous studies is prob-ably undesirable. Fortunately, the effects of unlinked sites are known and can be modeled as a reduction inNein the focal
block (e.g., equation 4 of Charlesworth 2012a). A third pos-sibility is to carry out neutral simulations for each site, assum-ing that the effective population size at timetis determined by Equations 5 and 7 (cf. Nicolaisen and Desai 2013). How-ever, this is likely to be computationally demanding because Equations 5 and 7 vary across sites, and therefore it is neces-sary to carry out simulations for each neutral site in turn. Moreover, it cannot make predictions about patterns of link-age disequilibrium between sites, which often contain useful information about demography. In sum, the development and assessment of methods for generating genome-wide pre-dictions warrant systematic investigations in the future.
Equivalence in the interference selection regime
In contrast to the background selection regime, interference selection is induced by a large number of tightly linked selected sites (reviewed by Neher 2013). Some of the param-eters we used in the simulations may not be unrealistic for the fourth chromosome ofD. melanogaster(e.g., models 1 and 2 in Figure 6; see Kaiser and Charlesworth 2009). Our simula-tions provide evidence that, in subdivided populasimula-tions,
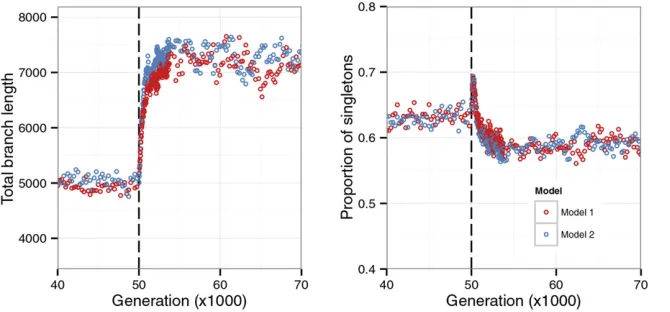
Figure 6 Equivalence in neutral diversity patterns between interference selection models with the
sameN0sand strong selection. The forward
sim-ulation started with a single panmictic ancestral
population of sizeN0= 5000. It was allowed to
evolve for 10N0generations (vertical dashed lines)
before splitting into two demes of sizeN= 5000
that were connected by symmetrical migration
with ratem= 0.0002 (i.e.,M= 1 andFST= 0.2
under neutrality and no selection at linked sites). In both models, sites in the simulated region were completely linked and all mutations were
deleteri-ous. For model 1, N0U= 711.12 (a region with
71,112 sites) andg=N0s= 15, and for model 2,
N0U= 800 (an 80-kb region) andgfollows a
uni-form distribution on [0, 24.49] such thatURs2r(s)
dsof model 2 equalsUs2of model 1, wherer(s) is
the density function of the uniform distribution. Both models haveN0s= 77.68. The sample size is 20, with 10 from each deme. The summary statistics
neutral diversity patterns obtained under models with fewer selected sites under stronger selection can be very similar to those obtained under models with more selected sites under weaker selection (e.g., Figure 5). In addition, similar diversity patterns can also be generated by models in which selection coefficients follow different distributions (e.g., Figure 6). The requirement for thisequivalenceto occur is that, assuming a common demographic scenario (defined by the size of the ancestral population, the sizes of the demes, and the migra-tion rates), the models have identical values of the compound parameter Us2; where s2 = Rs2r(s)ds, with r(s) being the
density function of the distribution offitness effects of new mutations. Thus, although not a proof, our simulations sug-gest that neutral diversity patterns collected from subdivided populations may have limited ability in differentiating differ-ent selection models in their nearby regions, asfirst pointed out by Goodet al.(2014) in their analysis of panmictic pop-ulations in equilibrium.
The above results point to the importance of further the-oretical developments to establish the precise condition under which the equivalence between models occurs. By developing a mapping between the strong and weak selection regimes,
Good et al. (2014) showed that the equivalence can be
exploited such that methods developed in the background selection regime can be used to generate predictions for mod-els in the interference selection regime. If such a mapping could be established in the presence of population subdivi-sion, then the background selection theory developed above may have application outside its intended parameter region
(see Figure S12 for an exploratory experiment).
Neverthe-less, the fact that the scattered sampling method does not alleviate the effect of selection on the SFS, as it does in the background selection regime (Figure 4vs.Figure 7), suggests that there are important differences between the two
regimes, which may imply that developing a mapping for sub-divided populations may be more challenging than for pan-mictic populations. A further difficulty is that the transition from the background selection regime to the interference re-gime is not infinitely sharp (compare Figure 6 andFigure S13). Therefore, even if a mapping can be developed, there may be a
“gray area”between the two regimes that requires a different kind of theoretical treatment. Overall, these considerations indicate that more analyses to further our understanding of the interference selection regime are warranted.
Acknowledgments
We thank Mark Beaumont, Brian Charlesworth, and two anonymous reviewers for helpful comments. We acknowl-edge support from the Biotechnology and Biological Sciences Research Council (BB/K000209/1) and the Natural Environ-ment Research Council (NE/L005328/1). This project made use of the computational resources provided by the University of Sheffield’s high-performance computer cluster, Iceberg.
Literature Cited
Beaumont, M. A., 2005 Adaptation and speciation: What can F (st) tell us? Trends Ecol. Evol. 20: 435–440.
Charlesworth, B., 1996 Background selection and patterns of genetic diversity inDrosophila melanogaster. Genet. Res. 68: 131–149.
Charlesworth, B., 1998 Measures of divergence between popula-tions and the effect of forces that reduce variability. Mol. Biol. Evol. 15: 538–543.
Charlesworth, B., 2012a The effects of deleterious mutations on evolution at linked sites. Genetics 190: 5–22.
Charlesworth, B., 2012b The role of background selection in shaping patterns of molecular evolution and variation: evidence
Figure 7 Shape of the SFS obtained using inter-ference selection models in the many-deme limit with scattered sampling. In all cases, the forward simulation started with an ancestral population of
size N0 = 1000, which, after 10N0 generations,
gave rise to 50 demes of sizeN= 1000 connected
by symmetric migration. The migration rate is
Nm= 0.03 (FST= 0.25 under neutrality with no
selec-tion at linked sites) in all models. No recombina-tion was included. Two pairs of models were
considered. The values of N0U and N0s are 20
and 0.1 for model 1, 80 and 0.05 for model 2, 400 and 20 for model 3, and 711.12 and 15 for model 4. Thus, models 1 and 2 have the same
N0s = 0.396 and models 3 and 4 have
N0s = 77.68. To obtain samples from equilibrium,
the populations were allowed to evolve for an
addi-tional 65N(for models 1 and 2, which have longer
coalescent times than the other two models) and 30N
(for models 3 and 4) generations after the split before
samples were taken every 15N(for models 1 and
2) and 5N(for models 3 and 4) generations until