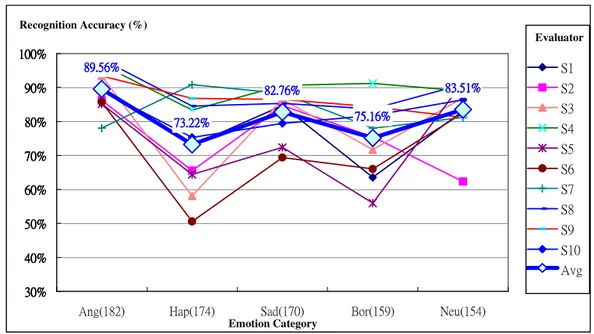
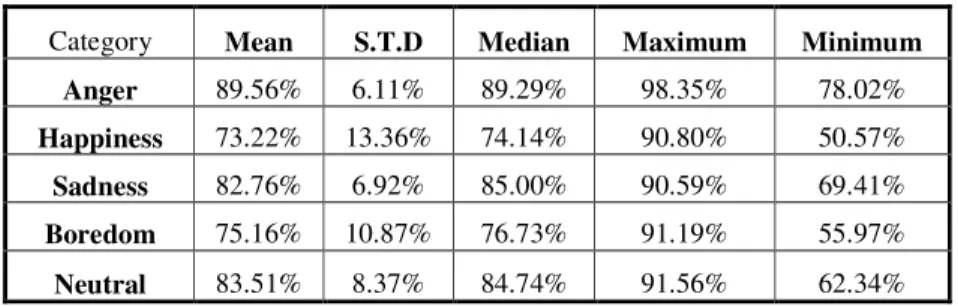
Table 2 shows the statistics of 10 evaluators for each emotion category. We can see that the variance for anger and sadness are less than for the other emotions. It means that human are better in understanding how to recognize anger and sadness than other emotions.
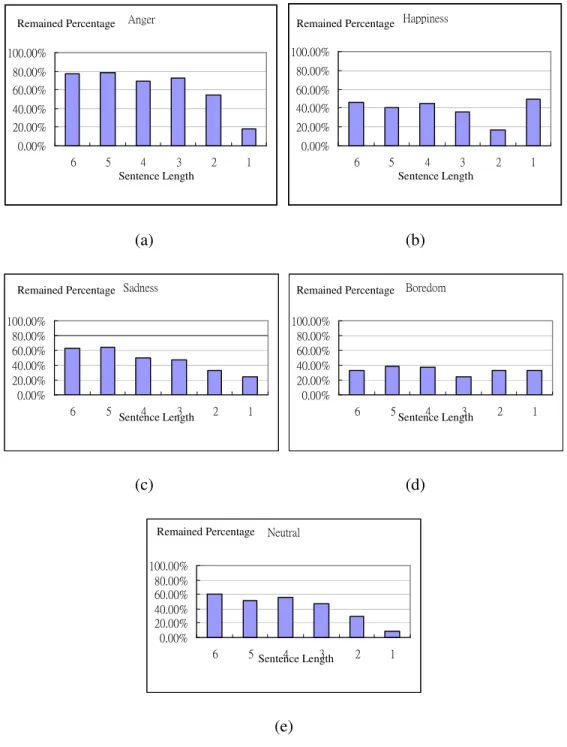
Figure 2 shows the percentage of remained sentences with different lengths for each emotion. We can see that the shortest sentence (only single word) is least remained in most emotions, especially in neutral. It means that we should avoid too short sentences when we make the prompting text in the future because emotions are hard to be recognized by human if the sentence is too short.
(a)
(b)
(c)
(d)
(e)
Fig. 2. Percentages of remained sentences with different lengths
Sentence Length Sentence Length
Sentence Length Sentence Length
Sentence Length
Remained Percentage Remained Percentage
Remained Percentage Remained Percentage
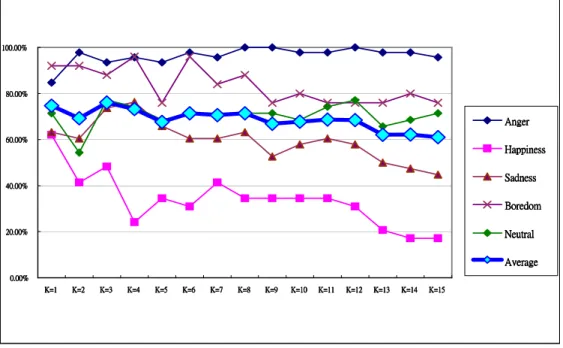
Fig. 4. Recognition rate of K=1 to 15 using KNN classfier.
Table 4 shows the confusion matrix of our recognition system that the value of K is set to one. The rows and the columns represent original and recognized emotion categories, respectively. For example, first row says that 39 sentences that belong to angry were recognized as angry, 6 sentences as happy, 1 sentence as sad, and 0 for the rest. And the recognition accuracy of anger is 84.78%. We can see that our system do better in recognizing anger and boredom. The mean recognition rate is 74.69%.
Table 4 Confusion matrix of our system
Anger Happiness Sadness Boredom Neutral Recognition rate
Anger 39 6 1 0 0 84.78%
Happiness 7 18 1 0 3 62.07%
Sadness 4 3 24 4 3 63.16%
Boredom 0 0 0 23 2 92.00%
Neutral 1 2 1 6 25 71.43%
3.2 Emotion Evaluation
Fig. 5. Block diagram of emotion evaluation
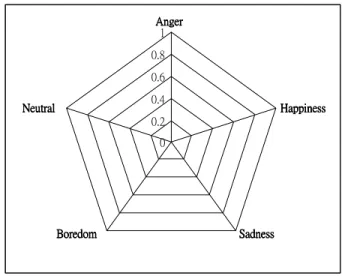
3.3 Emotion Radar Chart
An emotion radar chart is a chart with multi-axes. Each of the axes stands for one category of emotion. In our system, it just looks like a regular pentagon as shown in Fig. 6. We need to measure the distance of a testing data to each category to plot its radar chart. Thus a modified version of KNN (M-KNN) is needed.
Fig. 6. Emotion radar chart
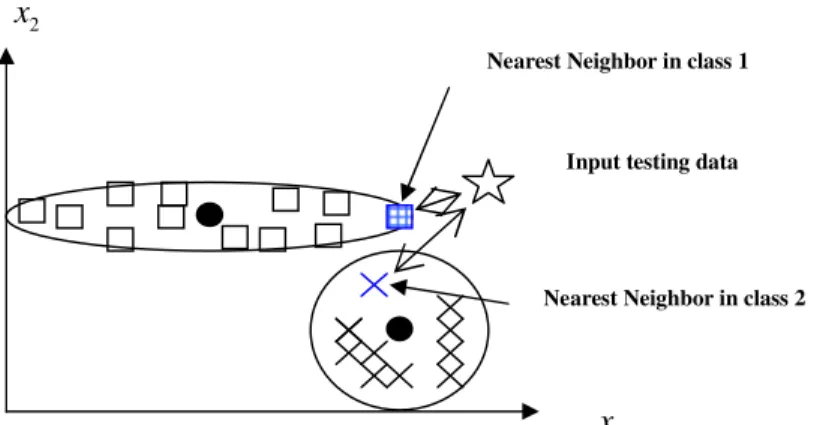
The M-KNN is based on the KNN technique. It calculates the K-nearest neighbors’ distances in each class to the input testing data. We set the value of K to 1 corresponding to the K in emotion recognition. Figure 7 shows the M-1NN method.
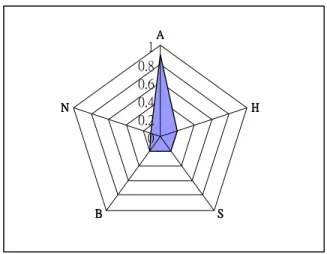
After the calculation of M-KNN, we will get five distances from five emotion categories. We take inverse of each distance, and base on these inverses of distances to plot a radar chart. For example, Table 5 list the calculation result of an input testing speech with angry emotion. And Fig. 8 shows the radar chart according to Table 5.
Testing Data
Training
Data Extraction Feature
Feature Extraction
Emotion Evaluation
(M-KNN)
Fig. 7. M-1NN: The computation of the distance to the nearest neighbor in each class
Table 5. Distance measured by M-KNN
Emotion Anger Happiness Sadness Boredom Neutral
Distance 12.325 19.31 23.14 27.868 22.83
Fig. 8. Emotion radar chart of a speech with anger emotion.
From Fig. 8, we can find that this input data is closed to anger. It means the intensity of anger is greater than the other emotions. An unambiguous emotion should close to one emotion and far away the other emotions similar to the one shown in Fig. 9.
Nearest Neighbor in class 2 Nearest Neighbor in class 1
1
x
2
x
Fig. 9. Emotion radar chart of speech with unambiguous emotion
3.4 System Interface
Figure 10 shows the interface of our system. A user can record his or her voice by pressing the Record button. The user can hear the speech within the selected range by pressing the Play button. Finally, the user can see the evaluation result of his or her speech by pressing the Eva button.
Fig. 10 System interface
4. Conclusions
In this paper, we build a Mandarin emotional speech database for research in this field. We also propose an emotion recognition and evaluation system. For hearing-impaired people, it could provide an easier way to learn how to speak more naturally.
We will continue to get more speech data into our database, and improve the recognition accuracy of the emotion recognition system. We also want to make the emotion evaluation more effectively. Furthermore, friendlier interface to hearing-impaired people is needed to be designed.
5. Acknowledge
A part of this research is sponsored by NSC 93-2213-E-036-023.
6. Reference
[1] Raquel Tato, Rocio Santos, Ralf Kompe, “Emotional Space Improves Emotion Recognition”, Man Machine Interface Lab, Advance Technology Center Struttgart, Sony International (Europe) GmbH.
[2] Inger Samso Engberg, Anya Varnich Hansen , “Documentation of the Danish Emotional Speech Database”, Department of Communication Technology Institute of Electronic Systems, Aalborg University, Sep. 1996 [3] Bo-Syong Juang, “Automated Recognition of Emotion in Mandarin”, Department of Engineering Science,
National Cheng Kung University Master Thesis, Jun 2002
[4] Maleq Khan, Qin Ding, William Perrizo, “k-Nearest Neighbor Classification on Spatial Data Streams Using P-Trees”, Computer Science Department, North Dakota State University.