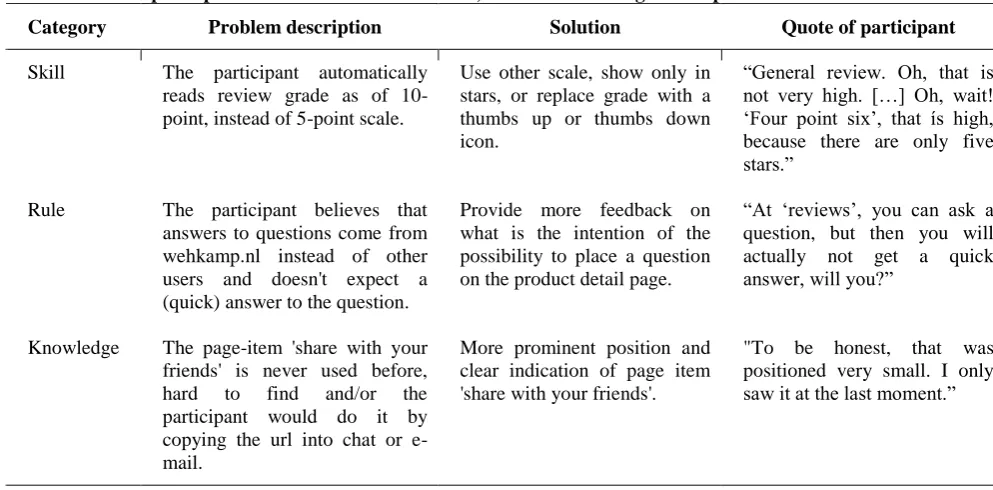
1
DIFFERENCES BETWEEN USERS AND THEIR
USER PROBLEMS
A USABILITY TEST FOR WEHKAMP.NL
Inge Pluijlaar
University of Twente, The Netherlands - Enschede
11-2011
Abstract
2
1. Introduction
The designs of websites should support the goals and needs of the end users. More and more professional creators and owners of websites are aware that when, in the development and evaluation process, sufficient attention is given to usability, a number of benefits arise. For example, in e-commerce websites, better usability may lead to increased conversion, less costs for customer support and less development and redevelopment costs (Burnett &
Ditsikas, 2006) (Bias & Mayhew, 2005).
Website usability refers to the amount of effectiveness, efficiency and satisfaction with which users achieve their specific goals, within a given context, using a website (ISO9241-11, 1998). There exist different definitions of usability, of which the one just mentioned, provided by the International Standardization Organization, may be the most commonly cited and generally accepted. Other definitions vary in whether they put the focus on usability as a quality attribute of a product or on usability as a profit arising from the use of the product (Bevan, 2001). Although this is important to consider, more interesting than how we define usability, is how we determine the usability of a specific product, of which the final aim would be to discover how we can improve the product.
There are several methods for determining usability. In some of these methods predictions are made without the involvement of users. For example, in heuristic evaluation an expert on human-computer interaction reviews the product under study. However, involving end users in evaluation is recognized to be of great importance to really elicit and understand the actual problems that customers experience using a website (Burnett & Ditsikas, 2006).
Usability testing is one of many techniques that contribute to a good User-Centred Design (UCD). The basis of UCD lies in the principle that the user is positioned in the centre of the process, methods and procedures for designing usable websites (Rubin & Chisnell, 1994).
In a customary usability test an experimenter observes users that perform a number of representative tasks using the product (or website) under study. Various data is collected. Some common performance measures include (Rogers, Sharp & Preece, 2007):
Time on task
3 Experts and practitioners in the field of usability often recognise that there is no such thing as a ‘general user’ to which usability principles ‘generally’ apply. For example, Jacob Nielsen (2006) stresses:
“Anyone who's done user testing knows that there are tremendous individual differences among users.”
Another quote that supports this assumption derives from Steve Krug (2006):
“There is no Average User.”
This study aims to shed light on the individual differences between users in relation to their individual user problems. Different user characteristics might lead to different kinds of
problems, which would also require different solutions.
2. Diversity in internet use
Diversity in Internet use has implications in several fields, such as governmental information and communications technology (ICT) deployment, e-commerce, (functional) web design, and usability testing methodology.
Many studies exist in which gender-, age-, cultural-, personality- and / or experience differences in specific internet uses are assessed. Several studies focus on different uses and usage motives of internet applications, like e-mail, entertainment, interpersonal
communication through chat rooms and other social media, educational assistance, etc. They are often conducted through surveys. Other studies relate user characteristics to online performance. Although not complete, the next paragraphs provide an overview of previous research on diversity in internet use.
2.1 Implications of diversity in Internet use
4 discriminating underprivileged people, like elderly, disabled people, and people with lower socio-economic status. By understanding differences between users we would try to tackle the challenge to not disadvantage certain groups of the society in making use of digital
governmental services.
Another field in which differences between patterns of use have important implications is e-commerce (Weiser, 2000). The internet as a medium has the advantage that users can be tracked through cookies. Many businesses already make use of this by matching relevant ad campaigns to users, according to the internet pages they visited and the keywords they
searched for. This marketing strategy is referred to as ‘behavioural targeting’, or ‘personalized advertising’. When individual differences between users are better understood it becomes easier for publishers and advertisers to provide users with personally attractive deals.
Further challenges lie in conversion rate optimization (CRO) with respect to individual differences between users. For example, in a webshop different users might respond to different persuasive stimuli designed to elicit a purchase. When for every user stimuli are provided that answer to his individual preferences and desires, the overall revenue by a certain number of visits to the website may increase.
If it turns out that different users experience different types of user problems, interesting design implications emerge. There might be no ‘optimal’ design solution that supports all users. This would imply that functional and graphic designers should search for solutions that take different, perhaps even contradictory usability principles into account.
If user diversity influences usability test-results, and if the intended user group for a product is broad, the test-sample should also contain a great variety of users. There is an on-going debate on what number of test participants is enough to elicit the greatest amount of usability problems of a product. Opinions vary from five participants to 12, to the conclusion that the percentage of found problems can only be estimated after a specific test has been conducted (Schmettow, 2011). Examining the influence of diversity is an interesting addition to this discussion, because, if many differences exist between the types of problems
6 navigation of websites or other applications should not be designed as deep menu structures. Applying other methods to arrange various categories will help to avoid disadvantaging older people in using the application.
In a large-scale study Van Deursen and Van Dijk (2009) examined individual skill related problems that users experience while navigating the internet. They focused on four levels of internet skills: operational, formal, informational and strategic. Findings include that in particular, people of higher age experience more problems related to operational- and formal skill. They did not perform worse on the other two types of skills. Older participants even appeared to be better than younger participants at selecting relevant pages from search results. Therefore Van Deursen and Van Dijk (2009) recommend to look at differences in
performance in a detailed way. The different characteristics of users may have both drawbacks and advantages that should be accounted for in the different fields of interest.
2.4 Cultural differences and internet use
People with different cultural backgrounds, living in different societies, might have different attitudes towards computers and the internet and use them differently (Li & Kirkup, 2007). Different studies have confirmed this hypthesis. For example, Li and Kirkup (2007) found significant differences between Chinese and British students in their attitudes towards and use of computers and internet. Chinese students had less prior experience with computers and were less likely to use computers for educational assistance than British students.
However, the Chinese were more confident about their advanced computer skills. In both countries men used computers more for e-mail and for playing computer games than women, and men were more self-assured in their computer use. Gender differences were greater among British students than for Chinese students.
2.5 Personality differences and internet use
Amiel and Sargent (2004) examined internet use and usage motives in relation to the personality types described by Eysenck and Eysenck (1985): psychoticism, extraversion and neuroticism. It turned out that neurotic participants used the internet for information purposes and to feel a sense of belonging. Extravert participants didn’t see the internet as
7 In another study Burnett and Ditsikas (2006) conducted a usability test in which
performance was compared over differences in personality. In this study they tried to
ascertain whether extravert people undergoing a usability test reveal more usability problems than introvert participants do. The aim was for experimenters to be able to establish usability tests more efficiently. If it was shown that extravert people elicit more problems, using them as participants would help find more usability problems with less participants. Results showed that extravert participants revealed 40% more usability problems than introvert participants did.
Burnett and Ditsikas (2006) bring up that we then should consider not only what type of personality reveals most problems, but also if those problems qualitatively cover all problems experienced by the different types of users.
2.6 Differences in education as well as cognitive skills and internet use
People with lower levels of education and lower cognitive abilities generally show less proficiency in using the internet than highly educated people and people with more efficient perceptual skills and style do (Van Deursen & Van Dijk, 2009) (Kim, 2001) (Johnson, 2008) (Al-maskari & Sanderson, 2011). However, it appears that differences may decrease as people have more experience with the use of the internet (Kim, 2001). Johnson (2008) even put forward that the more people use the internet, the better their cognitive capacity. He argued that the internet functions as a tool that extends the cognitive processing abilities of people, and that by gaining more experience with this tool, the overall cognitive performance may be improved.
2.7 Differences in product experience and internet use
The characteristics, that determine who is a novice user of a specific website and who is an expert, are twofold. First, users differ in their experience and skills in general computer and internet use. The second factor that influences their level of expertise is the duration of, and frequency in use of a specific website. Faulkner and Wick (2005) acknowledge that
categorising participants of a usability test on both these characteristics helps to uncover more, and more diverse usability problems. Dividing users on the basis of their expertise contributes to a good understanding of what these problems comprise of. As a result, better choices can be made on how and with what priority to improve elements of a website.
8 design, sufficient attention should be directed at the learnability of the application. As it appears that experience may also influence the effects of other distinguishing characteristics, like cognitive skills, this further calls for proper intervention of computer courses in
educational programs.
3. Research questions
3.2 Research question 1: diversity in users
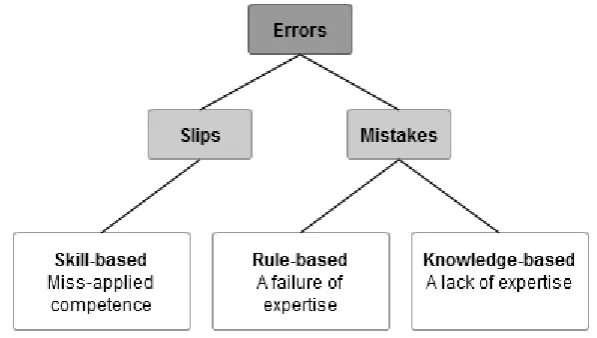
This study is specifically interested in how differences between individual users result in differences between the types of problems they experience. To classify types of user problems we relied on the Skill, Rule, Knowledge (SRK) based approach, provided by Rasmussen (1979). This framework helps to distinguish and understand the types of errors that occur in the interaction between human and (computer) system (Embrey & Lane, 1990). The different levels of information processing, ‘skill’, ‘rule’ and ‘knowledge’ based, vary in the degree conscious or automatic behaviour is applied. Skill based behaviour requires routine and little conscious awareness. In rule based behaviour people apply units of solutions from previous experiences to deal with new situations. Knowledge based information processing is required when no routines or rules are available. In this case a person’s interactions take place in a very conscious manner. Reason (1990) extended the SRK-approach in a detailed model describing how the different types of information processing are characterised and related. While in progress, people switch between the different levels of conscious behaviour. This model is known as the Generic Error Modeling System (GEMS).
The different types of information processing are each associated with certain types of human failure (Reason,1990). Errors that occur when an operator has the right intentions, but fails to deliver the right execution, are referred to as slips. Slips typically indicate skill-based problems. For example, a person intends to send an e-mail with attachment. He prepares the message, but then forgets to attach the document before sending the e-mail. In this case, although the operator knows very well how to attach a document to an e-mail, he fails to respond to the required deviation of his routine: ‘ad recipients, type subject, type message, send’. This specific type of skill-based error is referred to as ‘stereotype
fixation’(Kirwan,1992).
9 instance, a particular online game includes two options: 'return' and 'pause'. After clicking on the pause-button, a gamer mistakenly assumes that, if he clicks the return button, then this will bring him back in the game, right where he left it. Instead the 'return'-button will start a new game. This can be regarded as a rule-based error. A knowledge-based error for example occurs, when a person tries to find some information on the internet, using a search engine, while he doesn’t know what keywords on his topic will deliver good search results. Part of the error classification by Reason (1990) as is introduced above, is depicted in figure 1.
Figure 1. SRK-classification of errors.
Our goal was to investigate, whether recommendations following from usability test results account for all kinds of users, or whether usability examiners should consider structural differences between types of users in their analysis and advise.
To what extend and in what way do differences between age, gender, education and experience between users relate to the kind of user problems (skill, rule, and knowledge based) experienced by these users?
3.2 Research question 2: diversity in problems
As mentioned earlier in this paper, a frequently asked question in usability testing is:
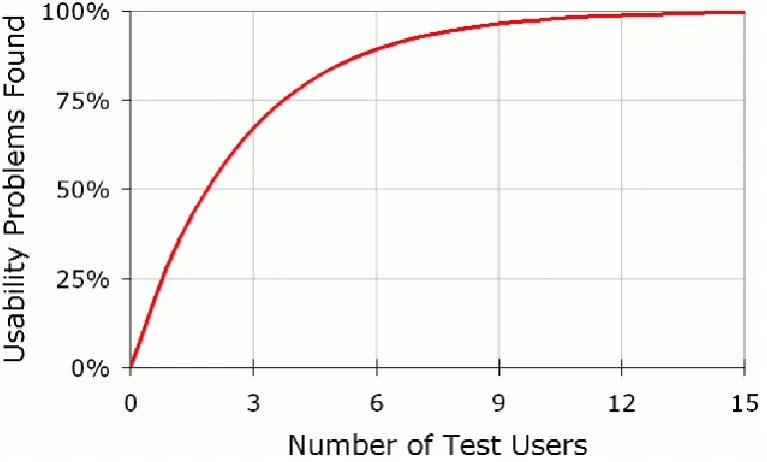
10 A debate on this topic started with Nielsen (2000), who argues that testing with only five users is enough. His assumption derives from applying a geometric series model, as introduced by Virzi (1992):
N(1-(1-L)n)
The model is meant to provide insight on what proportion of usability problems (N), is found with a given number of test participants (n), as a function of the average probability of uncovering a problem with a single participant (L) (Nielsen, 2000).
Nielsen and Landauer (1993) studied several separate usability tests. Averaging the varying L’s over the different data led to the curve given in figure 2, which represents the proportion of usability problems that are found when testing a certain number of users. Based on this curve Nielsen (2000) argues that 15 users in a usability test are capable of bringing forward all existing usability problems. He adds that, in practice, it will be more efficient to test 5 users multiple times throughout the development and redevelopment of the product. Each time, these 5 users are claimed to discover around 85% of existing problems.
11 Nielsen’s approach encounters various criticism. To start with, the mathematical model used may not be appropriate. In usability evaluation the fundamental underlying assumptions of the model are not fully met (Schmettow, 2011). One of the issues related to this argument is that not all usability problems are equally easy to discover; the data is not homogeneous. Furthermore, the observations are not complete. The number of unfound usability problems is typically unknown. The geometric series model does not take this into account. As a
consequence the probability L is overestimated.
To overcome both the issue on homogeneity, and that on completeness, recently,
Schmettow (2009) proposed an alternative for the geometric series model: the logit-normal binomial distribution (LNBzt). In extension of the geometric series model the LNBzt
introduces a prior distribution for the probability L. Comparing the two mathematical models Schmettow (2011) demonstrates that on several data sets the LNBzt model proves to be the better fit. This implies that discovering the majority of usability problems acquires much more test participants than assumed earlier, based on the geometric series model.
The number and kind of usability problems vary great depending on the nature of the evaluated application (Spool and Schroeder, 2001). Lewis (2011) therefore recommends to have no presumptions on how many users you need to test in advance of a specific product evaluation. An alternative is to first test a product with a couple of participants, and then, based on the data, estimate the number of users needed to elicit, say at least 80% of the existing usability problems. Afterwards an experimenter can evaluate whether this target was actually met.
Diverse users might also differ substantially in the kind and amount of problems they experience. In this light, testing users with distinct characteristics demands a larger sample size than proposed by Nielsen (2000). In this study we typically test a sample of users with distinct characteristics. Reasoned from the original standpoint of Nielsen we would
hypothesize that:
With 5-7 test participants we find 85% of problems.
13 categories for a generic user characterization for a typical computer-based product. Using his ‘generic user characterization’ we formulated wehkamp.nl specific interview questions (appendix 1), divided in five topics:
1. Personal History 2. Educational History 3. Occupational History 4. Computer Experience 5. Product Experience
4.3.2 Usability test
A usability test measures the performance of users on specific tasks that should be representative of common user goals. With such a test, user problems concerning product effectiveness, efficiency and satisfaction can be brought into view. The usability test was conducted applying the Think Aloud Method (TAM).
The Think Aloud Method
The TAM is a method for uncovering cognitive processes. The basis for the TAM in usability testing lies within the classic writing about protocol analysis from Ericsson and Simon (1993). They discussed the use of introspective data in the study of task directed cognitive behaviour.
Especially the Concurrent Think Aloud Method (report of immediate thought) is widely used for depicting the behaviour and thought processes of users and analysis of occurring user problems within usability tests (Nielsen & Carsten, 2004).
Ericsson and Simon (1993) identified three levels of verbalization. These levels vary in the degree to which cognitive processes are needed to transform the thoughts into words before they are spoken. In level 1 verbalization one expresses his direct thoughts. In level 2
verbalization a single process takes place between short-term memory and verbalization; images or abstract concepts need to be transformed into words. In level 3 verbalizations there exist more cognitive demands than just those required for task performance and verbalization; a person must reflect on his own cognition, or retrieve information from long-term memory.
14 people are reported not to be able to correctly report on their own cognitive processes (Boren & Ramey, 2000).
Task Selection
A critical procedure in designing the Think Aloud usability test is the selection of tasks (Rubin, 1994). It is important to especially consider the representativeness of the task with respect to realistic user goals. Some points of interest were outlined, which helped to shape the tasks.
The tables in appendix 2 provide an overview per task, including the task description, the Uniform Resource Locator (URL) of the page on which the task starts, the criteria for successful completion, maximum duration of the task and the points of interest the task covers. As the test progress the tasks become more specific. For example, task descriptions one and three are as follows:
Task 1: “Find a new winter coat you like on this product overview page and order it.” Task 3: “You want a new couch. Use the information and functionality on this product detail page to shape your opinion on this product. Order the couch if you have gained a positive impression of the product.”
Setup
We instructed the participants by reading a written directive together (see appendix 2 for the text of this directive). Herewith we guaranteed consistency within the subjects information at the start of the test. Contents of this directive were based on the procedure as summarized below.
There are differences in peoples capabilities to verbalise their thoughts. To overcome this problem we held a practice round before starting the actual tasks, in which we could stimulate the subjects to verbally express their thoughts more and better.
The test must take place in setting in which the subject feels at ease. The test sessions took place in a room in a behavioural science lab to be assured of a quiet environment. We
explained participants that the object under study was the website and not them, and therefore there was no way for them to perform well or badly on the test.
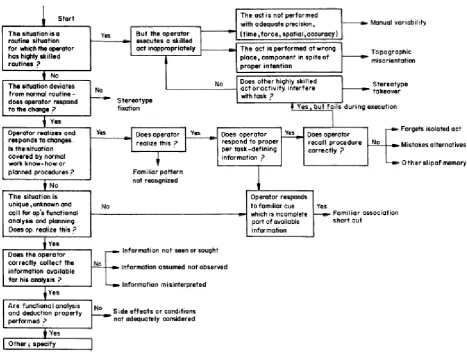
16 The third, and last step in the process of clarifying the found problems was conducted by moving along two specific questions regarding the problem:
1. In what situation is the problem occurring?
If the situation is familiar to the user he can respond to the demands for achieving a certain goal in an automatic, routine based way. If this is the case the user is in a state of skill-based information processing.
If the situation deviates from the familiar circumstances and a behavioural adjustment of the user is required, then this normally indicates a state of rule-based processing. If the situation is new to the user this calls for gathering the right information and feedback to make sense of what should be the next step.
2. In what way does the behaviour of the user deviate from the desired response? This last question helps to make sense of how the user failed to rightly apply the required strategy in a specific situation. An error occurs when the user doesn’t respond appropriately to the situation at hand. In every level of processing there are a number of different errors that may occur that will lead users away from achieving their goals.
The underlying system we applied to support us in answering the questions above is given in figure 4.2. It comprises of a flowchart that helps to identify the flaws in the cognitive psychological process in interaction with a specific product (Rasmussen, Pedersen, Carnino, Griffon, Mancini, Gagnolet, 1981). In this way, we could assign one of three SRK problem categories to a problem. In the end, a subjects’ score on one of the problem categories was determined by dividing the number of occurrences of problems in that category by the total number of problems in that category.
4.4.2 Analysis of variance
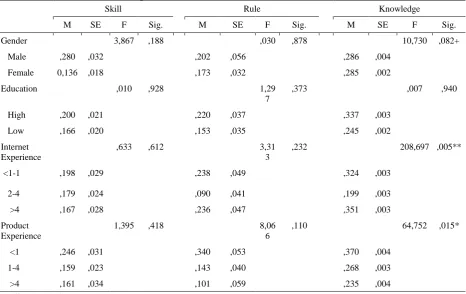
A multivariate ANOVA was applied including four independent variables, one covariate and five dependent variables.
Independent variables: 1. gender
2. education,
17 Figure 4: SRK error flowchart, adopted from Kirwan (1992).
Covariate: 1. age
Following from earlier research we would expect that age (and life stage) is of influence on the test results. However, in this study we have to little subjects in the separate age groups to make noteworthy comparisons. To account for possible age related influences we included the continuous variable age as covariate.
Dependent variables:
1. the score on skill based problems 2. the score on rule based problems
3. the score on knowledge based problems 4. average time on tasks
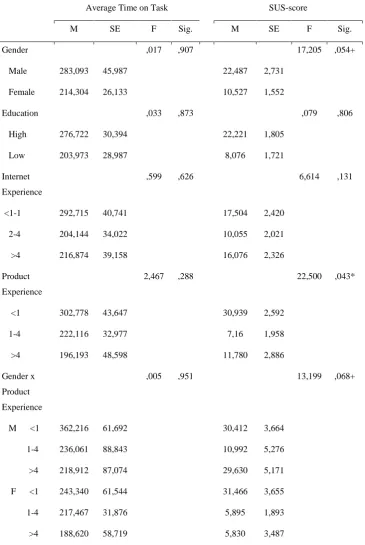
18
4.4.3 SUS score
To calculate the SUS score, we summed the score contributions from each of the ten items. The score contribution of each item ranges from 0 to 4. Then we multiplied the sum of the scores by 2.5 to obtain the overall value of the SUS. The SUS scores have a range of 0 to 100. Note that, the lower the score, the better the usability of the product is judged.
4.4.4 LNBzt distribution
In order to know whether the usability test has revealed the majority of existing problems we estimated the found percentage of problems through the LNBzt distribution, as introduced by Schmettow (2009). Because the model has a complex mathematical basis it’s components are only briefly summarized below.
The LNB probability distribution function (pdf) reads as follows:
Here, p stands for the probability of finding a problem with a single test participant. The unknown parameters µ and σ2 determine the N(µ,σ2
) normal distribution of p. Parameter x stands for the number of observed usability problems. Where n indicates the number of users participating in the test.
In LNBzt the ‘zt’ stands for ‘zero-truncation’, which functions to estimate the number of still undiscovered usability problems:
Central to the zero-truncation pdf function is the discrete random variable X Є {0,…,n}, which consists of the number of times any problem is detected. It is distributed as P(X = x|π) = pdf(x; π∙) (where π∙ are the model parameters). The pdfzt is obtained by setting the
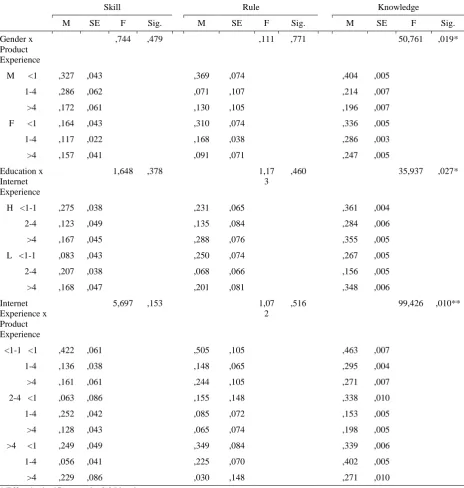
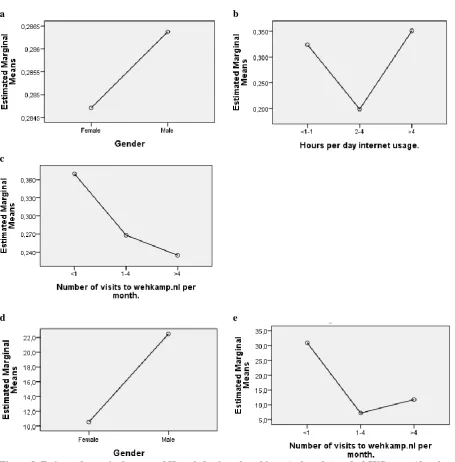
23 1. Men experience slightly more knowledge based problems than women.
2. People that spend very little time on the internet (less than one hour a day) and people that spend a lot of time on the internet (more than four hours a day) experience more knowledge based problems than people that spend a medium amount of time a day on the internet (1-4 hours).
3. People that visit wehkamp.nl more often, experience less knowledge based problems. 4. Men generally score higher on the SUS than women do, which means that they are
less satisfied with the product.
5. People that visit wehkamp.nl more frequently, score lower on the SUS, which means they are more satisfied with the product.
a b
c
d e
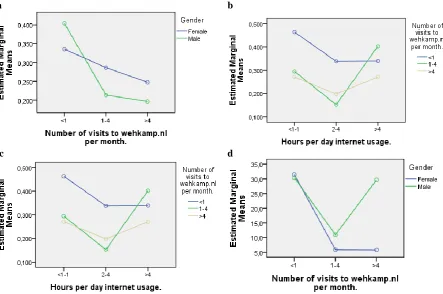
24 On the basis of our findings we also hypothesize the following interaction effects (see figure 7. and 8. for the corresponding profile plots):
1. Female paying less frequent visits to wehkamp.nl experience less knowledge based problems than man paying less frequent visits to wehkamp.nl, whereas women paying more than four visits to wehkamp.nl per month experience more problems than men with the same amount of experience with the product.
2. There is a smaller difference with respect to knowledge based problems between the lower and higher educated, as the amount of internet experience they have increases. 3. People with a medium amount of product experience (visiting wehkamp.nl 1-4 times a
month) vary the most in their performance over their level of experience with internet use.
4. Men that visit wehkamp.nl more often are considerably less satisfied with the product than women who have much product experience (the difference is less for the other levels of product experience).
a b
c d
25 Normality of dependent variables
For the results and hypothesis above to be of interest, it is important to consider whether our small sample is actually normally distributed with regard to our different independent variables. Applying the Shapiro-Wilk test reveals that there is significant evidence that both ‘Skill based problems’ (p=0,155) and ‘Knowledge based’ (p=0,07) are normally distributed, whereas ‘Rule based problems’, the ‘Average time on tasks’ and the ‘SUS’-score are not (see Table 5). This implies that, for knowledge based problems, our analysis method was
appropriate and therefore our findings may be relevant. Figure 10 reveals that the histogram and normal Q-Q plot for knowledge based problems still do not show an absolute perfect fit. However, the findings we included on the SUS-score are clearly much less accurate, as can be seen in figure 11. We should thus be careful with basing any general conclusions on our analysis of variance, since this test assumes that the dependent variables are normally distributed.
Table 5: Tests of normality. The null hypothesis is tested that the sample is normally distributed. A p-level below the chosen α-level (0,05) rejects this claim.
Shapiro-Wilk test
Dependent variable Statistic df Significance
Skill based problems ,927 19 ,155
Rule based problems ,898 19 ,044
Knowledge based problems
,909 19 ,070
Average time on tasks ,795 19 ,001
SUS ,745 19 ,000
26 Figure 11. Histogram with normal curve and normal Q-Q plots for SUS-score.
5.3 Study progress
We estimated that the 35 problems we found, accounted for about 81% of total usability problems regarding the pages we have examined. The LNBzt distribution for our sample is displayed in figure 5, where the x-axis represents the number of times the same problem was discovered with separate users, and the y-axis encompasses the frequency with which
problems were discovered a certain number of times. For example, you can read from the graph, that in our data there are five problems that were experienced by four separate users. According to the LNBzt model the estimated number of undiscovered problems (0 on the x-axis) is 8.
28 Figure 6: The separate test session with 19 users, together elicited around 81% of existing usability
29
6. Discussion
6.1 ConclusionThis study gives a view of the importance and the implications of taking into account differences between users in usability research. Results show that segmentation of participants on the basis of their characteristics may be of interest for the interpretation of test results, even with a relatively small sample.
6.1.1 Differences between users and their user problems
In this particular study we could reveal the following possible effects:
1. People who have more experience with the use of the product have less knowledge based problems and are more satisfied about the use of the product. Possibly, this finding is related to the nature of the classification we have used in this study. The more familiar one is with the use of a specific product, the more this person shifts from knowledge based information processing to skill based information processing. 2. People that generally spend a medium amount of time (1-4 hours a day) on the Internet
have less knowledge based problems than people that spend very little or, on the contrary, relatively much time on the internet. Inexperienced users might have more knowledge based problems because they have no rules or routines available to deal with the website. We can only explain the finding that also very experienced internet users have more knowledge based problems by considering that experienced internet users distinguish different websites better. They may recognise wehkamp.nl to be a uniquely functioning website compared to other websites visited. This reduces the tendency to use the website on a routine or rule basis, since experts often fail to transfer their skills to comparable, but nevertheless different domains (Anderson, 2005).
30 The observation that ‘knowledge based’ problems were found predominantly, and only this type of problem showed significant results, is in correspondence with the finding of Fu, Salvendy and Turley (2010). A usability test has shown to be the best suitable method for eliciting just these kind of problems. Heuristic evaluation is better at detecting the other types of problems: skill and rule based. An important question that arises from this fact, is whether the SRK based classification is the right one for the purpose of our study. People with more experience logically show a shift from knowledge based to more skill based information processing, which is also reflected in the types of problems they experience. Another type of classification, for example more on the side of required solutions, might provide more practical insights.
Although this study may have succeeded in eliciting 81% of usability problems of the product detail related pages of wehkamp.nl, the amount of 19 participants is minimal when the aim is to make comparisons over different users. A study with a comparable setup, but a larger number of respondents, might elicit more, stronger and even other effects between different user characteristics.
Nevertheless, we hope to have demonstrated through this article that practitioners in the field of the internet should not ignore the distinctions between users. We want to encourage usability specialists, web-designers and developers to structurally reflect individual
differences in their conclusions and choices. If we better understand the versatility in internet use, we will be able to provide a better response to the needs of users, and exploit the
potentials of humans interaction with the web.
6.1.2 Diversity of problems and the required number of test participants
This study clearly demonstrates that the hypothesis ‘With 5-7 test participants we find 85% of problems’ does not hold for every single study. Using a model that takes into account that the
data is not homogenous and not complete, the estimated probability of unfound problems is much higher than it would be using the geometric series model, from which our hypothesis initially derives.
32
6.2.4 Usability problems over different kinds of internet applications
Apart from differences between users, there might also be differences ‘within users’ in the number and kind of problems they experience when using different applications (Spool & Schroeder, 2001). Does one user experience the same kind of user problems for
governmental, e-commerce, educational and informational websites? And how about search engines, databases, e-mail and social media? A user might have different expectations regarding different digital services and adjust his behaviour. Future research may point out whether this is the case and what that might imply.
6.6.5 The absolute relevance of ‘usability’
Al-maskari and Sanderson (2011) raise another interesting issue with regard to differences in experienced usability. They showed that, although users with lower cognitive skills were less effective, they did not report to be less satisfied in their use of the product. If, in the end, our aim is to make internet applications equally usable for all different users, we should consider what aspect of ‘usability’ is decisive. Although users may not all be as fast and efficient in achieving their online goals as others, they might be equally effective. And even if they are not equally effective, they might be just as satisfied. We can imagine that for some applications it might not matter so much that users achieve the goals they initially visited a website for. For example, in e-commerce, a user might come to a website to quickly buy a t-shirt, but ends up browsing a webshop for hours to finally satisfactory order a pair of trousers, a couch and a juicer. No party would have been more happy if he had ‘effectively’ and
‘efficiently’ used the website for his original goal. Closer examination of the main factors for satisfactory internet use can shed light on whether it is worthwhile to make websites as effective and efficient as possible.
7. References
Al-Maskari, A., & Sanderson, M. (2011). The effect of user characteristics on search effectiveness in information retrieval. Information Processing & Management, 47(5),
719-729. Elsevier Ltd. Retrieved from
http://linkinghub.elsevier.com/retrieve/pii/S030645731100029X
33 Anderson, J.R. (2005). Cognitive psychology and its implications. New York: Worth Publishers.
Bevan, N. (2001). International standards for HCI and Usability. International Journal of Human-Computer Studies, 55, 533-552.
Bias, R.G., & Mayhew, D. J (2005). Cost-justifying usability, an update for the internet age. San Francisco: Morgan Kaufmann Publishers, Elsevier.
Boren, T., & Ramey, J. (2000). Thinking aloud: reconciling theory and practice. IEEE Transactions on Professional Communication, 43(3), 261-278.
Brooke, J. (1996). SUS – A Quick and Dirty Usability Scale. In Jordan, P.W., Thomas, B., Weerdmeester, B.A., & McClelland, I.L., Usability evaluation in industry (pp 189-194). London: Taylor and Francis Ltd.
Burnett, G.E., & Ditsikas, D. (2006). Personality as a criterion for selecting usability testing participants. University of Nottingham, School of Computer Science and Information
Technology. Retrieved on the 16th of june, 2011, from:
http://citeseerx.ist.psu.edu/viewdoc/summary?doi=10.1.1.98.4980.
Ericsson, K.A., & Simon, H.A (1993). Protocol analysis, verbal reports as data. Massachusetts: The MIT Press.
Eysenck, H. J., & Eysenck, M. W. (1985). Personality and individual differences: A natural science approach. New York: Plenum Press.
Faulkner, L., & Wick, D. (2005). Cross-user analysis: Benefits of skill level comparison in usability testing.Interacting with Computers, 17(6), 773-786.
Freudenthal, D. (2001). Age differences in the performance of information retrieval tasks. Behaviour & Information Technology, 20, 9-22.
Helsper, E. J. (2010). Gendered Internet Use Across Generations and Life Stages. Communication Research, 37(3), 352-374. Retrieved from
http://crx.sagepub.com/cgi/doi/10.1177/0093650209356439
Hornbæk, K. (2005). Current practice in measuring usability: challenges to usability studies and research. International Journal of Human-Computer Studies, 64, 79-102.
Hornbæk, K., & Frøkjær, E. (2008). Comparison of techniques for matching of usability problem descriptions. Interacting with Computers, 20(6), 505-514.
35 Schmettow, M. (2009). Controlling the Usability Evaluation Process under Varying Defect Visibility. Passau University, Information Systems II.
Selwyn, N. (2004). Reconsidering Political and Popular Understandings of the Digital Divide. New Media & Society, 6(3), 341-362.
Spool, J. & Schroeder, W. (2001). Testing web sites: five users is nowhere near
enough. CHI ’01: CHI '01 extended abstracts on Human factors incomputing systems, ACM, 285-286.
Thompson, S.H., & Vivien, K.G. (2000). Gender differences in internet usage and task preferences. Behaviour & Information Technology, 4, 283-295.
Van Deursen, J.A.G.M., & Van Dijk, A.J.A.M. (2009). Using the Internet: Skill related problems in users’ online behaviour (Electronic version). Interacting with Computers.
Retrieved from: http://www.utwente.nl/gw/mco/bestanden/Using%20the%20Internet-%20Skill%20related%20problems.pdf.
Virzi, R.A. (1992). Refining the test phase of usability evaluation: How many subjects is enough? Human Factors, 34(4):457–468.
39 3 Vragenlijst: System Usability Scale (SUS)
Sterk Sterk
mee eens mee
oneens
1. Ik denk dat ik het leuk zou vinden om wehkamp.nl frequent te gebruiken.
2. Ik vond de website onnodig ingewikkeld.
3. Ik vond dat de website eenvoudig was om te gebruiken.
4. Ik denk dat ik ondersteuning nodig heb van een technisch persoon om wehkamp.nl te kunnen gebruiken.
5. Ik vond dat de verschillende onderdelen van deze website goed bij elkaar pasten.
6. Ik vond dat er te veel
onsamenhangendheid was in de website.
7. Ik kan mij voorstellen dat de meeste mensen heel snel leren hoe ze
wehkamp.nl kunnen gebruiken.
8. Ik vond de website erg lastig om te gebruiken.
9. Ik voelde me heel zelfverzekerd terwijl ik de website gebruikte.
41 GUIDE: axis(dim(1), label("SUS"))
GUIDE: axis(dim(2), label("Frequency"))
ELEMENT: interval(position(summary.count(bin.rect(SUS))), shape.interior(shape.square))