Research Article
A New Robust Watermarking Scheme to Increase Image Security
Hossein Rahmani, Reza Mortezaei, and Mohsen Ebrahimi Moghaddam
Electrical and Computer Engineering Department, Shahid Beheshti University, G.C., Tehran 1983963113, Iran
Correspondence should be addressed to Mohsen Ebrahimi Moghaddam,m [email protected] Received 12 December 2009; Revised 7 July 2010; Accepted 16 October 2010
Academic Editor: Yingzi Du
Copyright © 2010 Hossein Rahmani et al. This is an open access article distributed under the Creative Commons Attribution License, which permits unrestricted use, distribution, and reproduction in any medium, provided the original work is properly cited.
In digital image watermarking, an image is embedded into a picture for a variety of purposes such as captioning and copyright protection. In this paper, a robust private watermarking scheme for embedding a gray-scale watermark is proposed. In the proposed method, the watermark and original image are processed by applying blockwise DCT. Also, a Dynamic Fuzzy Inference System (DFIS) is used to identify the best place for watermark insertion by approximating the relationship established between the properties of HVS model. In the insertion phase, the DC coefficients of the original image are modified according to DC value of watermark and output of Fuzzy System. In the experiment phase, the CheckMark (StirMark MATLAB) software was used to verify the method robustness by applying several conventional attacks on the watermarked image. The results showed that the proposed scheme provided high image quality while it was robust against various attacks, such as Compression, Filtering, additive Noise, Cropping, Scaling, Changing aspect ratio, Copy attack, and Composite attack in comparison with related methods.
1. Introduction
Owing to the recent advances in network and multimedia techniques, digital images may be transmitted over the nonsecure channels such as the Internet. Therefore, the enforcement of multimedia copyright protection has become an important issue in literature.
Watermarking and cryptography are two standard mul-timedia security methods. However, cryptography is not an effective method because it does not provide permanent protection for the multimedia content after delivery to consumers, because, after decryption there is no protection for the documents. Digital watermarking technologies allow users to hide appropriate information in the original image that is imperceptible during normal use but readable by special application. Therefore, the major purpose of digital watermarks is to provide protection for intellectual property that is in digital format. To evaluate a watermark system, the following attributes are generally considered [1,2].
(1)Readability. A watermark should convey as much information as possible, statistically detectable, enough to identify ownership and copyright unam-biguously.
(2)Security. Only authorized users gain access to the watermark data.
(3)Imperceptibility. The embedding process should not introduce any perceptible artifacts into original image and not degrade the perceived quality of image.
(4)Robustness. The watermark should be able to with-stand various attacks while can be detected in the extraction process.
The most important watermarking schemes are invisible where are secure and robust. Moreover, in the invisible watermarking, the embedding locations are secret, and only the authorized persons who have the secret keys can extract the watermark.
In another classification, digital watermarking algo-rithms can be divided into two groups: spatial domain [5–7] and frequency domain [8–12] methods according to the processing domain of the host image. The spatial domain algorithms are simple and the watermark can be damaged easily, but the frequency domain algorithms can resist versus intensity attack and watermark information cannot be damaged easily [13].
However, in all frequency domain watermarking schemes, there is a conflict between robustness and transparency. If the watermark is embedded in the lower-frequency bands, the scheme would be robust to attacks but the watermark may be difficult to hide. On the other hand, if the watermark is embedded in the higher-frequency bands, it would be easier to hide the watermark but the scheme has less resistant to attacks. Therefore, finding a proper place to embed the watermark is very important.
In 1996, Cox et al. [14] advised that the watermark should be embedded in the low-frequency coefficients of DCT domain to ensure the robustness. To improve this method, Lu et al. [15] used a cocktail watermark to increase robustness and HVS to maintain high fidelity of the watermarked image. Barni and Hsu [16, 17], respectively, recommended that the watermark should be embedded in the middle frequency coefficients to reduce the distortion. But Huang et al. in [18] points out that the DC coefficient is more proper to be used for embedding watermark, and this conclusion is obtained based on his robustness test between the DC coefficient and two low-frequency coefficients.
Also, DWT as another frequency transform technique has been used by many researchers such as Xie and Arce for digital image watermarking [19]. The proposed method by Zhao et al. in [20] is a sample of DCT/DWT domain-based method which uses a dual watermarking scheme exploiting the orthogonality of image subspaces to provide robust authentication. As other examples, in [21,22], the proposed DCT/DWT methods embed a binary visual watermark by modulating the middle-frequency components. These two methods are robust to common image attacks; but geometric attacks are still challenges. In [23], another approach to combine DWT and DCT has been proposed to improve the performance of the DWT-based watermarking algorithms. In this method, watermarking is done by embedding the watermark in the first and second level of DWT subbands of the host image, followed by the application of DCT on the selected DWT subbands. The combination of these two transforms improved the watermarking performance considerably in comparison with DWT-only watermarking approach.
Most of the existing watermarking methods use a pseudorandom sequence or binary image as a watermark. However, using grayscale images as watermarks has drawn much attention for copyright protection since many logos are grayscale in nature. One of the methods that hide a grayscale watermark image in original image was proposed by Mahanty and Bhargava [24]. In this method, at first, based on Human Visual System (HVS), the most perceptually important region of original image is found. Then, a compound watermark is created to insert in this region of the
original image. For creation of compound watermark, the synthetic image is created by Gaussian and Laplacian random number generator. The choice of these two distributions for modeling the DC and AC coefficients of image DCT is motivated by empirical results presented in Reininger and Gibson [25] and Mohanty et al. [26]. Next, the original watermark is embedded in insensitive area of synthetic image using any DCT-based visible watermarking algorithm. Asatryan proposed another method that combines spatial and frequency domain to hide a grayscale watermark in grayscale original image by mapping the values of DCT coefficients of compressed watermark image to the interval [0,255] (max and min value of grayscale image) by a fixed linear transform and inserts these values in the original image [27]. But, this method introduces perceptible artifacts into original image and degrades the perceived quality of image.
Fuzzy inference system Texture sensitivity Location sensitivity Inputs Outputs Luminance sensitivity
Weighting factor (β) Suitability (α)
Figure1: Inputs and outputs of Dynamic Fuzzy Inference System (DFIS).
The rest of paper has been organized as follows: In
Section 2, the proposed approach has been introduced and inSection 3, the proposed method has been motivated and structurally compared with related ones.Section 4describes the experimental results and inSection 5, the paper has been concluded.
2. Proposed Algorithm
In this section, the proposed algorithm is describedin detail. The algorithm is divided into four parts: block selection, watermark creation,watermark embedding and watermark extraction, which are described in Sections2.1–2.4, respec-tively.
2.1. Block Selection. In this section, we try to find the best blocks for embedding the watermark. For this purpose, the original image is divided toa×anonoverlapping blocks and subsequently DCT is applied on each block. In the following of this paper, the value ofais considered as 8 to increase the method robustness versus compression because the standard JPEG is based on 8×8 blocks. Then, the following properties of Human Visuals System (HVS) model that is suggested in [24,28] is used for selecting blocks that are suitable for embedding watermark.
(i)Luminance Sensitivity (Lk). The brighter the back-ground, the lower the visibility of the embedded watermark. It is estimated by following relation:
Lk=XXDC,k
DC
, (1)
whereXDC,k is the DC coefficient ofkth block and
XDC is the mean value of DC coefficients of an
original image.
(ii)Texture Sensitivity(Tk). The stronger the texture, the lower visibility of embedded watermark. It can be estimated by quantizing the DCT coefficients of a block (Xk) using the JPEG quantization table (Q). The latter results are then rounded to the nearest integers. The number of nonzero coefficients is then computed. This number presents the texture of that block:
Tk=Number of non Zero Round X k Q , (2)
whereXk are coefficients and Number of non Zero counts nonzero coefficients inkth block.
Low High
Not high and not low
A B C D E
Texture sensitivity M embership deg ree 0 1
Figure2: Dynamic membership function for texture sensitivity.
(iii)Location Sensitivity (Ck). The center quarter of an image is perceptually more important than other areas of the image. We estimate location of each block by computing the following ratio:
Ck=center(64Bk), (3)
where center(Bk) is the number of pixels of thekth block lying in the center quarter (25%) of the image.
When these parameters are computed, they can be used to select blocks and determine weighting factor for embed-ding. In the proposed method, a Fuzzy Inference System (FIS) for calculating the relationship established between all properties of the HVS model is used because FIS provides simple mapping from a given set of inputs to another set of outputs without the complexity of mathematical modeling concepts.
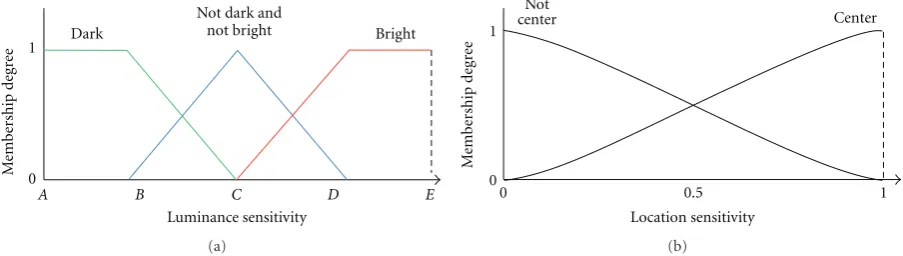
Here, a DFIS has been used [28] and optimized in order to approximate the relationship established between three properties of the HVS model for both block selection and embedding process. We supposed the location sensitivity parameter is independent to images, therefore, in this model a static membership function is used for location sensitivity and only texture sensitivity and luminance sensitivity have dynamic membership functions. In the proposed DFIS, as it is shown inFigure 1, the inputs consist of texture sensitivity, luminance sensitivity, and location sensitivity parameters of each block and the outputs consist of corresponding suitability and weighting factors. The shape and support set values for inputs and outputs MFs (Membership functions) have been derived from experiments on various images.
A B C D E M embership deg ree 0
1 Dark Bright
Not dark and not bright Luminance sensitivity (a) M embership d eg re e 0 1
0 0.5 1
Not
center Center
Location sensitivity
(b)
Figure3: Membership functions for (a) luminance sensitivity and (b) location sensitivity.
M embership deg ree 0 1 Not suitable Lightly suitable Suitable
2 5 8 10
Suitability (a) Very small Lightly small Lightly large Medium
large largeVery
Weighting factor
0.0035 0.0098 0.0145 0.0192 0.0239 0.0192 0.035
M embership deg ree 0 1 (b)
Figure4: Membership Functions outputs of DFIS, (a) Suitability (α) and (b) Weighting Factor (β).
computed. The structure of Texture sensitivity membership function has been shown in Figure 2. To compute the membership function parameters; first, we set A and E to take the minimum and maximum values of texture sensitivityTk(4):
A=min(Tk), E=max(Tk),
(4)
where Tk is the Texture sensitivity of the kth block of the image. Then, in order to find point C, the average of the texture sensitivity of all 8×8 blocks in the image is computed as shown in (5), whereBNis the number of 8×8 blocks in the image:
C=
BN
k=1
T
K BN
. (5)
Finally, pointsBandDare determined, in such a manner that these points never overlap or precede points A or E. The point B is equal to the median of texture values that are betweenAandCvalues as shown in (6), whereTkis the Texture ofkth block and the pointDis equal to the median of textures values that are betweenCandEvalues as shown in (7):
B=median{Tk|A≤Tk≤C}, (6)
D=median{Tk|C≤Tk≤E}. (7)
When points A, B, C, D, and E are determined, the slopes of all membership functions (MFs) are computed. The membership function of the other dynamic parameter (Luminance sensitivity) is created in the same way. Mem-bership functions for Luminance sensitivity and Location sensitivity are shown inFigure 3. It is worth mentioning that the shape of location sensitivity membership functions is different from the others, because the experiments showed that this kind of MFs better fits to the used data than the others. So, the location sensitivity membership function (μu) is defined as the Z-function. The Z-function models this property using the following equation:
μu= ⎧ ⎪ ⎪ ⎪ ⎪ ⎪ ⎪ ⎪ ⎪ ⎪ ⎪ ⎪ ⎪ ⎪ ⎪ ⎨ ⎪ ⎪ ⎪ ⎪ ⎪ ⎪ ⎪ ⎪ ⎪ ⎪ ⎪ ⎪ ⎪ ⎪ ⎩
1, u≤p,
1−2× u−p
2
q−p, p < u≤ p +q 2 ,
2× u−q
2
q−p, p +q
2 < u≤q,
0, otherwise.
(8)
Figure 3(b)shows a plot of this function. In (8),pandq are two constant values that should be specified heuristically; for example, the best values that we found fornot centercurve werep= 0 andq=1. The same curves for all images have been used.
(a) (b) (c) (d)
Figure5: (a) Original Lena, (b) Lena created using only DC coefficients of original image, (c) Lena created using estimate formulas (Gonzales method [3]) on image (b), and (d) Lena created using estimate formulas (Veeraswamy method [4]) on image (b).
Block 6 Block 4
Block 2
Block 8
Block 3
DC
DC DC DC
DC DC DC
DC DC
Block 1
Block 9 Block 7
AC
AC AC
AC
AC
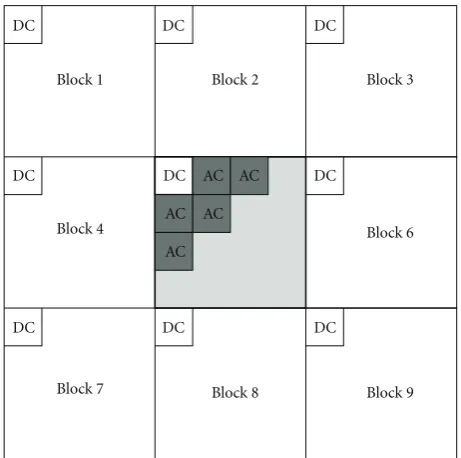
Figure6: The position of five AC components in the central block that estimated using nine DC components of 3×3 neighborhoods.
values for αk and βk which determine the suitability and weighting factor of kth block of image. The blocks with highestαkvalues are selected for embedding process.
2.2. Watermark Creation. As we know, most of the signal energy of the block DCT is compacted in the DC component and the remaining energy is distributed diminishingly in the AC components in zigzag scan order [4]. On the other hand, the DC component is more robust than AC components versus different attacks. However, with having only DC coefficient in each block of an image, the overall look of that image is presented. For example,Figure 5(b)shows the Lena image that created using only DC component of each 4×4 DCT block.
Since the DCT coefficients in one block for most images have a high correlation with the adjacent blocks; Gonzales
et al. in [3] described a technique which estimates a few low-frequency AC coefficients precisely. Moreover, only the DC values of 3×3 neighborhoods of each central block are needed to estimate the AC coefficients of each central block as shown inFigure 6. The estimation relations for the first five AC coefficients of each 4×4 DCT block are shown in
Table 1(first column) andFigure 5(c)shows the Lena image that created using these relations.
Gonzales et al. [3] did not consider variations in the image in AC coefficients estimation, but in [4] a new method was proposed that considered the variation in the image and accordingly AC coefficients are estimated with different equations. This method is better than Gonzales method in terms of reduced blocking artifacts and improved PSNR value. In this method, at first, the entropy of each block is calculated and then blocks with entropy values less than a threshold value are defined as smoother blocks and blocks with entropy values equal or greater than a threshold are considered as featured blocks. Based on entropy values, three cases are considered in estimation relations: (1) Smoother blocks, (2) Featured blocks and (3) Featured blocks surrounded by featured blocks. The estimation formulas based on Veeraswamy method to sup-port 4×4 DCT block for these three cases are shown in
Table 1 (2th and 3th columns) and Table 2, correspond-ingly.
Based on this idea, only DC coefficients are needed to estimate the AC coefficients of each block [4]. Therefore, the estimating formulas (as shown in Tables1and2for 4×4 DCT block) are employed to find these coefficients. Figure 5(d)
shows a sample image that created by this method when the size of block is 4×4.
For watermark creation process, as shown inFigure 7, the original grayscale watermark image is divided intob×b(e.g., 4×4) nonoverlapping blocks and subsequently performing the DCT on each block. Next, all AC coefficients are changed to zero.
Table1: The formulas to estimate the first five AC coefficients of each 4×4 DCT block (1).
Estimation formulas (Gonzales’s method) Estimation formulas for smoother blocks(Veeraswamy’s method) Estimation formulas for featured blocks(Veeraswamy’s method) AC(0, 1)=0.14125×(DC4−DC6) AC(0, 1)=0.175×(DC4−DC6) AC(0, 1)=0.231×(DC4−DC6) AC(1, 0)=0.14125×(DC2−DC8) AC(1, 0)=0.175×(DC2−DC8) AC(1, 0)=0.231×(DC2−DC8)
AC(0, 2)=0.03485×(DC4+ DC6−2×DC5) AC(0, 2)=0.083×(DC4+ DC6−2×DC5) AC(0, 2)=0.118×(DC4+ DC6−2×DC5) AC(2, 0)=0.03485×(DC2+ DC8−2×DC5) AC(2, 0)=0.083×(DC2+ DC8−2×DC5) AC(2, 0)=0.118×(DC2+ DC8−2×DC5) AC(1, 1)=
0.02026×(DC1+ DC9−DC3 −DC7)
AC(1, 1)=
0.029×(DC1+ DC9−DC3 −DC7) AC(1, 1)=0.15×(DC1+ DC9−DC3−DC7)
Table2: The formulas to estimate the first five AC coefficients of each 4×4 DCT block (2).
Featured blocks surrounded by horizontal featured blocks (Veeraswamy’s method)
Featured blocks surrounded by vertical featured blocks (Veeraswamy’s method)
Featured blocks surrounded by horizontal and vertical featured blocks (Veeraswamy’s method)
AC(0, 1)=0.231×(DC1−DC3) AC(0, 1)=0.231×(DC4−DC6) AC(0, 1)=0.231×(DC1−DC3) AC(1, 0)=0.231×(DC2−DC8) AC(1, 0)=0.231×(DC1−DC7) AC(1, 0)=0.231×(DC1−DC7) AC(0, 2)=0.15×(DC1−DC3) AC(0, 2)=0.118×(DC4+ DC6−2×DC5) AC(0, 2)=0.15×(DC1−DC3) AC(2, 0)=0.118×(DC2+ DC8−2×DC5) AC(2, 0)=0.15×(DC1−DC7) AC(2, 0)=0.15×(DC1−DC7)
AC(1, 1)=0.15×(DC1+ DC9−DC3−DC7) AC(1, 1)=0.15×(DC1+ DC9−DC3−DC7) AC(1, 1)=0.15×(DC1+ DC9−DC3−DC7)
2.3. Watermark Insertion. To describe the proposed method, we supposed that the original image (I) and created water-mark image (W) are grayscale images with sizeM×Nand L×K, respectively.
In the watermark embedding process, the original image is transformed to frequency domain by DCT. Because the JPEG standard is based on 8×8 block DCT, thus, block DCT with size of 8×8 is commonly used in image watermarking process to make it robust versus JPEG compression [29]. Based on this idea, the original image is divided into 8×8 nonoverlapping blocks and DCT is applied on each block. Next, the Dynamic Fuzzy Inference System (DFIS) is used to calculate theαkandβkfor each 8×8 DCT block of original image. Then, (L/b× K/b) number of blocks of original image with highestαkare selected for embedding watermark image, whereb×bis the size of DCT block of watermark. In the other side, the image that is created by described approach in Section 2.2 (used watermark) is divided into b×bnonoverlapping blocks and then DCT is performed on each block. Ifbis smaller thana(in the proposed method, the value of a is 8), more robustness against attacks and more visual enhanced extracted watermark can be achieved but the quality of watermarked image is decreased. Thus, b provides a tradeoffbetween robustness after attacks and quality of watermarked image. Finally, the DC value of each b ×b DCT block of the created watermark is embedded in DC value of each selected 8×8 DCT block of original image (based on (9)). Therefore, the watermarked image is created by modifying DC value of each 8×8 DCT block of the original image. As shown in Figure 8, the following steps are used to insert the watermark in the original image.
Algorithm 1 (The watermark embedding). We have the following.
Input: An original imageI, watermark (W).
Output: A watermarked imageIW.
Step 1. Divide the original imageI, into 8×8 nonoverlapping blocks and apply DCT on each block. Next, compute the HVS model properties as said inSection 2.1and computeαk andβkvalues of each block with Fuzzy Inference System as described inSection 2.1. Finally, sort blocks in descending order ofαkvalue of each block.
Step 2. Create used watermark (W) from original water-mark (W) as described inSection 2.2.
Step 3. Select first (L/b×K/b) blocks of sorted blocks which is computed inStep 1for embedding process (L×Kis size of created watermark).
Step 4. Use (9) for invisible insertion of the created water-mark (used waterwater-mark) into the DC coefficients of selected blocks of the original image:
X
DC,k=XDC,k+ϕk×βk×WDC, k, (9)
where Xk,DC and Xk,DC are DC coefficients in kth block
DCAC AC AC DC
AC AC AC AC
AC AC AC AC
AC AC AC AC
0 0 0 0 0
0 0
0 0 0 0
0 0 0 0 Set all AC
coefficients to zero
Divide the original watermark image intob×bnon-overlapping blocks and
perform the DCT on each block
Performed IDCT on each b×bnon-overlapping blocks
Created image for used as watermark Original watermark
(L×K) b
b
b
b
L/b
K/b
Figure7: The watermark creation procedure.
Generate pseudo-random number (ϕk)
Insert watermark
Original watermark (L×K)
Create image to use as watermark
Divide the used watermark intob×bnon-overlapping blocks and compute the
DCT on each block Divide the original image
into 8×8 non-overlapping blocks and compute the
DCT on each block
Compute theαkandβk values of each 8×8 DCT
block with DFIS
Select (L/b×K/b) blocks with highestαk
Seed key
W: Created watermark (L×K) I: Original image (M×N)
Iw: Watermarked image
Divide the original image into 8×8 non-overlapping
blocks and compute the DCT on each block
Generate pseudo-random number (ϕk)
Compute theαkandβk values of each 8×8 DCT
block with DFIS
Select (L/b×K/b) blocks with highestαk
Extract watermark
DC DC AC AC
AC
AC AC
0
0 0
0 0
0 0 0 0 0 0
0 0 0
0 0
0
0 0
0 0 0 0 0 0
Estimate
Perform IDCT on each b×bDCT block
b
b
b
b Seed key
into 8×8 non-overlapping blocks and compute the
DCT on each block Divide thewatermarkedimage I: Original image (M×N) Iw: Watermarked image (M×N)
W: Extracted watermark
Figure9: Proposed watermark extraction process.
(a) (b) (c) (d)
Figure10: (a) Original Lena image, (b) Original Baboon image, (c) Original Peppers image and (d) Original Crowd image.
controls the tradeoff between invisibility, robustness, and detection fidelity of watermarked image which is computed by DFIS as described in Section 2.1. The ϕk parameter is a pseudorandom (1, −1) bit pattern that determines the addition or subtraction involved at each position which
can be any arbitrarily chosen pseudorandom sequence. This parameter is just used for security purpose.
(a) (b) (c) (d)
Figure11: (a) and (c) Original watemarks, (b) and (d) Used watermarks.
(a) PSNR: 52.33 dB (b) PSNR: 52.44 dB (c) PSNR: 51.72 dB (d) PSNR: 51.38 dB
(e)γ=0.9974 (f) γ=0.9973 (g) γ=0.9979 (h)γ=0.9974
(i) PSNR: 52.92 dB (j) PSNR: 53.08 dB (k) PSNR: 52.27 dB (l) PSNR: 52.04 dB
(m)γ=0.9975 (n) γ=0.9970 (o)γ=0.9982 (p)γ=0.9971
Figure 12: (a)–(d) Watermarked images after embedding 128 ×128 watermark image as shown in Figure 11(b). (e)–(h) Extracted watermarks from (a)–(d), respectively. (i)–(l) Watermarked images after embedding 128×128 watermark image as shown inFigure 11(d). (m)–(p) Extracted watermarks from (i)–(l), respectively.
2.4. Watermark Extraction. The watermark extraction pro-cess is the reverse of embedding propro-cess and requires the original image. As illustrated in Figure 9, at first, the watermarked image (IW) and the original one (I) are divided into 8×8 nonoverlapping blocks and the DCT is performed on each block of images. Next, as described inSection 2.1, αkandβkvalues of each block in original image is computed
with DFIS and then the (L/b×K/b) number of blocks with highestαkare selected (L/b×K/bis number ofb×bblocks in watermark image andL×Kis size of it). Then, the DC coefficients of extracted watermark are computed as follows:
W DC,k=
X
DC,K−XDC,k
(a) PSNR: 48.27 dB (b) PSNR: 48.47 dB (c) PSNR: 47.94 dB (d) PSNR: 47.63 dB
(e)γ=0.9975 (f) γ=0.9966 (g) γ=0.9971 (h)γ=0.9965
(i) PSNR: 48.84 dB (j) PSNR: 49.11 dB (k) PSNR: 48.66 dB (l) PSNR: 48.26 dB
(m)γ=0.9972 (n) γ=0.9967 (o)γ=0.9969 (p)γ=0.9963
Figure 13: (a)–(d) Watermarked images after embedding 256 ×256 watermark image as shown in Figure 11(b). (e)–(h) Extracted watermarks from (a)–(d), respectively. (i)–(l) Watermarked images after embedding 256×256 watermark image as shown inFigure 11(d). (m)–(p) Extracted watermarks from (i)–(l), respectively.
where XDC, K and XDC,k are DC coefficients of kth block in watermarked image and original image, respectively and W
DC,kis DC coefficient ofkth block in extracted watermark. The βk parameter is a weighting factor which is computed inStep 1and theϕk parameter is a pseudorandom (1,−1) bit pattern that generated with arbitrary seed and used in insertion process.
Finally, the WDC, k values and estimation formulas as described inSection 2.2are used to create theb×bDCT blocks of watermark then by performing Block-wise inverse DCT, watermark in spatial domain is created. The following steps are used for watermark Extraction.
Algorithm 2 (The watermark extraction). We have the following.
Input: An original image (I) and watermarked image (IW).
Output: An extracted watermark (W).
(a) PSNR=34.89 dB (b) PSNR=31.71 dB (c) PSNR=32.32 dB (d) PSNR=27.72 dB
(e)γ=0.7689 (f) γ=0.7120 (g) γ=0.5794 (h)γ=0.4493
(i) PSNR=34.91 dB (j) PSNR=31.73 dB (k) PSNR=32.35 dB (l) PSNR=27.72 dB
(m)γ=0.8319 (n) γ=0.7029 (o)γ=0.5629 (p)γ=0.4065
Figure14: (a)–(d) The watermarked Lena, Baboon, Peppers and Crowd images with 256×256 watermark image as shown inFigure 11(b) after JPEG compression with quality factor 40%, 30%, 20% and 10%, respectively. (e)–(h) The extracted watermarks (256×256) from (a)–(d), respectively. (i)–(l) The watermarked Lena, Baboon, Peppers and Crowd images with 256×256 watermark image as shown in Figure 11(d)after JPEG compression with quality factor 40%, 30%, 20% and 10%, respectively. (m)–(p) The extracted watermarks (256×
256) from (i)–(l), respectively.
Step 2. Select first (L/b×K/b) blocks of sorted blocks which is computed in Step 1 for extracting process.L/b×K/b is number ofb×bblocks in watermark andL×K is size of watermark.
Step 3. Divide the watermarked image IW into 8 × 8 nonoverlapping blocks and compute the DCT on each block.
Step 4. Extract the watermark from selected blocks use (10).
Step 5. Estimate AC coefficients of each block in extracted watermark fromStep 4, then useb×b Block-wise inverse DCT to create extracted watermark in spatial domain (W). If the input watermark image is present in the extracted image, then the ownership is approved.
3. Structural Comparison of Proposed Method
with Related Ones
The employed techniques in proposed method make it more robust and its results with more quality. In this section, the differences and excellences of proposed method with two related methods [24, 27] are introduced in four conventional different steps of watermarking methods: (1) selecting embedding area procedure, (2) watermark creation procedure, (3) inserting procedure, (4) extracting procedure. Also, the motivation of proposed method is implied in subsections.
(a) PSNR=35.04 dB (b) PSNR=31.78 dB (c) PSNR=32.41 dB (d) PSNR=27.74 dB
(e)γ=0.8318 (f) γ=0.8090 (g) γ=0.7555 (h)γ=0.6239
(i) PSNR=35.05 dB (j) PSNR=31.79 dB (k) PSNR=32.42 dB (l) PSNR=27.75 dB
(m)γ=0.8673 (n) γ=0.7774 (o)γ=0.7275 (p)γ=0.5601
Figure15: (a)–(d) The watermarked Lena, Baboon, Peppers and Crowd images with 128×128 watermark image as shown inFigure 11(b) after JPEG compression with quality factor 40%, 30%, 20% and 10%, respectively. (e)–(h) The extracted watermarks (128×128) from (a)–(d), respectively. (i)–(l) The watermarked Lena, Baboon, Peppers and Crowd image with 128×128 watermark images as shown in Figure 11(d)after JPEG compression with quality factor 40%, 30%, 20% and 10%, respectively. (m)–(p) The extracted watermarks (128×
128) from (i)–(l), respectively.
of original image, where the size of subimage is equal to size of watermark (L×K) to embed the watermark in it. To find this subimage, the properties of Human Visual System (HVS) such as Luminance, Edginess, Contrast, Location and Texture are calculated for eachL×Ksubimage of original image and the high score one is selected as most perceptually important region of original image and watermark is embedded in it. As result, this method is not robust to geometrical attacks such as Tampering, Data block removal and Cropping; because the watermark is embedded in consecutive blocks (subimage) of original image. For example if this region of watermarked image is cropped or tampered, the whole watermark is removed and the extraction procedure cannot find any watermark in the test image (see Section 4.3). But, in the proposed method, blocks of the watermark are not embedded in consecutive blocks of original image and embedded in nonconsecutive blocks of original image. As result, the proposed method is more robust versus many
geometrical attacks such as Tampering, Data block removal, and Cropping (see Sections4.2and4.3).
In Asatryan’s method [27] that inserts the watermark in spatial domain, all pixels of original image are used to embed the watermark. Therefore, the quality of watermarked image in this method is degraded and artifact is produced in watermarked image (seeSection 4.3).
3.2. Watermark Creation Procedure. Mohanty’s method cre-ate synthetic image by using 8 ×8 DCT coefficients of selected subimage of original image and Gaussian, Laplacian distributions for DC, AC coefficients, respectively. Then, the original watermark is embedded in the created synthetic image using any DCT-based visible watermarking algorithm to create used watermark.
(a) PSNR=35.22 dB (b) PSNR=33.93 dB (c) PSNR=38.17 dB (d) PSNR=47.02 dB
(e)γ=0.5387 (f) γ=0.7754 (g) γ=0.9579 (h)γ=0.9957
Figure16: (a)–(d) The watermarked Lena, Baboon, Peppers and Crowd images with 256×256 watermark image after wavelet compression with quality factor 0.4 bpp, 0.8 bpp, 1.5 bpp and 3.5 bpp, respectively. (e)–(h) The extracted watermarks (256×256) from (a)–(d), respectively.
In the proposed method the used watermark is created by dividing the original watermark into b×bDCT blocks and changing the AC coefficients of each block to zero. The b parameter provides a tradeoff between quality of watermarked image and extracted watermark. The proposed creation watermark procedure is acceptable because the watermark image that creates by only DC coefficients of each b×b (where b < 8; e.g., b = 4) DCT block of original watermark is perceptually similar as original one. Also, the AC coefficients estimating formulas that propose in [4] can be used to increase the quality of created watermark.
3.3. Inserting Procedure. In the Mohanty’s method the used watermark is embedded into the original image by fusing the DCT coefficients of used watermark blocks with the corresponding blocks of the selected subimage. In the other hand, the DCT coefficients of each 8×8 DCT block of used watermark is embedded in corresponding 8×8 DCT block of selected subimage. As result, the robustness of mohanty’s method decreases because the AC coefficients of DCT block is not robust to many attacks such as Low Pass Filtering, Compression, Median Filtering. Therefore, the many of embedded AC coefficients of used watermark are degraded after such attacks. To solve this drawback, in the proposed method, the coefficients ofb×b(whereb < 8) DCT blocks of used watermark are embedded only in DC coefficients of each 8×8 DCT block of original image. As result, the robustness of proposed method is higher than mohanty’s method,because the DC coefficients of DCT block is robust than AC coefficients of one.
The Asatryan’s method works in spatial domain to embed the watermark in original image. In this method, the values of 32×32 block DCT coefficients of compressed watermark are mapped to the interval [0,255] by fixed linear transform
and the mapped values of DCT coefficients are embedded in pixel values of each block of original image. As result, because the embedding is done in special domain, the robustness of this method is decreased and the quality of watermarked image is low (see Section 4.3). Also, mapping the DCT coefficients to the interval [0,255] may be caused distortion in the extracted watermark.
The weighted factor (β) is used in all three methods. The value of this parameter is 0.02 for DC and 0.1 for AC coefficients in Mohanty’s method and 0.07 for all pixels in Asatryan’s method. But, in the proposed method, the value of this parameter for each DCT block is based on Texture and Luminance of this block. It is based on idea that modification inside a highlytextured block is unnoticeable to the human eye and the brighter the background is the lower the visibility of the embedded watermark. Therefore, the proposed method produces a watermarked image with higher quality than two related methods.
3.4. Extracting Procedure. The Mohanty’s method use a reverse embedding procedure to extract the DCT coefficients of each 8×8 DCT block of watermark and applied IDCT to create watermark in spatial domain. But in proposed method a reverse embedding procedure is performed to extract the only DC coefficients of eachb×bDCT block of watermark. Then the estimation formulas are used to evaluate the AC coefficients of each b ×b DCT block (e.g., first five AC coefficients when b = 4) of watermark and applied IDCT to create watermark in spatial domain.
(a) PSNR=26.95 dB (b) PSNR=27.08 dB (c) PSNR=27.08 dB (d) PSNR=26.96 dB
(e)γ=0.6630 (f) γ=0.6494 (g) γ=0.7975 (h)γ=0.7497
(i) PSNR=26.98 dB (j) PSNR=27.08 dB (k) PSNR=27.07 dB (l) PSNR=26.94 dB
(m)γ=0.7032 (n) γ=0.7643 (o)γ=0.6143 (p)γ=0.6070
Figure17: (a) and (b) Lena and Peppers watermarked imageswith 256×256 watermark image as shown inFigure 11(b)after adding Gaussian noise with mean=0 and variance=0.002, (e) and (f) the extracted watermarks with size 256×256 from (a) and (b), respectively. (c) and (d) Crowd and Baboon watermarked images with 128×128 watermark image as shown inFigure 11(b)after adding Gaussian noise. (g) and (h) The extracted watermarks with size 128×128 from (c) and (d), respectively. (i) and (j) Lena and Peppers watermarked images with 128×128 watermark image as shown inFigure 11(d)after adding Gaussian noise, (m) and (n) the extracted watermarks with size 128×128 from (i) and (j), respectively. (k) and (l) Crowd and Baboon watermarked images with 256×256 watermark image as shown in Figure 11(d)after adding Gaussian noise. (o) and (p) The extracted watermarks with size 256×256 from (k) and (l), respectively.
the watermark in spatial domain. The steps of Mohanty’s method, Asatryan’ method and proposed watermarking method are summarized inTable 3.
4. Experimental Results
The proposed algorithm has been tested on different images and a big set of grayscale watermark images but only results for four popular images and two logos with different sizes are presented here. The selected logos areTexas University
andShahidBeheshti University ones. We have chosenLena, Baboon,PeppersandCrowdgrayscale images with size 512×
Table3: Comparing the structures of D. Asatryan and N. Asatryan [27], Mahanty and Bhargava [24], and proposed watermarking methods. Watermarking methods
Block size of original image
Mohanty’s method [24] Asatryan’s method [27] Proposed method
8×8 M/K×N/L 8×8
Selection embedding area procedure
(1) Find a most perceptually significant set of blocks constituting a subimage (equal to size of watermark) with respect to human perception such as Texture, Location, Contrast, Luminance, and Edginess in original image.
(1) All blocks of original image are used to embed a watermark
(1) Calculate the Texture, Luminance, and Location of each 8×8 DCT block in original image.
(2) Use proposed Fuzzy Interface System to calculate the suitabilityfactor of each block.
(3) Select (L/b×K/b) blocks with higher suitability factor to embed a watermark.
Block size of
watermark 8×8 32×32 b×b
Watermark creation procedure
(2) Create synthetic image by using 8×8 DCT coefficients of most perceptually important subimage of original image and Gaussian/Laplacian distribution for DC, AC coefficients, respectively.
(3) Embed the watermark in the synthetic image using any DCT-based visible watermarking algorithm.
(2) Compression was performed on watermark image until the number of chosen DCT coefficients of each 32×32 DCT block was significantly smaller than the number of pixels of the original watermark.
(3) The values of DCT coefficients are mapped to the interval [0,255] by fixed linear transform.
(4) Change the AC coefficients of each b×bDCT block to zero and apply IDCT to create used watermark.
Inserting procedure
(4) The used watermark is now invisibly embedded into the original image by fusing the compound watermark blocks with the
corresponding blocks of the selected perceptually important subimage of the original.
(4) Embed each mapped DCT coefficient of watermark in each pixel of block of original image.
(5) Embed DC coefficient of each b×bDCT block of used watermark in DC coefficient of selected 8×8 DCT block of original image.
Value ofβ coefficient (weighing factor)
βi,j,k= ⎧ ⎪ ⎨ ⎪ ⎩
0.02 for DC coefficients
0.1 for AC coefficients β=0.07 for all pixels
βkis different for each 8×8 DCT block of original image and is computed by proposed Fuzzy Interface System based on Texture and
Luminance of selected block.
Extracting procedure
(1) Select subimage of original image where the watermark was embedded in it.
(2) Use the reverse embedding procedure to extract the DCT coefficients of watermark. (3) Apply IDCT on each extracted 8×8 DCT block to create watermark in spatial domain.
(1) Use the reverse embedding procedure to extract the mapped DCT coefficients of watermark.
(2) The reverse of linear transform where used in embedding process is utilized to create the DCT coefficients of watermark.
(3) Apply IDCT on each extracted DCT block to create watermark in spatial domain.
(1) Select blocks of original image where the watermark was embedded in them.
(2) Use the reverse embedding procedure to extract the DC
coefficients of eachb×bDCT block of used watermark.
(3) The extracted DC coefficients are used to estimate the AC coefficients of eachb×bDCT block of watermark. (4) Apply IDCT on each estimated b×bDCT block to create watermark in spatial domain.
The experiments confirmed the effectiveness of the pro-posed algorithm in producing visually pleasing watermarked images and in addition the extracted watermark was visually recognizable and similar to both inserted watermark and original watermark. Our scheme requires one key as seed of random number generator to be stored for extraction phase, so this method has no storage overhead. After the watermark is embedded into the original image, the PSNR (Peak Signal to Noise Ratio) is used to evaluate thequality
of the watermarked image. The MSE and PSNR values in decibels (dB) are defined as follows:
PSNR=10 log10
2552
MSE
,
MSE=M×1 N
M−1
i=0
N−1
j=0
Xij−Xij
2
,
(a) PSNR=33.25 dB (b) PSNR=32.28 dB (c) PSNR=30.11 dB (d) PSNR=28.67 dB
(e)γ=0.8948 (f)γ=0.8994 (g)γ=0.7074 (h)γ=0.7940
(i) PSNR=33.33 dB (j) PSNR=32.34 dB (k) PSNR=30.07 dB (l) PSNR=28.64 dB
(m)γ=0.8646 (n) γ=0.8598 (o)γ=0.6502 (p)γ=0.7751
Figure 18: (a) and (b) The Lena and Peppers watermarked images with 256 × 256 watermark image as shown in Figure 11(b)after performing Gaussian lowpass filter with window size 5×5, (e) and (f) the extracted watermarks with size 256×256 from (a) and (b), respectively. (c) and (d) Crowd and Baboon watermarked images with 128×128 watermark image as shown inFigure 11(b)after performing Gaussian lowpass filter, (g) and (h) the extracted watermarks with size 128×128 from (c) and (d), respectively. (i) and (j) Lena and Peppers watermarked images with 128×128 watermark image as shown inFigure 11(d)after performing Gaussian lowpass filter, (m) and (n) the extracted watermarks with size 128×128 from (i) and (j), respectively. (k) and (l) Crowd and Baboon watermarked images with 256×256 watermark image as shown inFigure 11(d)after performing Gaussian lowpass filter, (o) and (p) the extracted watermarks with size 256×256 from (k) and (l), respectively.
whereXij represents the (i,j) pixel value of original image and Xij represents the (i,j) pixel value of watermarked image. The other metric used to test the quality of the retrieved watermark image is Normalized Cross Correlation (NCC). It is defined as follows:
γ=
i,j
w
i,j−w
wi,j−w
i,j
w
i,j−w
2
i,j
wi,j−w
2, (12)
where w and w are extracted watermark and inserted watermark images, respectively, andwandware their pixels
mean values, respectively. The subscripts i, j of w or w denote the index of an individual pixel of the corresponding image. The summations are over all the image pixels.
(a) PSNR=29.60 dB (b) PSNR=29.08 dB (c) PSNR=25.31 dB (d) PSNR=24.34 dB
(e)γ=0.8577 (f) γ=0.8621 (g) γ=0.6194 (h)γ=0.7174
(i) PSNR=29.63 dB (j) PSNR=29.11 dB (k) PSNR=25.30 dB (l) PSNR=24.33 dB
(m)γ=0.8172 (n) γ=0.8074 (o)γ=0.5654 (p)γ=0.6998
Figure19: (a) and (b) Lena and Peppers watermarked images with 256×256 watermark image as shown inFigure 11(b)after performing Average filter with window size 5×5, (e) and (f) the extracted watermarks with size 256×256 from (a) and (b), respectively. (c) and (d) Crowd and Baboon watermarked images with 128×128 watermark image as shown inFigure 11(b)after performing Average filter, (g) and (h) the extracted watermarks with size 128×128 from (c) and (d), respectively. (i) and (j) Lena and Peppers watermarked images with 128×128 watermark image as shown inFigure 11(d)after performing Average filter, (m) and (n) the extracted watermarks with size 128×128 from (i) and (j), respectively. (k) and (l) Crowd and Baboon watermarked images with 256×256 watermark image as shown in Figure 11(d)after performing Average filter, (o) and (p) the extracted watermarks with size 256×256 from (k) and (l), respectively.
StirMarkMATLABsoftware that contains approximately 90 different types of image manipulations. But, in the following subsections, we will present only the experimental results for test images, and nongeometric and geometric attacks such as Compression, Noise addition, Filtering, Cropping, Changing Aspect Ratio, Tampering and Scaling on the watermarked images to evaluate the robustness of the proposed scheme.
4.1. Quality of Watermarked Image and Extracted Watermark before Attack. Four selected images that used in embedding
processare shown inFigure 10. Also, we used two watermarks inFigure 11 at two sizes (128×128 and 256×256) to be embedded in these original images. The watermarked images and the extracted watermarks with corresponding PSNR with different size of watermarks (128×128 and 256×256) are shown in Figures12and13, respectively.
(a) PSNR=29.12 dB (b) PSNR=28.81 dB (c) PSNR=24.66 dB (d) PSNR=23.89 dB
(e)γ=0.9407 (f) γ=0.9404 (g) γ=0.8287 (h)γ=0.8830
(i) PSNR=29.14 dB (j) PSNR=28.83 dB (k) PSNR=24.65 dB (l) PSNR=23.88 dB
(m)γ=0.9191 (n) γ=0.9215 (o)γ=0.7743 (p)γ=0.8701
Figure20: (a) and (b) Lena and Peppers watermarked images with 256×256 watermark image as shown inFigure 11(b)after Bluring with radius 3, (e) and (f) the extracted watermarks with size 256×256 from (a) and (b), respectively. (c) and (d) Crowd and Baboon watermarked images with 128×128 watermark image as shown inFigure 11(b)after Bluring, (g) and (h) the extracted watermarks with size 128×128 from (c) and (d), respectively. (i) and (j) Lena and Peppers watermarked images with 128×128 watermark image as shown inFigure 11(d)after Bluring, (m) and (n) the extracted watermarks with size 128×128 from (i) and (j), respectively. (k) and (l) Crowd and Baboon watermarked images with 256×256 watermark image as shown inFigure 11(d)after Bluring, (o) and (p) the extracted watermarks with size 256×256 from (k) and (l), respectively.
PSNR value for the watermarked images was approximately 49 dB, where the size of watermark images is 256×256. So, the watermark embedding process produced high-quality watermarked images.
4.2. Quality of Watermarked Image and Extracted Watermark versus Various Attacks. In the following experiment, we used several image manipulations, including Compression, Noise addition, Filtering, Cropping, Changing aspect ratio, Tampering, Copy attack, Scaling and Composite attacks on the watermarked images to evaluate the robustness of the proposed scheme.
4.2.1. Compression
JPEG Compression. Using image compression before storing and transmitting images is very common. JPEG fromJoint Photographic Experts Grouphas been funded its way through digital imaging and is very popular image compression tool for still images. So we evaluated the robustness of the pro-posed scheme by compressing the watermarked images with different JPEG quality factors. Figures 14(a)–14(d),14(i)–
(a) PSNR=25.34 dB (b) PSNR=25.15 dB (c) PSNR=23.28 dB (d) PSNR=21.10 dB
(e)γ=0.7308 (f) γ=0.7144 (g) γ=0.6174 (h)γ=0.5034
(i) PSNR=25.39 dB (j) PSNR=25.20 dB (k) PSNR=23.27 dB (l) PSNR=21.08 dB
(m)γ=0.6679 (n) γ=0.6684 (o)γ=0.3421 (p)γ=0.4626
Figure21: (a) and (b) Lena and Peppers watermarked images with 256×256 watermark image as shown inFigure 11(b)after Sharpening, (e) and (f) the extracted watermarks with size 256×256 from (a) and (b), respectively. (c) and (d) Crowd and Baboon watermarked images with 128×128 watermark image as shown inFigure 11(b)after Sharpening, (g) and (h) the extracted watermarks with size 128×128 from (c) and (d), respectively. (i) and (j) Lena and Peppers watermarked images with 128×128 watermark image as shown inFigure 11(d) after Sharpening, (m) and (n) the extracted watermarks with size 128×128 from (i) and (j), respectively. (k) and (l) Crowd and Baboon watermarked images with 256×256 watermark image as shown inFigure 11(d)after Sharpening, (o) and (p) the extracted watermarks with size 256×256 from (k) and (l), respectively.
the extracted watermark from Figures 14(a)–14(d), 14(i)–
14(l), respectively. Also, Figures 15(a)–15(d), 15(i)–15(l)
show the watermarked images with watermark size 128×128 after JPEG compression with quality factor 40%, 30%, 20% and 10% for Lena, Baboon, Peppers and Crowd images, respectively and Figures15(e)–15(h),15(m)–15(p)show the extracted watermark from Figures15(a)–15(d),15(i)–15(l), respectively. The results show that the proposed scheme is robust against JPEG image compression and the extracted watermarks are visually similar to inserted watermark under different quality factors of JEPG compression.
Wavelet Compression (JPEG2000). We evaluated the robust-ness of proposed method against another version of com-pression that is wavelet comcom-pression. Figures 16(a)–16(d)
show the results of applying wavelet compression on Lena, Baboon, Peppers and crowd images with compression ratio 0.4 bpp, 0.8 bpp, 1.5 bpp and 3.5 bpp, respectively. The extracted watermarks that shown in Figures16(e)–16(h)are still visually detectable after this attack.
(a) PSNR=31.17 dB (b) PSNR=32.08 dB (c) PSNR=26.46 dB (d) PSNR=24.60 dB
(e)γ=0.8768 (f) γ=0.8818 (g) γ=0.6537 (h)γ=0.5993
(i) PSNR=31.22 dB (j) PSNR=32.14 dB (k) PSNR=26.48 dB (l) PSNR=24.59 dB
(m)γ=0.8426 (n) γ=0.8476 (o)γ=0.6247 (p)γ=0.6046
Figure22: (a) and (b) Lena and Peppers watermarked images with 256×256 watermark image as shown inFigure 11(b)after applying Median filter with window size 5×5, (e) and (f) the extracted watermarks with size 256×256 from (a) and (b), respectively. (c) and (d) Crowd and Baboon watermarked images with 128×128 watermark image as shown inFigure 11(b)after appling Median filter, (g) and (h) the extracted watermarks with size 128×128 from (c) and (d), respectively. (i) and (j) Lena and Peppers watermarked images with 128×128 watermark image as shown inFigure 11(d)after appling Median filter, (m) and (n) the extracted watermarks with size 128×128 from (i) and (j), respectively. (k) and (l) Crowd and Baboon watermarked images with 256×256 watermark image as shown inFigure 11(d)after appling Median filter, (o) and (p) the extracted watermarks with size 256×256 from (k) and (l), respectively.
0 and variance=0.002 on the watermarked images. Figures
17(a)–17(d),17(i)–17(l)show the results of adding Gaussian noise. The extracted watermarks are still visually detectable after this attack (as shown in Figures 17(e)–17(h),17(m)–
17(p). It indicates that the proposed scheme is also robust to noise attack.
4.2.3. Filtering. The robustness of watermarking scheme has been also tested by performing various filters such as sharpening, Gaussian lowpass filter, averaging, median, and blurring on the watermarked images. Figures18(a)–18(d),
18(i)–18(l) show the resultant images after performing Gaussian lowpass filter with window size 5×5. Figures18(e)–
18(h), 18(m)–18(p) show the extracted watermarks and correspondingγ values. The extracted watermarks are still visually detectable after this attack. It indicates that the pro-posed scheme is also robust to Gaussian lowpass filter attack. Figures 19(a)–19(d), 19(i)–19(l) show the resultant images by averaging filter with window size 5×5. Figures
(a) PSNR=33.94 dB (b) PSNR=31.85 dB (c) PSNR=31.85 dB (d) PSNR=29.29 dB
(e)γ=0.9528 (f) γ=0.9402 (g) γ=0.8835 (h)γ=0.8860
(i) PSNR=34.06 dB (j) PSNR=31.93 dB (k) PSNR=31.79 dB (l) PSNR=29.26 dB
(m)γ=0.9462 (n) γ=0.9142 (o)γ=0.8651 (p)γ=0.8702
Figure23: (a) and (b) Lena and Peppers watermarked images with 256×256 watermark image as shown inFigure 11(b)after Scaling (1/2), (e) and (f) the extracted watermarks with size 256×256 from (a) and (b), respectively. (c) and (d) Crowd and Baboon watermarked images with 128×128 watermark image as shown inFigure 11(b)after Scaling (1/2), (g) and (h) the extracted watermarks with size 128×128 from (c) and (d), respectively. (i) and (j) Lena and Peppers watermarked images with 128×128 watermark image as shown inFigure 11(d) after Scaling (1/2), (m) and (n) the extracted watermarks with size 128×128 from (i) and (j), respectively. (k) and (l) Crowd and Baboon watermarked images with 256×256 watermark image as shown inFigure 11(d)after Scaling (1/2), (o) and (p) the extracted watermarks with size 256×256 from (k) and (l), respectively.
Figures 20(a)–20(d), 20(i)–20(l) show the resultant images after blurring with radius 3. Figures 20(e)–20(h),
20(m)–20(p) show the extracted watermarks and their γ values. The extracted watermarks are still visually detectable after this attack. It indicates that the proposed scheme is also robust to blurring attack.
Figures 21(a)–21(d), 21(i)–21(l) show the resultant images by sharpening. Figures 21(e)–21(h), 21(m)–21(p)
show the extracted watermarks. Also, Figures22(a)–22(d),
22(i)–22(l)show the resultant images after median filtering with window size 5×5. Figures22(e)–22(h),22(m)–22(p)
show the extracted watermarks and theirγvalues. The test results show that the watermark image can also detectable after the filter attacks. (it is worth mentioning that because we zoomed out images in the paper the effects of some filters are not visible in these sizes).
(a) PSNR=28.80 dB (b) PSNR=28.00 dB (c) PSNR=24.00 dB (d) PSNR=23.58 dB
(e)γ=0.7144 (f) γ=0.6931 (g) γ=0.6285 (h)γ=0.4076
(i) PSNR=28.83 dB (j) PSNR=28.02 dB (k) PSNR=23.99 dB (l) PSNR=23.57 dB
(m)γ=0.6494 (n) γ=0.6022 (o)γ=0.3308 (p)γ=0.4237
Figure24: (a) and (b) Lena and Peppers watermarked images with 256×256 watermark image as shown inFigure 11(b)after Scaling (1/4), (e) and (f) the extracted watermarks with size 256×256 from (a) and (b), respectively. (c) and (d) Crowd and Baboon watermarked images with 128×128 watermark image as shown inFigure 11(b)after Scaling (1/4), (g) and (h) the extracted watermarks with size 128×128 from (c) and (d), respectively. (i) and (j) Lena and Peppers watermarked images with 128×128 watermark image as shown inFigure 11(d) after Scaling (1/4), (m) and (n) the extracted watermarks with size 128×128 from (i) and (j), respectively. (k) and (l) Crowd and Baboon watermarked images with 256×256 watermark image as shown inFigure 11(d)after Scaling (1/4), (o) and (p) the extracted watermarks with size 256×256 from (k) and (l), respectively.
Scaling. In this experimental the watermarked images are reduced to 1/2 and 1/4 of its original size. In order to detect the watermark, the reduced images are recovered to its original dimension, respectively. Figures23(a)–23(d),23(i)–
23(l) show the watermarked image after reducing to 1/2 and recovering to original dimension. Figures23(e)–23(h),
23(m)–23(p) show the extracted watermark from Figures
23(a)–23(d),23(i)–23(l), respectively.
Figures24(a)–24(d),24(i)–24(l)show the watermarked image after reducing to 1/4 and recovering to original dimension. Figures 24(e)–24(h), 24(m)–24(p) show the
extracted watermark from Figures24(a)–24(d),24(i)–24(l)
and corresponding γ values, respectively. The test results show that the watermark image can also detectable after the scaling attacks.
(a) PSNR=18.01 dB (b) PSNR=21.01 dB (c) PSNR=16.56 dB (d) PSNR=14.63 dB
(e)γ=0.4506 (f)γ=0.4206 (g) γ=0.5325 (h) γ=0.7223
Figure25: (a)–(d) the watermarked Lena, Baboon, Peppers and Crowd images after cropping, respectively. (e)–(h) the extracted watermarks from (a)–(d), respectively.
(a) PSNR=27.50 dB (b) PSNR=26.49 dB (c) PSNR=24.45 dB (d) PSNR=26.36 dB
(e)γ=0.6733 (f) γ=0.5809 (g) γ=0.6440 (h)γ=0.5666
Figure26: (a) and (b) The watermarked Lena and Peppers images after changing aspect ratio attack (X=1,Y =1.2), respectively. (c) and (d) the watermarked Baboon and Crowd images after changing aspect ratio attack (X =0.8,Y =1), respectively. (e)–(h) The extracted watermarks from (a)–(d), respectively.
Changing Aspect Ratio. In this experiment, the robustness of proposed method was tested by changing aspect ratio of watermarked image. Figures26(a)and26(b)show the Lena and Peppers images after changing aspect ratio (X = 1, Y =1.2) of these images and Figures26(c)and26(d)show the Baboon and Crowd images after changing aspect ratio (X=0.8,Y =1) of these images. To extract the watermark, the images were rescaled to original size (512×512) and the extracted watermarks from these figures are shown in Figures
26(e)–26(h).
(a) PSNR=15.35 dB (b) PSNR=19.59 dB (c) PSNR=16.37 dB (d) PSNR=18.46 dB
(e)γ=0.7167 (f) γ=0.9090 (g) γ=0.7598 (h)γ=0.8415
(i) PSNR=15.33 dB (j) PSNR=14.49 dB (k) PSNR=15.87 dB (l) PSNR=14.63 dB
(m)γ=0.7698 (n) γ=0.7702 (o)γ=0.7816 (p)γ=0.6724
Figure 27: (a)–(d) The watermarked Lena, Baboon, Peppers and Crowd images after tampering, respectively. (e)–(h) The extracted watermarks from (a)–(d), respectively. (i)–(l) The watermarked Lena, Baboon, Peppers and Crowd images after data blocks removal, respectively. (m)–(p) The extracted watermarks from (i)–(l), respectively.
from Figures27(i)–27(l), respectively. As result, the extracted watermark after such attacks are still visually detectable and the proposed method is robust to tampering and data blocks removal.
Copy Attack. The copy attack has been used to create the false positive problem and operated as follow: (1) a watermark is first predicted from watermarked image, (2) the predicted watermark into a target image to create counterfeit watermarked image, (3) from the counterfeit image, a watermark can be detected that wrongly claims rightful ownership.
In this experiment, the robustness of proposed water-marking method was tested by applying copy attack on
watermarked image. Figures28(a)and28(b)show the Lena and Peppers watermarked imageswith 256×256 watermark image as shown inFigure 11(b)and Figures28(c)and28(d)
show the Lena and Peppers watermarked imageswith 256×
256 watermark image as shown in Figure 11(d). Figures
28(e)–28(h) show the counterfeit watermarked image with Figures28(a)–28(d), respectively. The extracting watermarks from Figures 28(e)–28(h) are shown in Figures 28(i)–
28(l), respectively. Therefore, the proposed method is robust against copy attack.
(a) PSNR=48.27 dB (b) PSNR=48.47 dB (c) PSNR=48.66 dB (d) PSNR=48.26 dB
(e) (f) (g) (h)
(i)γ=0.0145 (j)γ= −0.1253 (k)γ= −0.0246 (l)γ= −0.0057
Figure28: (a) and (b) Lena and Peppers watermarked images with 256×256 watermark image as shown inFigure 11(b), (e) and (f) the counterfeit watermarked image with (a) and (b), respectively. (c) and (d) The Crowd and Baboon watermarked images with 256×256 watermark image as shown inFigure 11(d), (g) and (h) the counterfeit watermarked image with (c) and (d), respectively. (i)–(l) the extracted watermark from (e)–(h), respectively.
Figures 29(a)–29(h) show the watermarked images after different composite attacks and Figures29(i)–29(p)show the extracted watermarks from Figures29(a)–29(h), respectively. Therefore, the experimental results presented on the quality and recognize ability demonstrates the performance of our method under various attacks.
4.3. Comparison with Other Related Methods. In this sub-section, the results of proposed method are compared with two related ones which have been presented by Mahanty and Bhargava [24] and D. Asatryan and N. Asatryan [27]. The comparison is based on four metrics: (1) average execution time for watermark insertion (2) PSNR value of watermarked image, (3) PSNR or correlation value (γ) value of extracted watermark and (4) error rate of detecting watermark.
These three methods were implemented on a personal computer with 1.66 GHZ of CPU and 2 GB of RAM and the average execution time of proposed method for watermark insertion was approximately 2 sec for an image with size 512
×512 pixels and watermark image with size 128×128 pixels. The execution time for Mohanty method was 4 sec that is approximately 50% higher in time than proposed algorithm and 1 sec for Asatryan method that is approximately 50% lower than proposed algorithm.
(a) PSNR=31.17 dB Wiener filter (3×3) + Scaling (1/2) + JPEG(80)
(b) PSNR=27.08 dB Softthreshold + Blurring (1) + JPEG(85)
(c) PSNR=24.46 dB Hardthresh-old + Averagefiltr (3×3) + JPEG(80)
(d) PSNR=24.60 dB Templatere-moval + Scalin (1/2) + JPEG(85)
(e) PSNR=31.22 dB Blurring (2) + JPEG(80)
(f) PSNR=32.14 dB Median filter (3×3) + JPEG(85)
(g) PSNR = 26.48 dB Sharpening (1) + JPEG(90)
(h) PSNR=24.59 dB Blurring (2) + JPEG(80)
(i)γ=0.8768 (j)γ=0.7999 (k)γ=0.7472 (l)γ=0.6889
(m)γ=0.7560 (n) γ=0.7983 (o)γ=0.4247 (p)γ=0.8098
Figure29: (a)–(h) The watermarked image after different composite attacks, (i)–(k) The extracted watermark from (a)–(h), respectively.
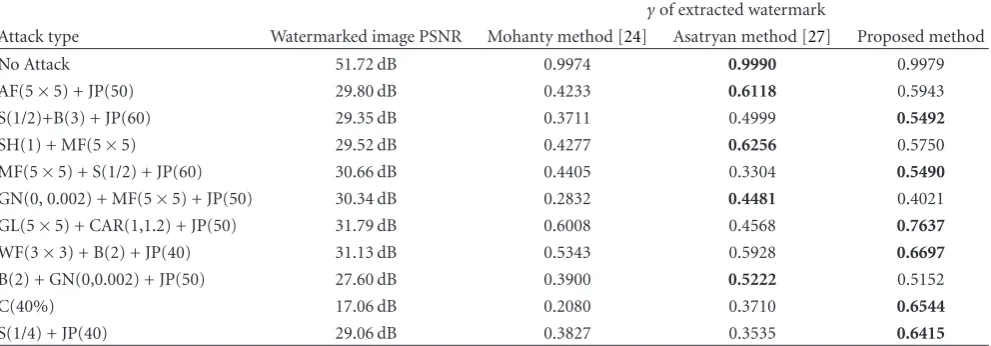
PSNR of watermarked images and extracted watermarks. As it is shown in this table, the proposed method out-performs than two related methods in term of PSNR of watermarked images and extracted watermark after different attacks.
Finally, as Table 5 shows, the comparison results have demonstrated that our method is capable of detecting watermarks at lower error rates than two related methods and can more effectively stay robust under image processing attacks. Also, Table 6 shows PSNR value of watermarked image by different methods. The best value in each row of these tables has been bolded.
The quality of extracted watermark by proposed method and two related ones versus different attacks are summarized
Table4: Comparison of proposed method and two related methods.
Host image size Watermark size Average PSNR of watermarked Image
Average PSNR of extracted watermark after different attacks
Proposed method
Mohanty method [24]
Asatryan method [27]
Proposed method
Mohanty method [24]
Asatryan method [27] 512×512 256×256 49.81dB 39.44 dB 34.72 dB 19.69dB 16.04 dB 18.10 dB 512×512 128×128 53.15dB 42.31 dB 35.63 dB 18.68dB 15.57 dB 17.96 dB 256×256 128×128 48.18dB 37.98 dB 33.55 dB 20.70dB 16.93 dB 18.79 dB 256×256 64×64 52.90dB 41.09 dB 34.73 dB 18.74dB 15.59 dB 18.52 dB
Table5: Error rates of detecting watermark.
Attack type Proposed method Mohanty method [24] Asatryan method [27]
Attack-free 0/2500 0/2500 0/2500
Blurring (2,3) 2/2500 2/2500 2/2500
Sharpening(1) 3/2500 4/2500 1/2500
Median Filter (5×5,7×7) 0/2500 3/2500 5/2500
Gaussian Noise (0.001, 0.002) 3/2500 3/2500 2/2500
Gaussian Low Pass Filter (3×3,5×5) 0/2500 0/2500 1/2500
Cropping (40%, 50%, 60%) 1/2500 20/2500 1/2500
Scaling (1/2, 1/4) 2/2500 3/2500 7/2500
JEPG Compression (10,20,30,40) 3/2500 6/2500 1/2500
Tampering 0/2500 8/2500 2/2500
Data Block Removal 0/2500 5/2500 1/2500
Composite Attack 3/2500 13/2500 21/2500
Total 16 67 44
Table6: PSNR value of watermarked image (512×512) by several methods. PSNR of watermarked image
Image Watermark Watermark size Mohanty method [24] Asatryan method [27] Proposed method
Lena Figure 11(b) 128×128 43.35 dB 36.10 dB 52.33dB
Lena Figure 11(b) 256×256 40.71 dB 36.06 dB 48.27dB
Lena Figure 11(d) 128×128 44.46 dB 35.78 dB 52.92dB
Lena Figure 11(d) 256×256 40.98 dB 35.82 dB 48.84dB
Baboon Figure 11(b) 128×128 43.09 dB 36.42 dB 52.44dB
Baboon Figure 11(b) 256×256 41.01 dB 36.46 dB 48.47dB
Baboon Figure 11(d) 128×128 44.19 dB 35.91 dB 53.08dB
Baboon Figure 11(d) 256×256 41.17 dB 35.92 dB 49.11dB
Peppers Figure 11(b) 128×128 43.27 dB 35.18 dB 51.72dB
Peppers Figure 11(b) 256×256 39.03 dB 35.20 dB 47.94dB
Peppers Figure 11(d) 128×128 43.18 dB 34.90 dB 52.27dB
Peppers Figure 11(d) 256×256 40.80 dB 34.86 dB 48.66dB
Crowd Figure 11(b) 128×128 43.69 dB 35.33 dB 51.38dB
Crowd Figure 11(b) 256×256 40.30 dB 35.37 dB 47.63dB
Crowd Figure 11(d) 128×128 44.12 dB 35.10 dB 52.04dB