R E S E A R C H
Open Access
`Through-wall human being detection
using UWB impulse radar
Xiaolin Liang
1, Tingting Lv
1*, Hao Zhang
1,3, Yong Gao
1and Guangyou Fang
2Abstract
Ultra-wideband (UWB) impulse radar plays an important role in contactless vital sign (VS) detection. The VS can be extracted remotely by acquiring the oscillations in the human chest. Unfortunately, it is usually challenging to identify VS due to the low signal-to-noise ratio (SNR) only based on the traditional fast Fourier transform (FFT) especially in complicated conditions. To extract VS accurately, this paper presents a new scheme by analyzing the skewness characteristic of the received UWB impulses, which are modulated by life activities. The distance from the human subject to the radar antenna can be calculated by performing the discrete short-time Fourier transform (DSFT) on skewness. The frequency of human respiratory movement can be estimated based on the developed ensemble empirical mode decomposition (EEMD)-based accumulation technique by canceling out the harmonics effectively. The performance of the developed detection method is tested with several experiments carried out in different environments.
Keywords:Ultra-wideband (UWB) impulse, Vital signs (VS), Discrete short-time Fourier transform (DSFT), Ensemble empirical mode decomposition (EEMD)
1 Introduction
Recently, contactless vital sign (VS) detection has drawn wide attention and achieved great achievements [1–4].The electromagnetic detection is regarded as the most promising technique, which can acquire VS in the range-frequency matrix. Ultra-wide band (UWB) im-pulse radar has been widely applied in indoor target localization, VS detection, and human fall detection by employing the continuous wave [5–8]. As a better alter-native, UWB pulse radar has been widely used in moving target detection [3, 9, 10], through-wall imaging [11, 12] and post-earthquake search and rescue [13–15] due to its insightful advantages such as strong permeability and excellent time resolution.
Many techniques have been analyzed for VS detection [16–42]. The fast Fourier transform (FFT)-based Hilbert transform is used in analyzing the time-frequency characteristic of the respiratory movements [24, 25]. Considering the additive white Gaussian noise (AWGN), a maximum likelihood period estimator with lower
complexity is proposed to acquire the period of human respiratory motions [29]. The singular value decompos-ition (SVD) algorithm is used to improve signal-to-noise ratio (SNR) by suppressing the non-stationary clutter [30]. The stationary clutter and linear trend are removed by employing the linear trend subtraction (LTS) technique [35]. In [39], the harmonics are suppressed based on the effective complex signal demodulation (CSD) algorithm. The accuracy of human respiratory frequency (RF) is improved by using the arctangent demodulation (AD) method [40]. However, they cannot achieve better performance especially in complicated conditions as they can only deal with some aspects including stationary and non-stationary clutter removal, respiratory characteristic analysis, and frequency estimates. Consequently, extensive research efforts are required to apply UWB pulse radar in VS detection.
This paper presents a new method for VS detection in through-wall and long-range conditions. The distance from human target to the radar antenna is calculated by performing the discrete short-time Fourier transform (DSFT) algorithm on the calculated skewness from the received pulses. A whole new analytical framework is provided for VS detection. The frequency of human
* Correspondence:[email protected]
1Department of Electronic Engineering, Ocean University of China, Laoshan District Song Ling Road 238th, Qing Dao, People’s Republic of China Full list of author information is available at the end of the article
© The Author(s). 2018Open AccessThis article is distributed under the terms of the Creative Commons Attribution 4.0 International License (http://creativecommons.org/licenses/by/4.0/), which permits unrestricted use, distribution, and reproduction in any medium, provided you give appropriate credit to the original author(s) and the source, provide a link to the Creative Commons license, and indicate if changes were made.
Lianget al. EURASIP Journal on Wireless Communications and Networking (2018) 2018:46
respiratory movement can be estimated more accurately by employing the developed ensemble empirical mode decomposition (EEMD)-based accumulation method for the first time, which can better eliminate the harmonics of human respiratory movement. The performance of the developed method is validated with several experiments carried out based on the UWB radar designed by the Key Laboratory of Electromagnetic Radiation and Sensing Technology, Chinese Academy of Sciences.
The remainder of this paper is organized as follows. Section 2 introduces the VS detection model. The developed detection technique is analyzed in Section 3. Section 4 shows the performance of the proposed method in different environments. Section 5 concludes the whole paper.
2 System model
In VS detection, the distance from human subject to radar antenna can be expressed as [37]:
d tð Þ ¼d0þr tð Þ ¼d0þArsin 2ð πfrtÞ
þAhsin 2ð πfhtÞ ð1Þ
where t represents the slow time and d0represents the
distance from the radar antenna to the center of the
human chest; the respiratory amplitude is Ar, and the
heartbeat amplitude isAh; the frequencies of the respiratory
and heartbeat movements arefrandfh, respectively.
If any other objects in the detection environment are stationary except for the human subject, the impulse re-sponses can be given by:
hðτ;tÞ ¼avδ τð −τvð Þt Þ þ X
i
aiδ τð −τiÞ ð2Þ
whereτrepresents the fast time,X
i
aiδðτ−τiÞrepresents the response from theith stationary object with the ampli-tudeaiand time delayτi, andavδ(τ−τv(t)) represents the
response from life activity with the amplitudeavand time
delayτv(t), which is:
To clearly show the relationship between the fast time and slow time, the sketch map of the received pulses only reflected from the respiratory movements is given in Fig.1.
The received pulses can be given by:
Rðτ;tÞ ¼sð Þ τ h tð;τÞ ¼avsðτ−τvð Þt Þ þ X
i
aisðτ−τiÞ ð4Þ
wheres(τ) represents the transmitted pulse.
Equation (4) can be described in the discrete form as:
R mð ;nÞ ¼avs mð δT−τvðnTsÞÞ þ
of the range samples;h[m,n] represents the discrete life sig-nals; andc[m] represents the discrete stationary clutter.
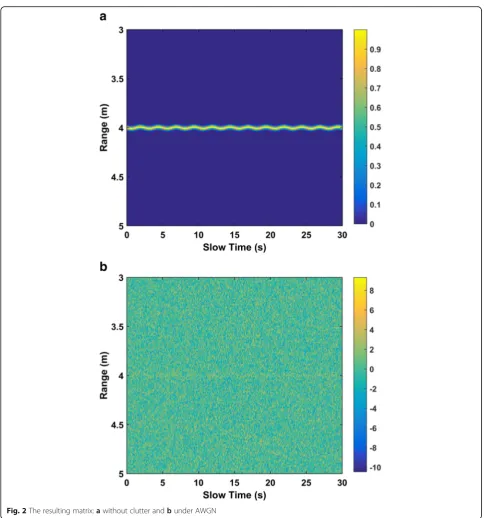
However, various clutters exist in the real environment. Equation (4) may contain not only stationary clutter and life signals but also the Gaussian noisew[m,n], non-stationary clutter q[m,n], linear trend a[m,n], and some unwanted cluttersg[m,n].
As a result, (5) can be represented as:
R m½ ;n ¼h m½ ;n þc m½ þa m½ ;n þw m½ ;n
þq m½ ;n þg m½ ;n ð6Þ
In a static environment, the ideal pulses without clutters can be given by:
Rðτ;tÞ ¼avsðτ−τvð Þt Þ ð7Þ
However, the existing various clutters as shown in (6) make it challenging to estimate the fast-time estimateτ0 and cause large errors in frequency estimates. Figure 2a shows (7), and the received pulses under AWGN are given in Fig. 2b, which indicate it is challenging to extract VS in low SNR.
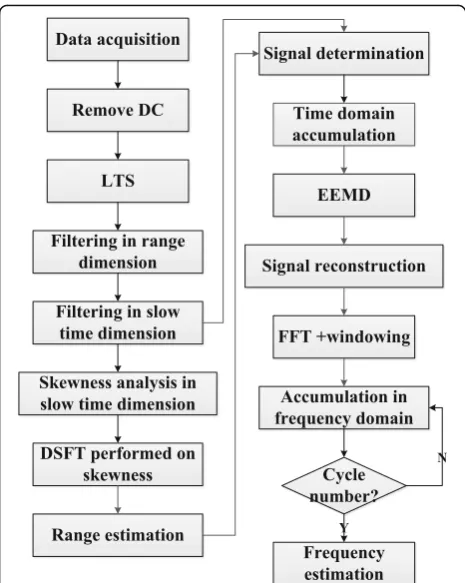
3 Detection method
In this section, the presented method for VS detection is analyzed based on the detailed steps as shown in Fig.3.
3.1 Clutter suppression
The VS are usually covered by c[m] with strong amplitude, which can be estimated as:
ℑ¼ 1
MN
XM
m¼1
XN
n¼1
Ψ½m;n ð8Þ
After removing (8), the resulting matrixΩM×Ncan be expressed as:
Ω¼Ψ−ℑ ð9Þ
To remove a[m,n], the LTS algorithm is used. The resultWM×Nis
W¼ΩΤ‐X X ΤX−1XΤΩT ð10Þ
where X= [x1, x2], x1= [0, 1, . . …, N−1]Τ and x2 ¼ ½1; 1; ::…;1ΤN1.
Fig. 2The resulting matrix:awithout clutter andbunder AWGN
Usually, the maximum SNR cannot be obtained only based on the matched filter, as the reflected pulses are different from the traditional radiated signals. Some other effective methods are required to improve SNR. In this paper, an infinite impulse response band-pass filter is used with the transfer function given by:
Hð Þω
j j2¼ 1
1þðω=ωcÞ2Nf
: ð11Þ
whereωcrepresents the cut-off frequency andNf
repre-sents the filter order.
The band-pass filter is performed on (10) in the range direction for each slow-time indexn; the outputs are:
Λ½m;n ¼χ1W m½ ;n þχ2W m½ −1;n þ…
þχNbþ1W m−N½ b;n−κ2W m−½ 1;n−…
−κNaþ1W m½ −Na;n
ð12Þ whereNb=Na= 5 andκiandχiare the filter coefficients. Further, to improve SNR, an average extraction filter is applied in (12) in slow-time direction withλ= 7, and the result is given by:
After removing the various clutters as shown in (6), (7) can be described in the discrete form as:
Ψ½m;n ¼avs mð δT−τvðnTsÞÞ
¼avs mð δR−vτvðnTsÞÞ ¼h m½ ;n ð14Þ
3.2 Range estimate
In this section, a new scheme for range estimate is de-veloped by analyzing the skewness of VS.
The skewness for each range index m in (14) can be given by [43,44]: the mean and standard deviation.
In this paper, the skewness spectrum is analyzed to es-timate the range between the radar antenna and human subject. To show the skewness of VS, one data acquired from one female subject is applied. The distance from the human subject to the radar antenna is 9 m outdoors, which will be introduced in Section4.
As shown in Fig. 4a, the skewness in human subject area follows the periodicity approximately as show in Fig. 4b. To estimate the range, the DSFT is performed on (15), which has been widely applied in signal process-ing [44,45]. The result is given by:
K o½ ;p ¼X
M
m¼1
Z m½ ;1Ξ½o−me−j2pπm=P: ð16Þ
where P denotes the discrete frequency, which follows
the uniform distribution. Ξ represents the Hamming
window, which can be expressed as:
Ξð Þ ¼o α−βcos 2πo
The result KO×P acquired by performing DSFT on (15) with human subject is shown in Fig.5. When there is no any human subject in the detection environment, the calculated skewness is shown in Fig.6a, and the cor-responding time-frequency matrix is given in Fig.6b.
It can be seen that the distance can be estimated as:
^
L¼v^τ ð18Þ
where^τrepresents the time estimate related to the max-imum in (16).
3.3 Frequency estimate
ℑ¼^τ=δT ð19Þ
To acquire the frequency of human respiratory, the corresponding signal in slow time is chosen as the effect-ive signal, which can be geffect-iven by:
O¼Ψ½ℑ;n ð20Þ
As an adaptive method, EEMD has been widely ap-plied in analyzing non-stationary signals [45, 46], which overcomes the drawback in the traditional empirical
mode decomposition [47]. Based on the EEMD tech-nique, the non-stationary signal can be broken down into several intrinsic mode functions (IMFs) and a re-sidual trend by employing the AWGN adaptively. The IMFs and residual trend can be used to reconstruct AWGN, which can improve SNR effectively.
To acquire the IMFs of (20), the steps for the EEMD method can be summarized as:
I) Add the AWGN to (20);
Fig. 4aThe calculated skewness values with the data acquired at a distance of 9 m away from the radar antenna.bThe local values
II) Based on the empirical mode decomposition, (20) can be decomposed into IMFs as:
1) Letv= 0, which is used to indicate thevth IMF;
2) To acquire all these local maximum and minimum values of (20);
3) To get the envelopes including the upper envelope
ru(t) and the lower enveloperl(t)of (20) based on the
values from 2) by employing the cubic spline function;
4) To generate the average envelope from 3), which
can be given by [48]:
m tð Þ ¼ruð Þ þt rlð Þt
2 ð21Þ
5) Subtracting (21) from (20), which can be given by:
h tð Þ ¼O~1N−m tð Þ ð22Þ
6) Go to step (II), (22) is processed until an IMF meets the stoppage criteria;
7)v=v+ 1, IMFv(t) =h(t). The residue trend can be
given by [49]:
qvð Þ ¼t O1~ N−IMFvð Þt ð23Þ
8) Go to step (II) and (23) is processed. The whole
decomposition stops until the amplitude of IMFv(t)
is small enough.
Based on the empirical mode decomposition method, (20) can be broken into several IMFs, and the residue signal given by:
III)For each added AWGN, (20) is processed by
employing the steps (I)–(II) repeatedly;
IV)The average values of the IMFs are considered as the final result, which are given by:
~
For the EEMD method, two key parameters are re-quired to be determined such as the amplitude and the times of the added AWGN. Usually, the relationship be-tween the amplitude of (20) and the added AWGN can be given by:
εn¼ εffiffiffiffiffiffi
Nv
p ð28Þ
where ε is the standard deviation of the added AWGN
and εnis the error between (20) and the ideal signal
re-constructed based on the chosen IMFs.
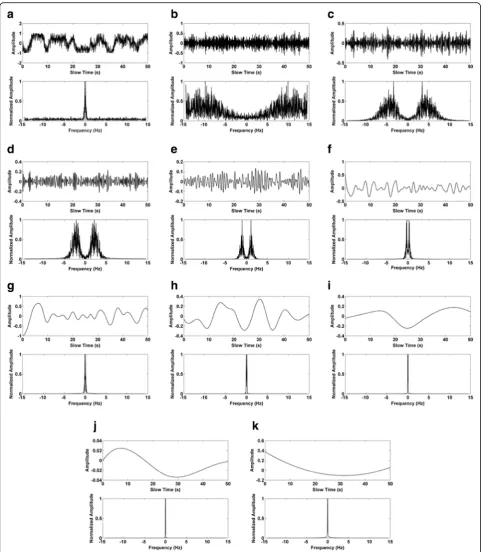
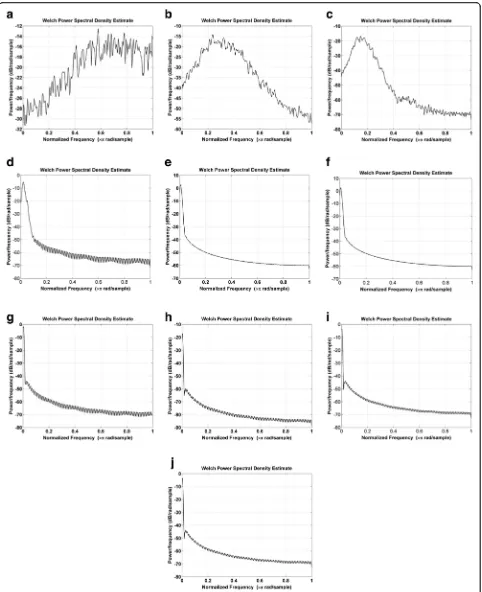
Figure7 shows the time-frequency matrix of (20) and the acquired IMFs based on EEMD, and Fig.8shows the corresponding welch power spectral density of the IMFs. As known, the frequency of human respiratory move-ment is usually within 0.2–0.5 Hz with the amplitude of 0.5–1.5 cm. As a result, the corresponding IMFs with the power being in the range of 0.1–0.8 Hz are chosen to reconstruct the signal, which can be given by:
~ Ο1N ¼
X5
v¼4
IMFmeanv ð Þt ð29Þ
A rectangular windowχis performed on the frequency components of (29), which gives
Ω½ ¼n χ½ n DFT Ο~1N
n∈K;K
¼fk;kþ1;…;kþκ−1g ð30Þ
where DFTfO1~ Ngis the discrete fast Fourier transform
(DFT) of (29) and k∗ corresponds to the index of the
lowest retained frequency component.
The frequency of human respiratory movement can be acquired as:
fr¼wð Þμr ð31Þ
where μr corresponds to the index of the maximum
value in (30), andw∈(0.1, 0.8).
As known, the harmonics are the major factor affect-ing the frequency estimate. To suppress the harmonics, an accumulation method is proposed [50], which gives: Fig. 6The calculated results without human target:athe calculated skewness values with normalized amplitude andbthe time-frequency characteristic using the DSFT method
Fig. 8The welch power spectral density of the IMFs:aIMF1,bIMF2,cIMF3,dIMF4,eIMF5,fIMF6,gIMF7,hIMF8,iIMF9, andjIMF10
δ½ ¼n l n½ þjl n½ ð32Þ
where
l n½ ¼
2Ω½ n; κ>0
Ω½ n; κ¼0
0; κ<0
8 <
: ð33Þ
4 Results and performance 4.1 Measurement setup
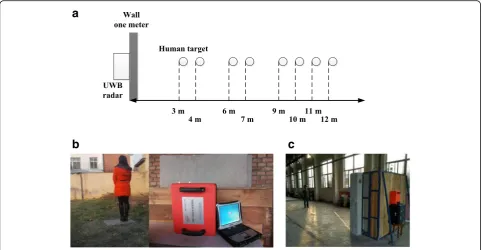
To test the performance of the presented method, sev-eral experiments are carried out in different environ-ments. The measurement setup for the experiments is shown in Fig.9a.
(I) Several experiments are conducted outdoors at the Institute of Electronic, Chinese Academy of Science, as shown in Fig. 9b. A female volunteer served as the de-tection subject for data acquisition. The used UWB radar is placed on a table, which is 1.5 m in the air. The wall consists of three materials such as brick wall (.3 m), concrete (.35 m), and plank (.35 m). The volunteer standing behind the wall stayed dormant, relaxed, and breathed normally. She faced the radar straightly. The distance from the detection subject to the radar is 3, 6, 9, and 11 m, respectively.
a
b
c
Fig. 9Measurement setup for acquiring data.aThe sketch map.bOutdoor environment.cIndoor environment
Table 1The key parameters for the UWB radar system
Parameters Value
Center frequency 400 MHz
Amplitude of transmitted signal 50 v
Pulse repeated frequency 600 KHz
Average number 128
Total time window 124 ns
Sampling points 4096
Antenna gain 5–7 dBi
Input bandwidth of ADC 2.3 GHz
ADC sampling rate 500 MHz
Data bit 12 bit
(II) Several experiments are conducted indoors in the China National Fire Equipment Quality Supervision Center, Shanghai, as shown in Fig.9c. A male volunteer served as the detection subject for data acquisition. The volunteer standing behind the wall stayed dormant, relaxed, and breathed normally. She faced the radar straightly. The distance from the detection subject to the radar is 4, 7, 10, and 12 m, respectively.
In this section, the methods such as the FFT, constant false alarm ratio (CFAR), and the advanced method (AM) are used to validate the performance of the new method.
4.2 UWB radar
The UWB impulse radar used for data acquisition consists of one transmitting antenna and one receiving antenna, which are stored in a 45 cm × 22 cm × 45 cm box and operated by a wireless personal digital assistant. The key parameters for the radar system are given in Table 1. The time window is 124 ns with 4096 samples acquired in the fast time totally. To improve SNR, 128 points are averaged for one measurement. In slow time, it takes 17.6 s to store 512 pulses. The received pulse with the normalized amplitude is shown in Fig.10. Fig. 11The resulting matrix at a distance of 9 m.aReceived pulses.bRemove static clutter.cLTS.dFiltering in fast-time dimension.eFiltering in slow-time dimension
Fig. 12The calculated skewness values with normalized amplitude at the distance ofa3 m,b6 m,c9 m, andd11 m away from the antenna
4.3 Intuitive detection performance
The results are analyzed in this section based on the steps for clutter suppression using the data sets acquired outdoors. The distance from the detection to the radar antenna is 9 m. The received raw echoes are shown in Fig. 11a. Figure 11b shows the result by removing the stationary clutter, and the result after canceling out the linear trend is shown in Fig.11c. We can see that the VS is too weak to extract. By employing the band-pass filter, the result is shown in Fig.11d, and Fig.11e shows the result after filtering in slow time. All these steps for clutter suppression result in an
improvement in VS. By employing the methods for clutter suppression mentioned above, the VS becomes more and more easy to extract compared with the raw echo as shown in Fig.11a.
4.4 Performance outdoors
As usual, VS can be extracted more easily by improving SNR [37]. If only the frequency component containing VS is referred as the effective frequency any other components are considered as AWGN. SNR can be estimated as [37]:
Fig. 13The range estimations using the new method at the distance ofa3 m,b6 m,c9 m, andd11 m away from the antenna
Fig. 15The range and RF estimations using the advanced method at the distance ofa3 m,b6 m,c9 m, andd11 m away from the antenna
Table 2Performance with different methods
Method 3 m 6 m 9 m 11 m
Proposed Range (m) 3.079 6.113 9.084 11.24
Frequency (Hz) 0.2308 0.2307 0.2932 0.3329
SNR (dB) 5.62 4.82 2.17 2.12
AM Range (m) 3.942 6.86 3.837 18.58
Frequency (Hz) 0.087 0.2038 0.1456 0.7862
SNR (dB) 2.78 −5.04 −14.29 −15.64
Fig. 16The calculated skewness values with normalized amplitude at the distance ofa4 m,b7 m,c10 m, andd12 m away from the antenna
SNR¼20 log10
X μrþ1
n¼μr−1
δ½ n
j j
X μr−2
n¼γ1
δ½ n
j j þ X
γ2
n¼μrþ2
δ½ n
j j
0 B B B B B @
1 C C C C C A
ð34Þ
whereμrrepresents the respiratory rate estimate. γ1and
γ2are the indexes ofχ.
Usually, (34) decreases with increasing the distance from the radar to the detection subject due to the attenuation of electromagnetic wave. Consequently, the capability of
improving SNR can be analyzed qualitatively by analyzing the performance of VS detection at different distances.
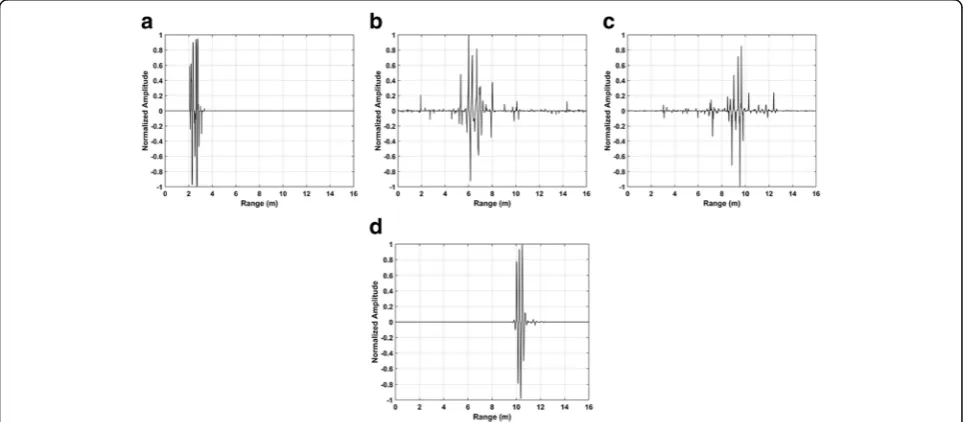
The skewness values obtained from the data sets outdoors are shown in Fig. 12. The distance from the detection subject to the radar antenna is 3, 6, 9, and 11 m, respectively. Figure 13 shows the range estimates based on the developed detection method. The range estimates are 3.079, 6.113, 9.084, and 11.24 m. The frequency estimates are shown in Fig.14. The estimates are 0.23, 0.23, 0.29, and 0.33 Hz, respectively.
By employing the AM, the detection results including the range and frequency estimates based on the acquired Fig. 17The range estimations using the new method at the distance ofa4 m,b7 m,c10 m, andd12 m away from the antenna
data sets outdoors are shown in Fig. 15. The range estimates are 3.942, 6.86, 3.837, and 18.58 m. The respiratory frequency estimates are 0.08, 0.20, 0.14, and 0.78 Hz, respectively. Compared with the results acquired from the AM method, we can see that the developed method can provide range and frequency estimates more accurately. Further, Table 2 gives the detection performance based on different methods.
4.5 Performance indoors
In this section, the data sets acquired indoors are used to test the performance of the developed detection algorithm. Based on the acquired data sets at different distances, the skewness values are shown in Fig.16. The distances from the radar antenna to the detection subject are 4, 7, 10, and 12 m, respectively. Figure 17 shows the range estimates based on the developed method. The range estimates are 4.122, 7.078, 10.071, and 12.25 m, respectively. The frequency estimates are shown in Fig.18; the estimates are 0.24, 0.23, 0.22, and 0.27 Hz, respectively.
Table 3 shows the detection results by employing the CFAR and the developed method. We can see that the developed method shows better capability of improving SNR than the CFAR method such as SNR is 5.07 dB using the new method while it is−5.21 dB for the CFAR method at 7 m.
4.6 Performance of clutter suppression
In this section, the capability of clutter removal is dis-cussed based on the data set acquired at a distance of 6 m from the antenna outdoors. To remove the harmonics, the accumulation method is used for four times in the paper. In this section, several techniques are used as examples to validate the performance of the new method such as the including FFT, EEMD-based one accumula-tion (OA) method, EEMD-based two accumulaaccumula-tion (TA) method, EEMD-based four accumulation (FA) method, and EEMD-based six accumulation (SA) method.
The detection result is shown in Fig.19a based on the FFT. It can be seen that various clutters exist in the frequency domain with the same band as human respira-tory, which makes it challenging to extract VS. The corresponding results based on the EEMD-based accu-mulation methods for different times are shown in Fig. 19b–e. We can see that the FA method can better remove clutters and improve SNR compared with other methods. Table 4 shows the SNR values based on
Fig. 19The ability to remove clutter usingaFFT,bEEMD-based one FA method,cEEMD-based two FA method,dEEMD-based four FA method, andeEEMD-based six FA method
Table 3Detection performances compared with the reference CFAR method
Method 4 m 7 m 10 m 12 m
CFAR Error (m) 0.26 NA NA NA
Frequency (Hz) 0.18 NA NA NA
SNR (dB) −3.56 −5.21 −8.56 −10.67
Proposed Error (m) 0.12 0.07 0.07 0.25
Frequency (Hz) 0.24 0.23 0.22 0.27
SNR (dB) 9.08 5.07 5.27 3.53
"NA" denotes no values can be acquired in the experiment
Table 4Detection performances in improving SNR
Method FFT EEMD OA TA FA SA
SNR (dB) −24.37 −18.85 −11.44 −8.89 −3.92 −3.88
different methods. It is clear that SNR cannot be further improved even SA is performed.
Table5 shows the frequency estimates based on the re-constructed signal from different IMFs. Results indicate VS primarily concentrates upon IMF6and IMF5. As a result, the VS can be extracted effectively based on the selected IMFs. All results prove the capability of clutter suppression and improving SNR based on the new method.
5 Conclusions
This paper presents a new de-noising method for VS detection. The VS information such as the range and respiratory frequency can be estimated based on the developed algorithm more accurately by employing the UWB pulse radar. Further, the EEMD-based accumula-tion method is proposed to remove harmonics effect-ively. By analyzing the skewness of the VS, the range can be estimated via applying the DSFT method. Several experiments are conducted in different conditions to show the excellent performance of the developed algorithm. The detection capability of the proposed method is validated compared with several techniques. Results are presented to show the ability to remove clutter and improve SNR.
Abbreviations
AD:Arctangent demodulation; AM: Advanced method; AWGN: Additive white Gaussian noise; CFAR: Constant false alarm ratio; CSD: Complex signal demodulation; DSFT: Discrete short-time Fourier transform; EEMD: Ensemble empirical mode decomposition; FA: Four accumulation; FFT: Fast Fourier transform; IMFs: Intrinsic mode functions; LTS: Linear trend subtraction; OA: One accumulation; RF: Respiratory frequency; SA: Six accumulation; SNR: Signal-to-noise ratio; SVD: Singular value decomposition; TA: Two accumulation; UWB: Ultra-wideband; VS: Vital signs
Acknowledgements
The authors would like to thank the anonymous reviewers for their valuable comments and suggestions to improve the quality of the article.
Funding
This work was funded by the National High Technology Research and Development Program of China (2012AA061403), National Science & Technology Pillar Program during the Twelfth Five-year Plan Period (2014BAK12B00), National Natural Science Foundation of China (61501424, 61701462 and 41527901), Ao Shan Science and Technology Innovation Pro-ject of Qingdao National Laboratory for Marine Science and Technology (2017ASKJ01), Qingdao Science and Technology Plan (17-1-1-7-jch), and the Fundamental Research Funds for the Central Universities (201713018).
Authors’contributions
XL conceived and performed the experiments, analyzed the data, and wrote the paper; TLv, HZ, YG, and GF helped to review and revise the whole paper. All authors read and approved the final manuscript.
Competing interests
The authors declare that they have no competing interests.
Publisher’s Note
Springer Nature remains neutral with regard to jurisdictional claims in published maps and institutional affiliations.
Author details
1Department of Electronic Engineering, Ocean University of China, Laoshan District Song Ling Road 238th, Qing Dao, People’s Republic of China.2The Key Laboratory of Electromagnetic Radiation and Sensing Technology, Institute of Electronics, Chinese Academy of Science, Haidian District North 4th Ring West Road 19th, Beijing, People’s Republic of China.3Department of Electrical Computer Engineering, University of Victoria, 3800 Finnerty Road, Victoria, BC V8P 5C2, Canada.
Received: 19 July 2017 Accepted: 20 January 2018
References
1. W Wang, D Wang, Y Jiang, Multiple statuses of through-wall human being detection based on compressed UWB radar data. EURASIP J. Wirel. Comm
2016(2016)
Table 5Human respiratory frequency (Hz) estimates based on different IMFs
IMF Frequency IMF Frequency IMF Frequency IMF Frequency IMF Frequency
1 0.49 2,3 0.67 3,4 0.72 4,5 0.72 5,6 0.26
2,3,4 0.49 2,4,5 0.78 2,5,6 0.26 2,6,7 0.09 2,7,8 0.09
2,3,5 0.78 2,4,6 0.26 2,5,7 0.09 2,6,8 0.09 2,7,9 0.09
2,3,6 0.26 2,4,7 0.09 2,5,8 0.09 2,6,9 0.09 2,8,9 0.09
2,3,7 0.09 2,4,8 0.09 2,5,9 0.09 3,4,6 0.26 3,5,7 0.09
2,3,8 0.09 2,4,9 0.09 3,4,7 0.09 3,5,8 0.09 3,6,9 0.09
2. S Singh, Q Liang, D Chen, L Sheng, Sense through wall human detection using UWB radar. EURASIP J. Wirel. Comm, 2011 (2011)
3. Y Wang, Q Liu, AE Fathy, CW and pulse–Doppler radar processing based on FPGA for human sensing applications. IEEE Trans. Geosci. Remote Sens.
51(5), 3097–3107 (2013)
4. J Wang et al., Noncontact distance and amplitude-independent vibration measurement based on an extended DACM algorithm. IEEE Trans. Instrum. Meas.63(1), 145–153 (2014)
5. A Singh et al., Data-based quadrature imbalance compensation for a CW Doppler radar system. IEEE Trans. Microw. Theory Techn.61(4), 1718–1724 (2013) 6. G Wang, C Gu, T Inoue, C Li, A hybrid FMCW-interferometry radar for indoor precise positioning and versatile life activity monitoring. IEEE Trans. Microw. Theory Techn.62(11), 2812–2822 (2014)
7. M Mercuri et al., Analysis of an indoor biomedical radar-based system for health monitoring. IEEE Trans. Microw. Theory Techn.61(5), 2061–2068 (2013) 8. SD Liang, Sense-through-wall human detection based on UWB radar
sensors. Signal Process.126, 117–124 (2016)
9. YS Koo, L Ren, Y Wang, AE Fathy,UWB MicroDoppler Radar for Human Gait Analysis, Tracking More Than One Person, and Vital Sign Detection of Moving Persons(IEEE MTT-S Int. Microw. Symp. Dig, Seattle, 2013), pp. 1–4 10. Y Nijsure et al., An impulse radio ultrawideband system for contactless noninvasive
respiratory monitoring. IEEE Trans. Biomed. Eng.60(6), 1509–1517 (2013) 11. J Li et al., Advanced signal processing for vital sign extraction with applications in UWB radar detection of trapped victims in complex environments. IEEE J. Sel. Topics Appl. Earth Observat. Remote Sens.7(3), 783–791 (2014)
12. W Hu et al., Noncontact accurate measurement of cardiopulmonary activity using a compact quadrature Doppler radar sensor. IEEE Trans. Biomed. Eng.
61(3), 725–735 (2014)
13. X. Liang et al.,“An improved algorithm for through-wall target detection using ultra-wideband impulse radar,”IEEE Access,PP(99), 1–18 (2017). 14. C Li et al., A method for remotely sensing vital signs of human subjects
outdoors. Sensors15(7), 14830–14844 (2015)
15. L Ren, Noncontact multiple heartbeats detection and subject localization using UWB impulse Doppler radar. IEEE Microw. Wirel. Compon. Lett.25(10), 690–692 (2015)
16. MC Huang et al., A self-calibrating radar sensor system for measuring vital signs. IEEE Trans. Biomed. Circuits Syst.10(2), 352–363 (2016)
17. F JalaliBidgoli, S Moghadami, S Ardalan, A compact portable microwave life-detection device for finding survivors. IEEE Embedded Syst. Lett.8(1), 10–13 (2016) 18. G Gennarelli, G Ludeno, F Soldovieri, Real-time through-wall situation awareness
using a microwave Doppler radar sensor. Remote Sens.8(8), 621 (2016) 19. C Le et al., Ultra-wideband radar imaging of building interior: measurements
and predictions. IEEE Trans. Geosci. Remote Sens.47(5), 1409–1420 (2009) 20. Q Huang, L Qu, G Fang, UWB through-tall imaging based on compressive
sensing. IEEE Trans. Geosci. Remote Sens.48(3), 1408–1415 (2010) 21. VT Vu et al., Detection of moving targets by focusing in UWB SAR theory and
experimental results. IEEE Trans. Geosci. Remote Sens.48(10), 3799–3815 (2010) 22. X Zhuge, A Yarovoy, A sparse aperture MIMO-SAR based UWB imaging
system for concealed weapon detection. IEEE Trans. Geosci. Remote Sens.
49(1), 509–518 (2011)
23. M Ascione et al., A new measurement method based on music algorithm for through-the-wall detection of life signs. IEEE Trans. Instrum. Meas.62(1), 13–26 (2013)
24. X. Liang et al., Improved Denoising Method for Through-wall Vital Sign Detection Using UWB Impulse Radar, Digit Signal Process,74, 72-93 (2018) 25. L Liu et al., Numerical simulation of UWB impulse radar vital sign detection
at an earthquake disaster site. Ad Hoc Netw.13(1), 34–41 (2014) 26. M Baldi et al., Non-invasive UWB sensing of astronauts’breathing activity.
Sensors15(1), 565–591 (2015)
27. Z Li et al., A novel method for respiration-like clutter cancellation in life detection by dual-frequency IR-UWB radar. IEEE Trans. Microw. Theory Technol.61(5), 2086–2092 (2013)
28. A Lazaro, D Girbau, R Villarino, Techniques for clutter suppression in the presence of body movements during the detection of respiratory activity through UWB radars. Sensors14(2), 2595–2618 (2014)
29. E Conte, A Filippi, S Tomasin, ML period estimation with application to vital sign monitoring. IEEE Signal Process. Lett.17(11), 905–908 (2010) 30. A Nezirovíc, A Yarovoy, L Ligthart, Signal processing for improved detection
of trapped victims using UWB radar. IEEE Trans. Geosci. Remote Sens.48(4), 2005–2014 (2010)
31. H Lv et al., Improved detection of human respiration using data fusion based on a multistatic UWB radar. Remote Sens.8(9) (2016)
32. WZ Li, A new method for non-line-of-sight vital sign monitoring based on developed adaptive line enhancer using low centre frequency UWB radar. Prog. Electromagn. Res.133(34), 535–554 (2013)
33. Z Zhang, Human-target detection and surrounding structure estimation under a simulated rubble via UWB radar. IEEE Trans. Geosci. Remote Sens.
10(2), 328–331 (2013)
34. Y Xie, G Fang, Equi-amplitude tracing algorithm based on base-band pulse signal in vital sign detecting. Electron. Inf. Technol.31(5), 1132–1135 (2009) 35. P Armitage,Tests for Linear Trends in Proportions and Frequencies.
Biometrics,11(3), 375-386 (1955)
36. S Wu et al., Improved human respiration detection method via ultra-wideband radar in through-wall or other similar conditions. IET Radar Sonar Navig.10(3), 468–476 (2016)
37. Y Xu et al., Vital sign detection method based on multiple higher order cumulant for ultra-wideband radar. IEEE Trans. Geosci. Remote Sens.50(4), 1254–1265 (2012)
38. X Hu, T Jin, Short-range vital signs sensing based on EEMD and CWT using IR-UWB radar. Sensors16(12),1-18 (2016)
39. C Li, J Lin, Random body movement cancellation in Doppler radar vital sign detection. IEEE Trans. Microw. Theory Techn.56(12), 3143–3152 (2008) 40. B-K Park, O Boric-Lubecke, VM Lubecke, Arctangent demodulation with DC
offset compensation in quadrature Doppler radar receiver systems. IEEE Trans. Microw. Theory Techn.55(5), 1073–1079 (2007)
41. K Naishadham, JE Piou, A robust state space model for the characterization of extended returns in radar target signatures. IEEE Trans. Antennas Propag.
56(6), 1742–1751 (2008)
42. L Ren et al., Phase-based methods for heart rate detection using UWB impulse Doppler radar. IEEE T Microw. Theory64(10), 3319–3331 (2016) 43. X Liang et al., Energy detector based TOA estimation for MMW systems
using machine learning. Telecommun. Syst.64(2), 417–427 (2017) 44. B ALLEN, Short term spectral analysis, synthesis, and modification by
discrete Fourier transform. IEEE T. Audio Speech25(3), 235–238 (1977) 45. K Wójcicki et al., Exploiting conjugate symmetry of the short-time Fourier
spectrum for speech enhancement. IEEE Signal Proc. Let.15, 461–464 (2008) 46. AH Liao, CC Shen, PC Li, Potential contrast improvement in ultrasound
pulse inversion imaging using EMD and EEMD. IEEE Trans. Ultrason. Ferroelectr. Freq. Control57(2), 317–326 (2010)
47. RS Jia et al., Suppressing non-stationary random noise in microseismic data by using ensemble empirical mode decomposition and permutation entropy. J. Appl. Geophys.133, 132–140 (2016)
48. X. Liang et al., A Novel Time of Arrival Estimation Algorithm Using an Energy Detector Receiver in MMW Systems, EURASIP J Adv Sig Pr,
2017(83),1-13 (2017)
49. JCC Mak, A Bois, JKS Poon, Programmable multiring Butterworth filters with automated resonance and coupling tuning. IEEE J. Sel. Top. Quant.
22(6), 1–9 (2016)
50. L Marple, Computing the discrete-time“analytic”signal via FFT. IEEE T. Signal Proces47(9), 2600–2603 (1999)