The multiple impacts of the COVID-19: A qualitative perspective
Bahri, Muhamad1
Abstract
The world has been highly impacted by the COVID-19 as the virus has spread to all continents – about 200 countries and territories in total. The latest update claims about 10,000,000 confirmed cases and about 500,000 confirmed deaths owing to the COVID-19 pandemic. This probably makes the COVID-19 as the most dangerous contagious disease in the era 2000s. Apart from massive publications on this topic, there is no available qualitative analysis that describes the dynamic spreads of the COVID-19 and its impacts on healthcare and the economy. Through the system archetypes analysis, this paper explains that the dynamic spread of the COVID-19 consists of the limits to growth and the success to successful structures. The limits to growth elucidates that more symptomatic and asymptomatic patients owing to infected droplets may be bounded by self-healing and isolated treatments. The success to successful structure explains that once the COVID-19 affects the economy through the lockdown, there will be a limited fund to support the government aids and the aggregate demand. In overall, this paper gives readers simplified holistic insights into understanding the dynamic spread of the COVID-19.
Keywords: system archetypes; the COVID-19; the impacts of the COVID-19; the limits to growth; the success to successful
1 The Graduate Programme of Development Studies (Jurusan Pascasarjana Studi Pembangunan)
Bandung Institute of Technology
Jl Ganesha 10, Bandung, West Java, Indonesia Email: [email protected]
1.
Introduction
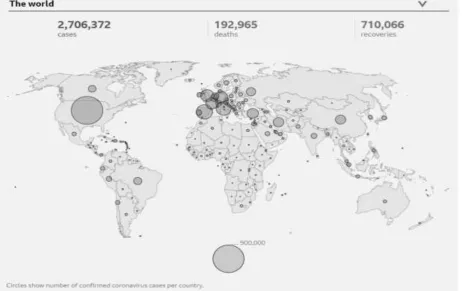
Since the coronavirus or the COVID-19 has impacted almost all countries across the world, a lot of affected countries have experienced adverse impacts in terms of health and economic aspects. Even, at least two countries, Italy and USA have surpassed the number of symptomatic patients and fatalities than those in China - the first affected country. As seen in figure 1, the COVID-19 has affected almost all countries in the world including developed and developing countries.
Figure 1. The infection map of the COVID-19 (https://www.bbc.com/news/world-51235105- accessed on April 24th, 2020)
It seems that the COVID-19 has not much-differentiated race, income, and geography as the virus has infected people in developed and developing countries, both in the southern and the northern hemispheres. Likewise, because of our limited knowledge about the virus and due to unavailable vaccine(s), some measures have been taken to eradicate the virus spread such as physical distancing, self-quarantines, and lockdown(s).
The adverse impacts and controversies around the virus spread have attracted some scientists to investigate several issues surrounding the COVID-19. Several studies investigated the virus patterns such as how much its basis reproduction number (Tang et al., 2020; Zhang et al., 2020), and its symptoms (Rothan, H. A., & Byrareddy, 2020; WHO, 2020). Other studies (Musa et al.,2019 ;WHO, 2020; Yang, & Wang, 2020) focused on computer or mathematical modeling, analyzing the virus transmission among humans.
This study aims to provide readers a qualitative analysis how the COVID-19 may affect our susceptible population, healthcare facilities and economy. In doing so, this study applies the system archetypes to identify systemic structure and generic solutions regarding to the COVID-19 pandemic. Likewise, as the COVID-COVID-19 has affected almost all countries in the world, the findings in this study can be useful for all policymakers in the world.
2.
Methods
dynamics of possible scenarios of complex systems (Senge, 1991; 2014; Wolstenholme, 2004). Likewise, system archetypes enable the decision-makers to see clear insights into the entire system and predict the system behavior. The last but not the least, the system archetypes can be used as a basis to develop a computer model to produce the observed system and simulate possible policies for future scenarios.
Identification of the system archetypes follows existing studies (M. Bahri, 2020; MK Bahri, 2020; Senge, 1991; Senge, 2014; Setianto et al, 2014). A causal loop diagram (CLD) based on existing studies was developed, revealing combinations of balancing loop (B) and reinforcing loop (R). After developing a CLD, a set of system archetypes (Senge, 1990) was used as a compass to identify system archetypes. To identify and explain each of the system archetypes, four elements were collected including, behavior over time, systemic structure, associated storylines, and generic solutions.
3. Results and Discussion A causal loop diagram
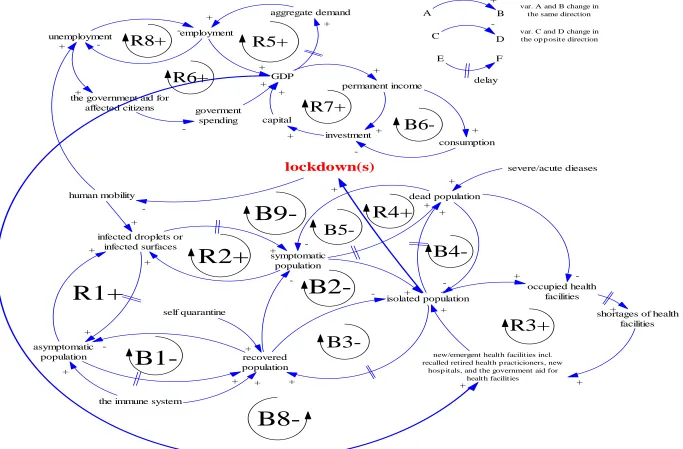
After collecting and summarizing data and a set of literature review, a simplified CLD representing dynamic and relationships between the COVID-19, healthcare, and economic sub-systems are drawn in figure 2. There are nine balancing loops (B1-B9) and seven reinforcing loops (R1-R7), determining systemic structures. Likewise, each sub-system including the contagious effects, the healthcare effects, and the economic effects has combination(s) of balancing loops (B) and reinforcing loops (R). The detailed interaction between balancing and reinforcing loops are explained for each sub-system in the following paragraphs.
The contagious sub-system
Figure 1. A simplified causal loop diagram – the coronavirus dynamic spread
asymptomatic population isolated population occupied health facilities +
shortages of health facilities + recovered population +
R1+
B1-
B2-infected droplets or infected surfaces + symptomatic population + human mobility + +
R2+
+ + -dead population +-
B4-+R4+
-
B3-R3+
lockdown(s) +-
B9-
B5-
B8-new/emergent health facilities incl. recalled retired health p racticioners, new
hosp itals, and the government aid for health facilities + + -+
the immune system + + self quarantine + severe/acute dieases + unemployment GDP capital employment + + consumption aggregate demand + + permanent income + investment + + + -the government aid for
affected citizens + goverment spending -+
R5+
R7+
B6 -+ + A B + C D -E F delayvar. C and D change in the op p osite direction var. A and B change in the same direction
-
R8+
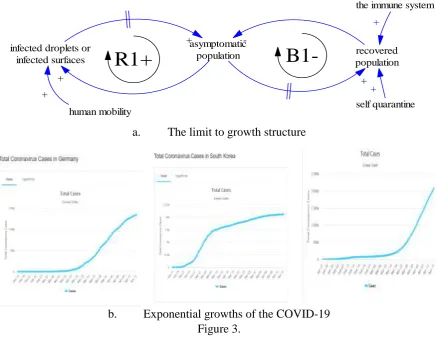
Figure 3 is an example of the limits to growth structure, this system structure explains that a growth has a limited growth level. A reinforcing loop (R1: infected droplets – asymptomatic population) is an engine growth stating that asymptomatic population will increase as long as infected droplets or infected surfaces are available owing to human mobility. Human mobility can be the main cause of spreading infected droplets or infected surfaces. Fortunately, the symptomatic population may do self-quarantine or has a better immune system, an increase of asymptomatic patients has a limit (B1: symptomatic patients – recovered population).
If a reinforcing loop has a stronger influence than a balancing loop, then there will be an exponential growth (e.g Sterman, 2000; Pryut, 2013). Almost all affected areas (Germany, South Korea, and the world respectively) show an exponential growth of the infected patients despite recovered patients as seen in figure 3b.
Please kindly note that a sign “ ” means that there is a delay between the process. For instance, after a susceptible person touches an infected surface, there is a delay time between the COVID-19 infects person’s body and his immune system reacts.
a. The limit to growth structure
b. Exponential growths of the COVID-19 Figure 3.
Infected droplets also can increase the symptomatic population (R2: infected droplets – symptomatic population), leading to an increase in the dead population and isolated population. There are two treatments of symptomatic patients. The first one is the self-quarantine treatment in which symptomatic patients with mild symptoms are asked to quarantine themselves (e.g. Wilder-Smith, & Freedman, 2020). In case, symptoms are severe then symptomatic patients
asymptomatic
population recovered population
R1+
B1-infected droplets or infected surfaces
+
human mobility
+
+
-+
self quarantine the immune system
+
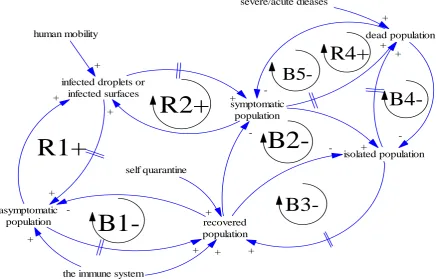
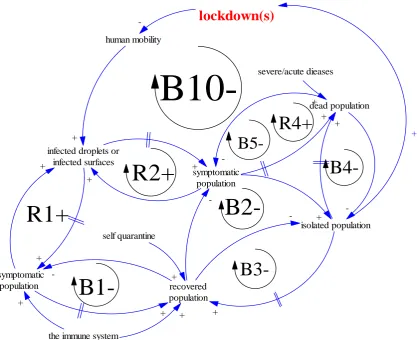
will be isolated at hospitals or the health centers (e.g. Wilder-Smith, & Freedman, 2020). In this study, it is assumed that symptomatic patients during self-quarantines and isolated patients may experience fatality, leading to an increase in the dead population. As a consequence, decreasing the number of the symptomatic population (B5) and isolated population (B4). After a delay, the isolated population is eliminated to be the recovered population (B3). A full interaction between symptomatic, asymptomatic and recovered patients can be seen in figure 4.
Figure 4. The simplified structure of the limits to growth #1 in the contagious sub-system
In general, it appears that the engine of growth (R1 and R2) i.e. the infection progress tends to dominate preventive and corrective actions such as isolated patients and self-quarantines. This also means that human mobility is the culprit of the exponential growth of the COVID-19 population.
Possible generic solutions to eliminate the COVID-19 pandemic – at least minimize the infected patients – are increasing society immunity, localization of people with historical acute diseases or weak immunity and limitation of human mobility (lockdowns). As developing a vaccine needs a proper time, previously mentioned solutions should be applied as soon as possible to prevent our society from pandemics.
When infected people and disinfected people easy to identify, self-quarantines and isolation are two possible solutions. However, there is a situation where testing everyone, to identify infected and disinfected people, is impossible owing to limited funding or toolkits (Piguillem & Shi, 2020). If policymakers cannot separate infected population and disinfected people, a lockdown is the best solution to stop the transmission of diseases (Piguillem & Shi, 2020).
asymptomatic population
isolated population
recovered population
+
R1+
B1-
B2-infected droplets or infected surfaces +
symptomatic population +
human mobility
+
+
R2+
+
+
-dead population +
B4-+
R4+
-
B3-
B5
-+
the immune system +
+ self quarantine
+
severe/acute dieases
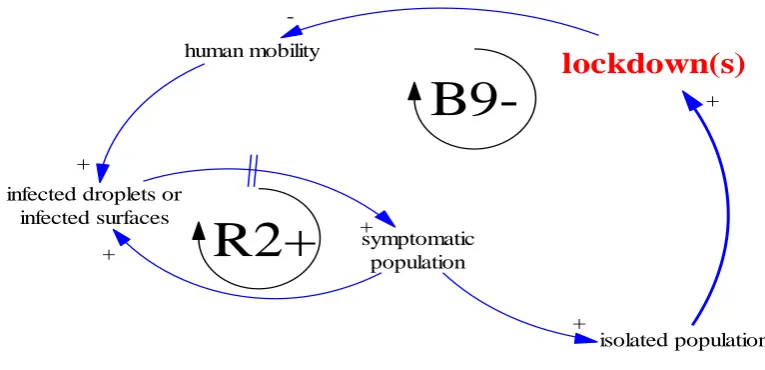
As seen in figure 5, through a balancing loop (B9) the lockdown aims to restrict human mobility, leading to less symptomatic population. However, the lockdown has a negative effect, that is, the economic downturn(s). The following paragraphs explain the negative effects of the lockdown. For readers’ convenience, a complete relationships in the contagious sub-system is drawn in figure 6.
Figure 5. The simplified structure of the limits to growth #2 in the contagious sub-system
isolated population infected droplets or
infected surfaces
symptomatic population +
human mobility
+
R2+
+
lockdown(s)
+
-
Figure 6. The lockdown effects in the contagious sub-system
The healthcare sub-system
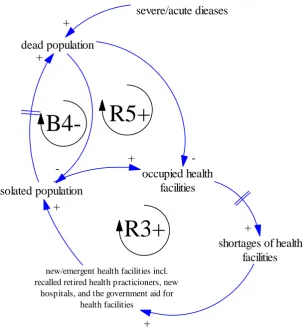
As seen in figure 7, more isolated patients may occupy more hospitals and lead to shortages of health facilities. This situation can be solved through an increase in health facilities such as new hospitals and new health practitioners (R3). Another reinforcing loop (R5) guarantees less the dead population as long as isolated patients are maintained in properly healthcare facilities. However, isolated patients with severe or acute diseases can increase the dead population. It is shown later that an increase in new health facilities to support more isolated population is not a long term solution.
Some studies (e.g. Ferguson et al., 2020; Loayza & Pennings, 2020) explained that the pandemic has enforced some countries to increase their healthcare facilities. Despite increasing healthcare facilities, some countries such as Japan and Italy have still struggled to cope with the negative impacts of the Covid-19 (Ferguson et al., 2020; Loayza & Pennings, 2020; Remuzzi et al., 2020).
asymptomatic population
isolated population
recovered population
+
R1+
B1-
B2-infected droplets or infected surfaces +
symptomatic population +
human mobility
+
+
R2+
+
+
-dead population +
B4-+
R4+
-
B3-lockdown(s)
-
B10-
B5
-+
the immune system +
+ self quarantine
+
severe/acute dieases +
Figure 7. The limits to growth structure #3 in the healthcare sub-system
The economic sub-system
The economy sub-system is adapted from other studies (Forrester, 1985; Wheat, 2012). Gross Domestic Output (GDP) is an output after employment and capital (e.g. Mankiew, 2000). A rise in GDP leads to an increase in aggregate demand (AD), leading to a reinforcing loop (R5). When unemployment increases, the government usually increases the government aids for the poor and the unemployed people, leading to a decrease in the government spending (R6-).
This study also identifies the success to succesfull structure (R5 and R6) as seen in figure 8. This structure affirms that an increase in the government aids leads to a decrease in an existing funding to support aggregate demand. Possible generic solutions in this situation are to share GDP properly between AD and the government aids and educate people to be high-skilled laborers.
Existing studies (Boissay et al., 2020; Caracciolo et al., 2020; Gumede et al., 2020) indicated that some countries such as Japan and European countries have provided financial support for unemployed people – aiming to boost people income and economy. Owing to less funding, Eurobond has been released to support European countries owing to the COVID-19 pandemic (Caracciolo et al., 2020; Gumede et al., 2020).
isolated population
occupied health facilities +
shortages of health facilities
+
R5+
dead population +
-
B4-R3+
new/emergent health facilities incl. recalled retired health practicioners, new
hospitals, and the government aid for health facilities
+ +
Figure 8. The success to successful structure #1 in the economy-subsystem
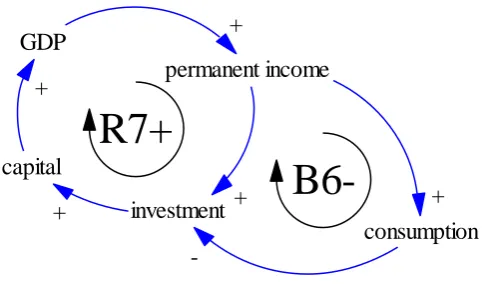
An increase in GDP also increases the permanent income which then increases investment, a reinforcing loop (R7). Unfortunately, the Limits to Growth structure bounds increasing investment through a balancing loop (B6: permanent income – consumption – investment – capital – GDP – permanent income). Increasing public interest in investment through the government obligation and the stock markets are possible generic solutions for this structure. This option is supported by existing studies (Caracciolo et al., 2020; Gumede et al., 2020) stating the releases of Eurobond to cope with negative impacts of the Covid-19 pandemic in Europe.
Figure 9. The limits to growth structure #4 in the economy-subsystem
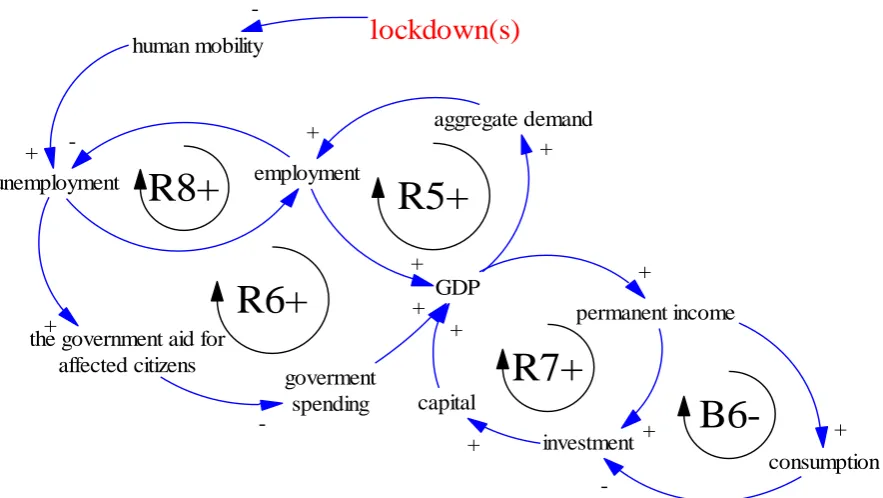
In understanding the impacts of the lockdown on the economy, a fully simplified structure is displayed in figure 10. The lockdown tends to increase unemployment as well as decrease employment (Baldwin & Mauro, 2020; McKibbin & Fernando, 2020). The negative effects of the lockdown are at least two types: decreasing employment (B7) and increasing the government aid for affected people (R6). This means that during the lockdown, affected countries will get many negative effects including GDP loss, rising unemployment, and rising government aids (Baldwin & Mauro, 2020).
unemployment
GDP employment
+
aggregate demand + +
-the government aid for affected citizens
+
goverment spending
-+
R5+
R6+
GDP
capital +
consumption permanent income
+
investment +
+ +
-R7+
B6-Another impact of the lockdown was found when the economy and healthcare sub-systems are connected. As GDP decreases, the government support for healthcare will be bounded (B8-). This structure reproduces the Limits to Growth structure as seen in figure 10.
Figure 10. The simplified structure of the limits to growth #5 in the economy sub-system
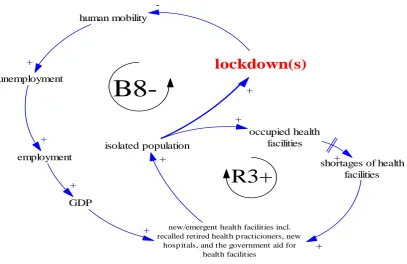
To ease readers in evaluating the impacts of the COVID-19 on the economy, a simplified causal loop diagram is drawn in figure 11. Because GDP influences all aspects such as AG, permanent income, and government spending, the lockdown tends to affect several aspects in our society. For instance, the lockdown could affect the government capability to protect its society and household consumption. This means that the COVID-19 may lead to larger socio-economic impacts and the government should prepare well in anticipating the negative impacts.
isolated population
occupied health facilities +
shortages of health facilities +
human mobility
R3+
lockdown(s)
+
-
B8-new/emergent health facilities incl. recalled retired health p racticioners, new
hosp itals, and the government aid for health facilities
+ +
unemployment
GDP employment
+
+ +
Figure 11. The simplified structure of the economy sub-system
3. Conclusions
This paper has presented the nexus impacts of the COVID-19 in three subsystems including the contagious, healthcare, and economy systems. This study does not aim to explain the impacts at whole nor in-depth analysis. Rather, this study aims to provide a piece of concise information about a range of possible impacts and solutions. Upon this study, it is hoped that policymakers are more aware of large scopes and severe impacts of the COVID-19. Thus, a well-established preparedness is the main concern of the policymakers for possible next outbreaks.
The limits to growth archetype shows that health treatments such as self-quarantines and isolation can minimize infected people. While infected people can be easily detected or the number of infected people are relatively small, self-quarantines and isolation are sufficient to decrease the negative impacts. But when, the number of isolated people increases significantly, threatening healthcare availability, imposing the lockdown is the best solution. Once the lockdown is applied, the economic impacts will visible. This means that delayed responses to the COVID-19 lead to larger unintended consequences.
The nexus concept has been applied in the context of sustainability science, especially associated with the environment and/or natural resources issues (Giampietro et al., 2014). This study shows that the nexus application in the COVID-19 is important as connections between sub-systems give us clearer insights into the negative impacts the COVID-19. For instance, increasing healthcare facilities sounds a good solution as seen in figure 7. But when the healthcare and economy sub-systems are connected, it is seen that increasing healthcare facilities is not a long-term solution. It is thus that this study encourages the application of nexus when outbreaks may threaten limited resources such as healthcare facilities.
unemployment
GDP
capital employment
+
+
consumption aggregate demand
+ +
permanent income +
investment +
+ +
-the government aid for affected citizens +
goverment spending
-+
lockdown(s)
human mobility
-+
R5+
R6+
R7+
References
Baldwin, R., & di Mauro, B. W. (2020). Economics in the Time of COVID-19. A VoxEU. org Book, Centre for Economic Policy Research, London. Accessed, 26.
Bahri, M. K. (2008). Achieving the vision 2030: An Indonesia macroeconomic model using system dynamics approach. Unpublished master thesis. Graduate Program of Development
Studies. Bandung Institute of Technology.
https://www.researchgate.net/publication/236859486_Indonesia's_Macroeconomic_Model_us ing_System_Dynamics_Approach
Bahri, M. (2020). Analysis of the water, energy, food and land nexus using the system
archetypes: A case study in the Jatiluhur reservoir, West Java, Indonesia. Science of The Total Environment, 716, 137025.
Bahri, M.K. System Archetypes to Understand the Impacts of Climate Change on Rice Production: A Case Study in West Nusa Tenggara, Indonesia. Preprints 2020, 2020040499 (doi: 10.20944/preprints202004.0499.v1).
Boissay, F., Rees, D., & Rungcharoenkitkul, P. (2020). Dealing with Covid-19: understanding the policy choices (No. 19). Bank for International Settlements. .
Braun, W. (2002). The system archetypes. System, 2002, 27.
Brzezina, N., Biely, K., Helfgott, A., Kopainsky, B., Vervoort, J., & Mathijs, E. (2017). Development of organic farming in europe at the crossroads: looking for the way forward through system archetypes lenses. Sustainability, 9(5), 821.
Caracciolo, G., Cingano, F., Ercolani, V., Ferrero, G., Hassan, F., Papetti, A., & Tommasino, P. Covid-19 and Economic Analysis: a Review of the Debate. . Retrieved on 15th June, 2020 from https://www.bancaditalia.it/media/notizie/2020/Covid-literature-newsletter-n2.pdf
Ferguson, N. M., et al. 2020. “Impact of Non-Pharmaceutical Interventions (NPIs) to Reduce COVID19 Mortality and Healthcare Demand.” Imperial College London. https://www. imperial.ac.uk/mrc-global-infectious-disease-analysis/news--wuhan-coronavirus
Fornaro, L., & Wolf, M. (2020). Covid-19 coronavirus and macroeconomic policy. Retrieved on 15th June, 2020 from https://homepage.univie.ac.at/ma.wolf/assets/files/corona_v2.pdf
Forrester, N. B. (1982). A dynamic synthesis of basic macroeconomic theory: implications for stabilization policy analysis (Doctoral dissertation, Massachusetts Institute of Technology).
Giampietro, M., Aspinall, R. J., & Ramos-Martin, J. (2014). Addressing the complexity of integrated resource assessment. In Resource Accounting for Sustainability Assessment (pp. 23-30). Routledge.
Gumede, W., Bob, U., de Beer, D., Lues, R., & Anelich, L. (2020). Position Paper: Priority Setting For Interventions In Pre-And Post-Pandemic Management: The Case Of Covid-19. Retrieved on 15th June, 2020 from
Islam, N., Ishaq, M., Bukhari, B., & Siddiqui, M. K. (2009). AI-QANUN: IBN SINA'S CONTRIBUTION TO THE WORLD OF MEDICENE. Journal of Central Asian Studies, 18(1).
Loayza, N. V., & Pennings, S. (2020). Macroeconomic policy in the time of COVID-19: A primer for developing countries. The world bank group
McKibbin, W. J., & Fernando, R. (2020). The global macroeconomic impacts of COVID-19: Seven scenarios.
Musa, S. S., Zhao, S., Chan, H. S., Jin, Z., & He, D. (2019). A mathematical model to study the 2014–2015 large-scale dengue epidemics in Kaohsiung and Tainan cities in Taiwan, China. Mathematical biosciences and engineering.
Piguillem, F., & Shi, L. (2020). The optimal covid-19 quarantine and testing policies (No. 2004). Einaudi Institute for Economics and Finance (EIEF).
Pruyt, E. (2013). Small system dynamics models for big issues: Triple jump towards real-world complexity. Retrieved at http://repository.tudelft.nl.
Remuzzi, Andrea, and Giuseppe Remuzzi. "COVID-19 and Italy: what next?." The Lancet (2020).
Rothman, K. J. (2012). Epidemiology: an introduction. Oxford university press.
Rothan, H. A., & Byrareddy, S. N. (2020). The epidemiology and pathogenesis of coronavirus disease (COVID-19) outbreak. Journal of autoimmunity, 102433.
Sterman, J. (2000). Business dynamics: systems thinking and modeling for a complex world. Irwin McGrawHill.
Senge, P. M. (1991). The fifth discipline, the art and practice of the learning organization. Performance+ Instruction, 30(5), 37-37.
Senge, P. M. (2014). The fifth discipline fieldbook: Strategies and tools for building a learning organization. Crown Business.
Setianto, N. A., Cameron, D., & Gaughan, J. B. (2014). Identifying archetypes of an enhanced system dynamics causal loop diagram in pursuit of strategies to improve smallholder beef farming in Java, Indonesia. Systems Research and Behavioral Science, 31(5), 642-654.
Tang, B., Bragazzi, N. L., Li, Q., Tang, S., Xiao, Y., & Wu, J. (2020). An updated estimation of the risk of transmission of the novel coronavirus (2019-nCov). Infectious disease modelling, 5, 248-255.
Wheat Jr, I. D. (2007). The feedback method of teaching macroeconomics: is it effective?. System Dynamics Review, 23(4), 391-413.
WHO. (2010). Coronavirus disease (COVID-19) outbreak. Retrieved on March 19th at https://www.who.int/emergencies/diseases/novel-coronavirus-2019
World Health Organization. (2020). Coronavirus disease 2019 (COVID-19): situation report, 73.
Wolstenholme, E. (2004). Using generic system archetypes to support thinking and modelling. System Dynamics Review: The Journal of the System Dynamics Society, 20(4), 341-356.
Yang, C., & Wang, J. (2020). A mathematical model for the novel coronavirus epidemic in Wuhan, China. Mathematical Biosciences and Engineering, 17(3), 2708-2724.