172 |
P a g e
QUANTITATIVE PHASE IMAGING OF BIOLOGICAL
CELLS USING OFF-AXIS METHOD OF WIDE FIELD
DIGITAL INTERFERENCE MICROSCOPY (WFDIM)
Pradeep Kumar Behera
1, Dalip Singh Mehta
21,2
Physics,Indian Institute of Technology Delhi (IITD),(India)
ABSTRACT
We demonstrate a single shot off-axis method of WFDIM using transmission geometry for the quantitative study of
cellular dynamics structure. Experimental results of the 2D phase map onion cells and red blood cells (RBCs) are
presented. Biological cells in culture are optically probed by measuring the phase shift they produce on the
transmitted wave front. The WFDIM was used to quantify both the refractive index and the morphology i.e., cellular
thickness (biological sample) from the measured phase shift is presented in transparent specimens. For the dynamic
substances which changes rapidly single shot interferometric microscopy is an important method for obtaining the
phase. Experimental results with increased field-of-view samples and large tilt angle are also presented and the
light source the interference occurs only in the desired location of the object, i.e., where the object is sharp focused.
The single shot interferograms were recorded and reconstruction by Fourier transform. This way a large area of the
sample can be imaged quantitatively.
Keywords: Introduction, Theoretical Consideration Of Off-Axis WFDIM, Experimental Details Of
Off-Axis WFDIM, Experimental Results And Discussion, Conclusion, Acknowledgement.
I INTRODUCTION
Optical microscopy is well known technique to visualize the fine structure of biological materials and image the magnified view of biological micro-organisms. With the help of optical microscope the high resolution fine structure the details of the micro-organisms have been visualized. There are various types optical microscopic techniques such as; bright field microscopy, fluorescence microscopy, confocal microscopy and phase contrast microscopy. Most of the biological objects are transparent in nature, i.e., they don’t absorb light and scatter light significantly and
hence can not be imaged /seen using bright field microscopy because of poor contrast. Fluorescence microscopy was developed to visualize the transparent phase objects. But; Fluorescence microscopy requires a fluorescence dye, emission filter, excitation filter and excitation source. Hence the system becomes costly. Further in fluorescence microscopy (FM) an external contrast agent fluorescence dye is used, which may change properties of cell
173 |
P a g e
The phase contrast microscopy is the only technique which gives high contrast images of the transparent objects without using any contrast agent. To improve the contrast, phase contrast microscopy [1] and Nomarski/differential interference contrast (DIC) microscopy have been developed [2]. However, these conventional phase microscopy techniques do not yield quantitative phase imaging of biological cells. There has been great progress in the development of interferometric phase microscopy to quantitatively obtain the phase images of the biological cells and tissues [3]. Quantitative phase images yields, cell morphology and the refractive index (RI) distribution which is directly associated with optical path delays, and thus can be an important tool for medical diagnostics and cell biology studies. Interferometric phase microscopy is basically of two types: on-axis interferometry and off-axis interferometry [4]. On-axis interferometry requires minimum three phase shifted interferograms to extract the phase information and in this case the angle between the sample and reference beam is nearly zero. Further, the spatial frequency bandwidth of the interferometric signal should be narrower. On the other hand, in the case of off-axis interferometry, only single interferogram is required to extract the phase information, and angle between the sample and reference beam is large. But as compare to on-axis interferometry it requires a larger spatial frequency bandwidth of the interferometric signal to remove the undesired components of the Fourier spectrum, such as, dc component and complex conjugate of first order. Since, in the dynamic processes the biological sample may change between the acquisitions of the multiple interferograms or frames and also the phase noise may increase due to the sample fluctuations. For such cases the off-axis interferometry could be helpful, because, one can obtain the quantitative phase information from single interferogram and this can be realized in real-time.
Recently, full-field phase microscopic methods, such as, Fourier phase microscopy [5], Hilbert phase microscopy (HPM) [6], and Diffraction phase microscopy (DPM) [7, 8] has been developed for quantitative phase imaging of biological cells and tissues. Although, these techniques have been highly successful and can measure sub-nanometer path-length and well suited for studies of cellular dynamics in real time. But in most of the aforementioned quantitative phase microscopic techniques are low phase stability and limited maximum achievable phase and experimental set-ups are complicated, such as, Michelson,linnik and mirau interferometric configuration is used. Further, the experimental set-ups are bulky and hence difficult to align for obtaining interference pattern and imaging the sample simultaneously. One of the essential requirements for the quantitative phase microscopy is the high-resolution quick imaging and simultaneous occurrence of interference between the object and reference beams. Further, the system should be low cost, compact and user friendly, i.e., less cumbersome for alignment.
174 |
P a g e
main advantages phase measurement is excellent phase stability, high sensitivity and imaging speed because WFDIM does not require mechanical reference scanning.Which is capable of capturing the entire complex field distribution (amplitude and phase) associated with a sample in a single digital camera exposure, without the need of mechanical scanning of the proposed system. The present system is single shot imaging therefore, the image can be captured in real-time depending on the frame speed which is 15fps in present case.
II THEORETICAL CONSIDERATION OF OFF-AXIS WFDIM
The transmission geometry of WFDIM system was constructed using fiber optic MZI and 2D charge
coupled device (CCD) camera as shown in Fig. 1. The working principle is similar to the based on high
spatio-temporal coherence interferometry. The sample is placed on one arm of the MZI and hence light
transmitted through sample and reference arms are superimposed at beam-splitter (B S). The interference
pattern is observed only if the optical path difference (OPD) between the transmitted signal from the
sample and reference arm is within the coherence length of light source. The recorded intensity I(x, y)
can
be expressed as;
I
(
x
,
y
)
T
R
T
S
2
T
R.
T
S.
cos(
k
z
)
(1)
Where k is wave number,
TR
and
TR
represents the transmitted light from the reference
and sample arms
,
respectively, Δz is the OPD between sample and reference arm. Since most of the realistic objects
(biological cells and tissues) have nonuniform thickness across the sample, optical path length (OPL) is
not equal at every X-Y position of the sample. This nonuniform OPL leads to nonhomogeneity in the
OPD. Further, the OPD is related to the interferometric phase difference and refractive index of the
sample as;
)}
1
)
;
,
(
){
,
(
2
)
;
,
(
2
)
;
,
(
0 0
x
y
k
z
x
y
k
l
x
y
n
x
y
t
(2)
Where λ
0is the center wavelength and n(x, y; k) is refractive index of the object which is the function of
position and wavelength of the light source and h(x, y) is the corresponding physical thickness of object
under test at a specific pixel (x,y). Hence from the knowledge of phase map, Δz = z
1-z
2OPD and
2-D-refractive index profile of transparent object can be obtained.
III EXPERIMENTAL DETAILS OF OFF-AXIS WFDIM
The schematic diagram of off-axis WFDIM is shown in Fig. 1. A He-Ne laser light (wavelength = 632.8 nm) is focused by using microscope objective (MO) lens (10X) and coupled into a 2 × 2 single mode fiber. The output light from the both output end of fiber is collimated by lensesL1 and L2 towards object and reference arms having OPL Z1
175 |
P a g e
Fig-1: Schematic Diagram Of Off-Axis WFDIM .
Object was placed close to microscope objective (M.O) and most of the light passing through sample is collected by the detector depending on the absorption characteristics of the sample. A microscope objective (MO) lens (magnification 10X, NA=0.25, and working distance 9.7 mm) was used for obtaining high lateral-resolution images of sample. The area of illumination on object was 5 x 5 mm2 hence a wide field illumination is possible by present system. Since two arms of fiber-coupler are equal, therefore, adjustment of OPL is quite simple. Light transmitted through sample and reference arms was superposed at BS(size 6 mm x 6 mm) and collected by lens L4 at output and
image was relayed by camera lens (L4). A single digital interferogram at a fixed time, i. e., in single shot is recorded
using a CCD camera (Roper Scientific, Inc.) having 1392 x 1024 pixels with pixel size 6.5 x 6.5μm. This single digital interferogram is analyzed by a Fourier transform technique.
The wrapped phase map associated with complex analytic signal is [9];
k
y
x
Z
k
y
x
Z
k
y
x
;
,
Re
;
,
Im
tan
)
;
,
(
1
(3)176 |
P a g e
)
;
,
(
x
y
k
is wrapped and varies between – π to + π. The absolute phase is recovered by unwrapping the calculatedphase
(
,
)
2
,
0x
y
l
y
x
n
(4)
Where,
n
is the change in RI of object in medium, ois central wavelength of light andl
is the geometricalthickness. The refractive index of the sample can be calculated using the following expression;
x
y
n
x
y
n
x
y
n
sample,
,
medium,
IV EXPERIMENTAL RESULTS AND DISCUSSION
In the present case the onion skin was used as a sample and a digital without and with interferogram recorded by the CCD is shown in Fig.2. (a) and (b) respectively (at 632.8 nm). Fig.2 (c) shows the FFT of the spectral interferograms contained three peaks. The quantitative analysis is then performing for the final phase profiles obtained by WFDI of a digital interferogram.
Fig.2. (a) And (b) Digital Without and With Interferogram of Onion Skin (632.8 Nm) Respectively.
(a)
(b)
First order peak
DC peak
Complex conjugate 1
stpeak
177 |
P a g e
Fig.2. (c) and (d) Are FFT Of Interferogram An Onion And Wrapped Phase Map Of Onion Skin respectively.Fig.2. (e) and (f) are unwrapped phase map and refractive index profile of onion skin respectively. The color
bar shows quantitative phase in radians.
The complex analytical signal is formed with the help of Fourier transform. The wrapped phase map can be obtained using Eq. (3) and was unwrapped using a MATLAB code. The wrapped and unwrapped phase maps of onion skin are shown in Figs. 2(d) and 2(e) respectively where the color bar shows quantitative phase in radians. The selected size of the sample is in X-axis and Y- axis is 180μm and 200μm, respectively.
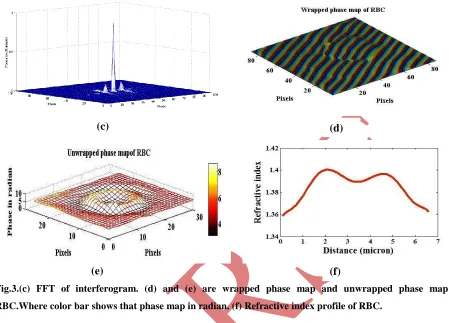
The sample was changed with RBCs. The experiment was repeated after two hours of the preparation of the blood cell sample. Fig 3(a) shows the interferogram without RBCs and Fig.3 (b) with RBCs at 632.8nm, respectively. In this figure the X and Y-axis are shown in Pixels whereas the total selected size of the sample area is in X and Y-axis is 20μm and 20μm, respectively, Fourier spectrum of interferogram is shown in Fig.3(c) (FFT of interference fringe signal at fixed position). The quantitative analysis is then performing for the final phase profiles obtained by WFDI of a digital interferogram. The complex analytical signal is formed with the help of Fourier transform. The wrapped phase map can be obtained using Eq. (3) and was unwrapped using a MATLAB code. The wrapped and unwrapped phase maps of RBCs are shown in Figs. 3(d) and 3(e), respectively where the color bar shows quantitative phase in radians.
Fig.3.Recorded Interferogram (a) without RBCs and (b) with RBCs using wavelength = 632.8 nm.
(e)
(f)
178 |
P a g e
Fig.3.(c) FFT of interferogram. (d) and (e) are wrapped phase map and unwrapped phase map ofRBC.Where color bar shows that phase map in radian. (f) Refractive index profile of RBC.
The present technique is very useful for transmission geometry and the field of view is large but the focus plane is localized. The system works on the principle of off-axis interferometry. Fourier transform fringe analysis was used for reconstructing the phase map and refractive index (RI) of the objects. From the phase map the refractive index was calculated. The refractive index obtained was 1.488 with thickness of onion cell 50µm.The refractive index of
onion cell by earlier reported method is 1.402.Therefore,our results are close to the values repeated earlier.
Figure 3(f) shows the refractive index profile of the RBC. Average refractive index of RBC was found to be 1.406 by the present method. Generally the refractive index of RBC is within range of 1.38-1.40. The values refractive index by present method is quite close.
V CONCLUSIONS
The present technique is very useful for transmission geometry and the field of view is large but the focus plane is localized. The system works on the principle of off-axis interferometry. Fourier transform fringe analysis was used for reconstructing the phase map and refractive index (RI) of the objects. In finally a transmission mode off-axis WFDIM system has been realized and implemented for the imaging of onion cells and RBCs. Quantitative phase images of onion cells and RBCs were reconstructed in single shot. The present system is useful to study the transparent biological samples. System is compact, light throughput is more and can cover large area of the sample.
(c)
(d)
179 |
P a g e
Also it is easy to align. The present fiber optic MZI based transmission mode off-axis WFDIM system may lead to volumetric and quantitative imaging of the transparent samples with high resolution and high signal to noise ratio.
VI ACKNOWLEDGEMENTS
Financial assistance from DST Delhi, Govt. of India for the project No. SR/S2/LOP-0021/2008 is gratefully acknowledged. The authors are also thankful to Mr. F. C. Saini working in pathology lab at the Indian Institute of
Technology Hospital for providing the biological samples.
REFERENCES
[1] F. Zernike, Phase contrast, A new method for the microscopic observation of transparent objects, Physica Vol.9,
1942, 686-698
[2] R. D. Allen, G.B. David, and G. Nomarski, The Zeiss-Nomarski differential interference equipment for transmitted-light microscopy, Z. Wiss. Mikrosk.Vol. 69, 1950, 193-221.
[3] A.Barty, A.K Nugent., D.Paganin and A.Roberts, Quantitative optical phase microscopy, Opt.Lett.Vol. 23, 1998, 817–819.
[4] U. Schnars and W. Jüptner, Off-axis digital holographic microscopy, Springer-Verlag, Heidelberg,Vol.16, 2005, 165-188.
[5] G. Popescu, L. P. Deflores and J. C. Vaughan, Fourier phase microscopy for investigation of biological structures and dynamics, Opt. Lett.Vol. 29, 2004, 21.
[6] T. Ikeda, Hilbert phase microscopy for investigating fast dynamics in transparent systems, Opt. Lett. 30, 2005, 1165-1167.
[7] N. Lue, W. Choi, G. Popescu, T. Ikeda, R. R. Dasari, K. Badizadegan and M. S. Feld, Quantitative phase imaging of live cells using Diffraction phase microscopy, Appl. Opt.Vol. 46, 2007, 1836-1842.
[8] G. Popescu, Quantitative Phase Imaging of Cells and Tissues (McGraw-Hill, 2011).
[9] D. J. Bone, H. A. Bachor and R. J. Sandeman, Fringe-Pattern Analysis Using a 2-D Fourier Transform, Appl. Opt. Vol.25, 1986, 1653-1660.