Shuhaizar Daud et al,International Journal of Computer Science and Mobile Computing, Vol.3 Issue.2, February- 2014, pg. 709-715
© 2014, IJCSMC All Rights Reserved 709
Available Online atwww.ijcsmc.com
International Journal of Computer Science and Mobile Computing
A Monthly Journal of Computer Science and Information Technology
ISSN 2320–088X
IJCSMC, Vol. 3, Issue. 2, February 2014, pg.709 – 715
RESEARCH ARTICLE
CPU Power Prediction on
Modern Multicore Embedded Processor
Shuhaizar Daud
1, R. Badlishah Ahmad
2, Ong Bi Lynn
3¹Kluster Embedded Computing,
Unit Kluster Penyelidikan Universiti Malaysia Perlis, Jalan Pangkalan Assam, 01000 Kangar, Perlis, MALAYSIA 1
[email protected]; 2 [email protected]; 3 [email protected]
Abstract— In this paper we put a modern multicore embedded processor in a load controlled environment and test its actual power consumption during idle and on active state. In order to retain the highest accuracy during measurement, we carried out the measurement directly on the processor power supply line during runtime. The test processors are loaded at a specific threshold and the actual power consumption during execution are measured and logged in real time. We have found out that on a modern embedded processors such as on our test platform, the idle and active power requirement are more dependent on processor load rather than CPU vcore or CPU execution frequency.
Keywords— embedded linux; multicore; power efficiency; mobile computing
I. INTRODUCTION
Linux is fast becoming a major player in the embedded devices platform. With projections from research firms suggesting that shipping of Internet connected devices and Internet of Things (IoT) embedded devices surpassing the shipment of personal computers and smartphones, it is more imperative that maximum energy efficiency are extracted from the devices so that operational time of the devices are prolonged.
With the advent of multicore processors and cheaper costs to integrate them into an embedded device, more and more manufacturers are using such processor and solution in their final product. In this paper we take a look at the power prediction equation used to predict the power requirement of processors and validate their adaptability to predict the power requirement of current crop of multicore embedded processors available on the market.
II. LINUX CPUTHROTTLING MECHANISM
Shuhaizar Daud et al,International Journal of Computer Science and Mobile Computing, Vol.3 Issue.2, February- 2014, pg. 709-715
© 2014, IJCSMC All Rights Reserved 710
The governors available for use are:
Userspace - user set, userspace specified frequency, locked according to user request.
Performance - CPU statically to the highest frequency within the borders of scaling_min_freq and scaling_max_freq.
Powersave - CPU statically to the lowest frequency within the borders of scaling_min_freq and scaling_max_freq.
Ondemand - Set the CPU frequency according to the CPU load.
Conservative - Set the CPU frequency accordint to CPU load, gradual increase & decrease.
Although introduced in late 2004, the ondemand governor is still considered as the best CPU scaling algorithm available in Linux [2, 4]. Development of the ondemand governor are based on the assumption that the power requirement of CPU scales according to the current clock frequency of the processor [6,7,8]. The development of the governor itself are made around processor technology available back in 2004 and since then numerous technological advancement have been made in CMOS and processor technology and processor power management solutions. In this paper we used the userspace governor to lock the processor speed to a fixed speed throughout the testing procedure.
III.CPUPOWER USAGE PREDICTION
In past research, it is found that the power consumed by a CPU during operation is linear to the CPU clock frequency [6,7,8]. Simulation based power measurement prediction assumes that the CPU power consumption is calculated as the cube of frequency, which do not take into account the processor’s idle power requirement [6]. Simulated power consumption assumes that power consumption of the CPU is calculated with the equation
below:
where P is the active power consumption, S3 is a constant and f is the frequency (Equation 1).
This equation depends heavily on the CPU frequency to be a major contributor to the active power consumption. According to the equation, reduction in the clock frequency will greatly affect the active power. Another generally used equation to predict CPU power consumption comes in the form of CMOS power usage equation given below:
where P is power consumed, C is capacitance, V is supply voltage and f is the frequency (Equation 2).
Equation 2 depends heavily on CPU core voltage to affect the total power consumed. Since the CPU supply voltage is squared, any changes to supply voltage will have the biggest effect to the power consumption. Both equations do not consider the idle power requirement which is usually much smaller compared to the active state. During idle state, modern CPU have significantly smaller power requirement compared to during heavy operation. Failure to take this into consideration leads to a very different between predicted and actual measured power consumption. While both equations provide sufficient precision in predicting the active state power consumption, this is usually not the case during for actual operation whereby the processor would be sitting idly while waiting for incoming jobs [6]. This is particularly true for an embedded system where the processor would be waiting in idle mode most of the time.
IV.CPUPOWER MEASUREMENT PLATFORM
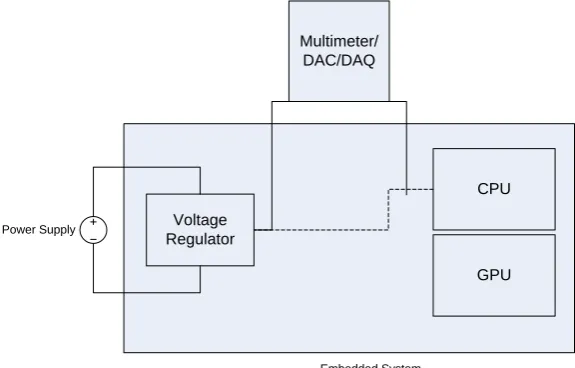
In order to get the highest accuracy of power measurement, the actual power consumption of the test platform must be carried out during operation in real time. Instantaneous current draw and CPU vcore supply must be measured and logged during the testing procedure. To avoid unnecessary component such as the network controller and display adapter from interfering with the measurement and affecting CPU power measurement accuracy [2], power consumption data have to be logged at the CPU power supply line. CPU power measurement setup is given in the figure below:
3 3
f
S
P
active
f
CV
Shuhaizar Daud et al,International Journal of Computer Science and Mobile Computing, Vol.3 Issue.2, February- 2014, pg. 709-715
© 2014, IJCSMC All Rights Reserved 711
Power Supply Voltage
Regulator
CPU
GPU Multimeter/
DAC/DAQ
Embedded System
Fig 1: CPU power measurement setup.
A modern CPU developed particularly for embedded systems consisting of the Intel Atom N2800 multicore CPU have been chosen for implementation. The embedded platform consisting of an Intel Desktop Board DN2800MT has been used. The board follows mini-ITX specification and powered by a single DC power supply without any active cooling. The CPU supports 5 different frequency states (0.798, 1.064, 1.33, 1.596 and 1.862 Ghz) which could be manipulated through the cpufreq interface. The processor also has 2 different cores which could be manipulated differently from each other.
A stress loading sequence is used to provide a test load to the processor. The stress sequence is then load limited by the cpulimit patch to lock the CPU percentage to a specific level.
V. IDLE &ACTIVE POWER CONSUMPTION
To get an accurate reading on the idle power state and their effect to the total CPU power consumption, we have limited the processor load to 0% (fully idle), 20%, 40%, 60%, 80% and 100% cpu load. Processor voltage (vcore), current draw and power use are measured in real time during the workload and graphed in the figure below:
Power usage at 0.798GHz, 20% load
vcore (V)
1.06 1.07 1.08 1.09 1.1 1.11 1.12
power (W) & current (A)
0.2 0.4 0.6 0.8 1 1.2 1.4 1.6 1.8
time (s)
0 20 40 60
power (W) current (A) vcore (V)
power (W) current (A) vcore (V)
Shuhaizar Daud et al,International Journal of Computer Science and Mobile Computing, Vol.3 Issue.2, February- 2014, pg. 709-715
© 2014, IJCSMC All Rights Reserved 712
Measurement at 20% CPU load at the lowest speed (0.798GHz) have shown that while the CPU vcore remain relatively stable across the entire testing procedure, there exist for a few brief second where the CPU voltage drops. This produces a small hole in the vcore plot at the 25 second and 40 second mark. CPU power consumption is relatively unchanged during this brief moment of voltage drop and closely tracks the rise of CPU current requirement.
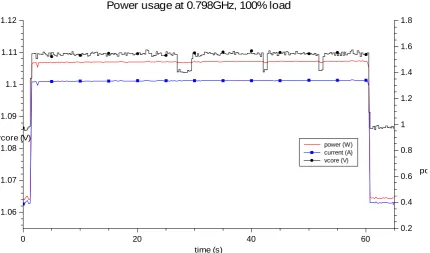
Power usage at 0.798GHz, 100% load
vcore (V)
1.06 1.07 1.08 1.09 1.1 1.11 1.12
power (W) & current (A)
0.2 0.4 0.6 0.8 1 1.2 1.4 1.6 1.8
time (s)
0 20 40 60
power (W) current (A) vcore (V)
power (W) current (A) vcore (V)
Fig. 3: CPU power usage at lowest speed (0.798GHz), 100% load.
Further measurement at 100% CPU load also produced similar characteristics as previous test at 20% CPU load. The CPU vcore at 27 second, 42 second and at 51 second mark are reduced for a brief moment as detected by the logging equipment but such reduction are not reflected in the final CPU power & current usage. While there is a reduction in the CPU vcore value, the actual CPU current draw and power use stays relatively unchanged. Both measurement results have shown that while CPU vcore have an impact on to the current draw and power usage, the effects are not as significant as suggested in Equation 2.
Shuhaizar Daud et al,International Journal of Computer Science and Mobile Computing, Vol.3 Issue.2, February- 2014, pg. 709-715
© 2014, IJCSMC All Rights Reserved 713 Power usage at 1.862GHz, 20% load
vcore (V)
1.06 1.07 1.08 1.09 1.1 1.11 1.12
power (W) & current (A)
0.2 0.4 0.6 0.8 1 1.2 1.4 1.6 1.8
time (s)
0 20 40 60
power (W) current (A) vcore (V)
power (W) current (A) vcore (V)
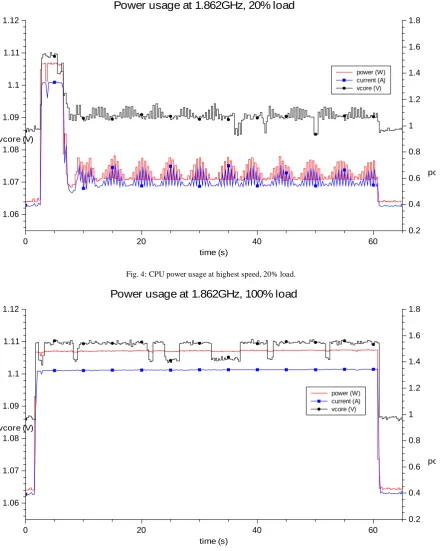
Fig. 4: CPU power usage at highest speed, 20% load. Power usage at 1.862GHz, 100% load
vcore (V)
1.06 1.07 1.08 1.09 1.1 1.11 1.12
power (W) & current (A)
0.2 0.4 0.6 0.8 1 1.2 1.4 1.6 1.8
time (s)
0 20 40 60
power (W) current (A) vcore (V)
power (W) current (A) vcore (V)
Fig. 5: CPU power usage at highest speed, 100% load.
Shuhaizar Daud et al,International Journal of Computer Science and Mobile Computing, Vol.3 Issue.2, February- 2014, pg. 709-715
© 2014, IJCSMC All Rights Reserved 714
CPU power consumption at 20% load
lowest speed (0.798 GHz) & highest speed (1.862 GHz)
power (W)
0.2 0.4 0.6 0.8 1 1.2 1.4 1.6
time (s)
0 10 20 30 40 50 60 70
lowest speed (0.798GHz) highest speed (1.862GHz)
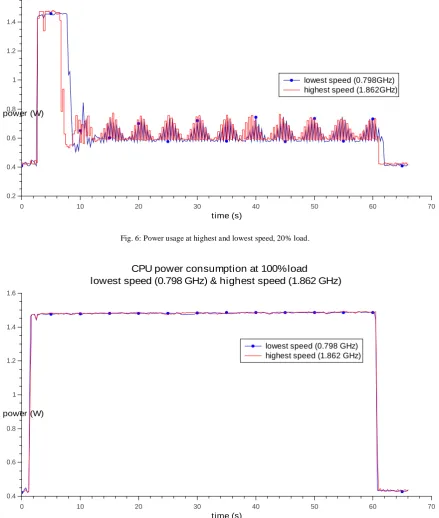
Fig. 6: Power usage at highest and lowest speed, 20% load.
CPU power consumption at 100% load
lowest speed (0.798 GHz) & highest speed (1.862 GHz)
power (W)
0.4 0.6 0.8 1 1.2 1.4 1.6
time (s)
0 10 20 30 40 50 60 70
lowest speed (0.798 GHz) highest speed (1.862 GHz)
Fig. 7: Power usage at highest and lowest speed, 100% load.
Comparison on the actual CPU power consumption at lowest and highest speed shows that there is marginal improvement to the power usage by executing a particular process at the lowest speed versus at the highest speed. While there is a difference as shown in Figure 6 while working on a low load situation, the variation in power use is lower when executing high load process (Figure 7).
Shuhaizar Daud et al,International Journal of Computer Science and Mobile Computing, Vol.3 Issue.2, February- 2014, pg. 709-715
© 2014, IJCSMC All Rights Reserved 715
By using the CPU power measurement process as described in Figure 1, it is found that the idle and active power consumption of an embedded processor is significantly different compared to the predicted result provided by both power prediction equation. While there is a difference, it is not as significant as outlined by both equations.
VI.CONCLUSION
From the tests that we have carried out, we have shown that the modern embedded processor that were tested are more affected by the CPU load rather than the CPU vcore and CPU frequency as suggested by the prediction equation. CPU power requirement at maximum and minimum execution speed shows far less difference when the processor load is at similar level. This suggests that the power requirement of modern embedded processor during idle are less significant than what was suggested by previous power prediction equation. This opens up a possibility to further improve embedded Linux CPU throttling mechanism by allowing a CPU to hold high frequency for longer periods of time to help accelerate run-to-idle time.
REFERENCES
[1] Michael Kadin and Sherief Reda, Frequency and Voltage Planning for Multi-Core Processors Under Thermal Constraints, IEEE (2008).
[2] Venkatesh Pallipadi and Alexey Straikovskiy, The Ondemand Governor: Past, Present and Future, Linux Symposium, Volume 2 (2006), pg. 223-238.
[3] Venkatesh Pallipadi, Enhanced Intel Speedstep Technology and Deman-Based Switching on Linux, Intel Developer Article, Intel.com
[4] Fedora Project Documentation, Power Management Guide: Using CPUfreq Governors, docs.fedoraproject.org, March 2013.
[5] R. Ayoub, U. Ogras, E. Gorbatov et. all: OS-level Power Minimization Under Tight Performance Constraints in General Purpose Systems, IEEE (2011).
[6] Sonal Saha and Binoy Ravindran: An Experimental Evaluation of Real-Time DVFS Scheduling Algorithms, SYSTOR’12, Haifa, Israel (2012)
[7] M. P. Lawitzky, D. C. Snowdon and S. M. Petters: Integrating Real Time and Power Management in a Real System, Workshop on Operating Systems Platforms for Embedded Real-Time applications (OSPERT 2008), Czech Republic (2008)
[8] Haklin Kimm, Sung Shin and Chang Oan Sung: Evaluation of Interval-based Dynamic Voltage Scaling Algorithms on Mobile Linux System, SAC’ 07, Seoul, Korea (2007)