ABSTRACT
HUTCHISON, KIMBERLY, N. Dissolution of Phosphate in a
Phosphorus-Enriched Ultisol as Affected by Microbial Reduction.(Under the direction of Dr. Dean L. Hesterberg).
Knowledge of the effect of reduced soil redox conditions on P dissolution is needed to better assess P mobility to surface or ground water. The objectives of our study were to determine the effect of microbial reduction on P dissolution and determine mechanisms of P release in a reduced soil. Duplicate
suspensions of silt+clay from a Cape Fear sandy clay loam were reduced in a continuously-stirred redox reactor for 40 d. We studied the effects of three treatments on P dissolution: (i) 2 g dextrose kg-1 solids added as a microbial carbon source at time 0 d; (ii) 2 g dextrose kg-1 solids split into three additions at 0, 12, and 26 d; and (iii) no added dextrose. Regardless of treatment or variation in the intensity of reduction rates, dissolved reactive P (DRP) increased up to 7-fold from 1.5 to 10 mg L-1 and was linearly related (R2 = 0.79) with dissolved organic C. Dissolved Fe and Al and pH also increased, suggesting the formation of aqueous Fe- and Al-dissolved organic matter (DOM) complexes. Separate batch experiments were performed to study the effects of increasing pH and citrate additions on PO4 dissolution under aerobic conditions. Increasing
DEDICATION
I would like to dedicate this thesis to my husband Robert and our children Jessica, Elizabeth, Brian, and Michael. Each of you have given me a special gift that has helped me to succeed. Thank you - Robert for always directing
me towards logical thinking, - Jessica for strength of personality, - Elizabeth for humor and kindness, - Brian for determination, and - Michael for joyful
exuberance.
BIOGRAPHY
Kimberly Jane Hutchison was born August 31, 1958, in Bath, New York. In 1978, Kim married Robert A. Hutchison and over the next nine years they were blessed with the birth of their children Jessica, Elizabeth, Brian, and Michael. In 1986, Kim began her pursuit of a college education attending, part-time, Davidson County Community College in Lexington, N.C. In 1993, she received the Puterbaugh Chemist of the Year award and her Bachelors of Art degree in chemistry from the University of North Carolina at Greensboro, Greensboro, N.C. In 1995, Kim was hired as a Research Technician working with Dr. Dean Hesterberg, soil physical chemist, in the Department of Soil Science at North Carolina State University, Raleigh, NC. Kim was excited to apply her knowledge of chemistry and inorganic synthesis to practical
environmental problems involving heavy metal transport in soils, as well as, learning to synthesize soil minerals used in research studies. As Kim continued her work in the Department of Soil Science, she learned how important soil science was to the environmental protection of our soil and water resources and sustainable agriculture. These realizations led Kim to become a Masters of Science candidate while continuing her present job as a Research Technician.
ACKNOWLEDGEMENTS
I would like to thank Dr. Dean Hesterberg who acted as my major professor for his support and invaluable advice throughout this research. I will always remember the patience, positive attitude, and energetic enthusiasm for research and teaching that he exhibited. One of the most important qualities I learned from Dr. Hesterberg was to have the confidence to continually think of and make improvements for any task or experiment in order to perform at a higher level. I thank him for recognizing my passion for research and agreeing to mentor me as a student while I was working full-time in his research program. I would like to thank Drs. Michael Vepraskas and Phil Westerman for serving on my committee and adding valuable insight and recommendations as this research project developed. Sincere thanks to Dr. Suzanne Beauchemin for advice on soil extraction methods and for her help in performing XANES spectroscopy on reactor samples in the early stages of this research project. I am indebted to Elizabeth Hutchison for her excellent help with soil collection and laboratory assistance. I extend sincere thanks and appreciation to Dr. Wayne Robarge and Guillermo Ramirez for their patience and guidance in analytical techniques and instrumentation.
Many thanks to the professors, staff, and students (too numerous to mention) that I have been privileged to know and interact with during the time I have been a part of the Department of Soil Science at North Carolina State University. Each interaction has formed a collection of fond memories I have of
this time. I extend heartfelt thanks to Peggy Longmire, Daphine McKinney, and Ji Su Bang. I will always remember their friendship and support during this time.
Finally, there are not appropriate words to acknowledge the gratitude I feel towards my family to whom this work is dedicated. Through the course of good and bad days, long nights and weekends, they were a constant in my life.
TABLE OF CONTENTS
Page
LIST OF TABLES……….viii
LIST OF FIGURES………ix
CHAPTER 1 INTRODUCTION AND LITERATURE REVIEW………..1
Rationale………1
Redox potential……….2
Redox reactions………2
Effect of redox on the dissolution of phosphate………...4
Reductive dissolution of Fe(III) oxides………..5
Analysis of solid-phase P speciation…….………8
Objectives………10
References………..11
2 PHOSPHATE DISSOLUTION IN A PHOSPHORUS-ENRICHED ULTISOL AS AFFECTED BY MICROBIAL REDUCTION………21
Abstract………22
Introduction………..23
Materials and methods………..27
Results……….34
Discussion………38
Conclusions……….43
References………..44
APPENDICES………..59 APPENDIX A: Supplementary figures.………59 APPENDIX B: Solid phase speciation analysis by X-ray absorption near edge structure (XANES) spectroscopy……….62
LIST OF TABLES
Page Table 1.1: Partial review of some P saturation indices used in different
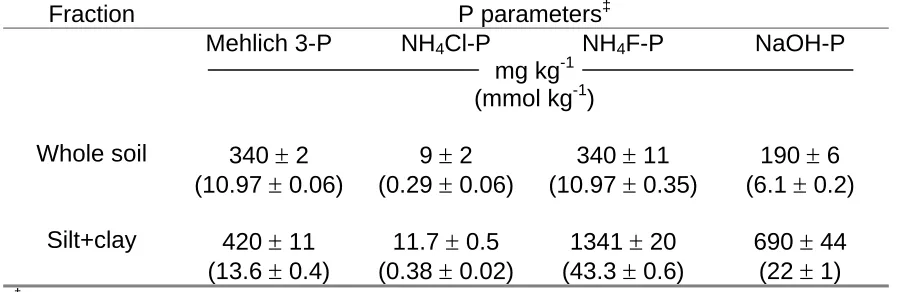
studies for acidic soils………16 Table 2.1: Selected properties of whole soil samples from the Cape Fear soil, and the silt+clay fraction used in this study………..…..50 Table 2.2: Phosphorus parameters of the whole soil and silt+clay samples from the Cape Fear soil used in this study……….…...……..51
LIST OF FIGURES
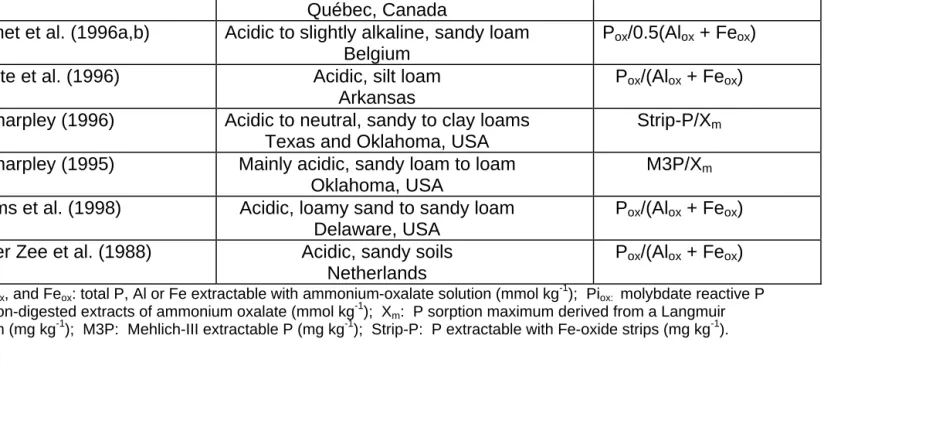
Page Figure 1.1: Pathways for the transfer of P from terrestrial to aquatic
ecosystems...17 Figure 1.2: Some mechanisms of phosphate dissolution and mechanisms of removal from soil solution that may occur during the reduction of an acid soil....18 Figure 1.3: Background and baseline corrected x-ray absorption spectrum of phosphorus in crystalline FePO4 • 2H2O (strengite) showing the pre-edge,
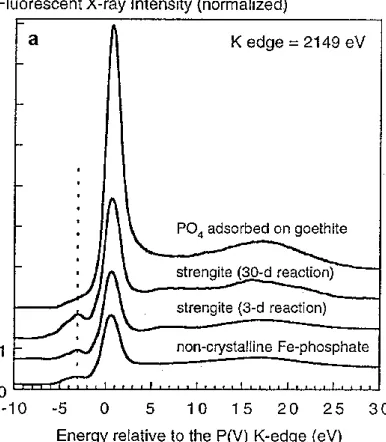
absorption edge, and extended regions of the spectra...19 Figure 1.4: Stacked phosphorus K-XANES spectra for (a) non-crystalline iron phosphate, adsorbed phosphate, and strengite of varying crystallinity as induced by hydrothermal treatment time, and (b) for selected Ca-phosphate minerals and a soil sample (Hesterberg et al., 1999). The black-dotted line shows the pre-edge feature associated with Fe(III)-phosphate minerals (a), and the red-dotted line shows a post-edge feature associated with Ca-phosphate minerals (b)...20 Figure 2.1: Trends in redox potential (Eh), pH, and cumulative evolved CO2(g)
over a 40-d anaerobic reduction period of the silt+clay suspension for the control, 0-d, and spiked-addition treatments. Arrows denote times of dextrose addition. Error bars represent the standard deviation in measurements
between duplicate reactors for each treatment……….52 Figure 2.2: Trends in dissolved organic carbon (DOC) and dissolved reactive P (DRP) over a 40-d anaerobic incubation period of the silt+clay suspension for the control, 0-d, and spiked-addition treatments. Error bars represent the standard deviation in measurements between duplicate reactors for each
treatment………..53 Figure 2.3: Trends in dissolved organic carbon (DOC), Fe(II), total Fe, and Al over a 40-d anaerobic incubation period of the silt+clay suspension for the control, 0-d, and spiked-treatments. Error bars represent the standard deviation in measurements between duplicate reactors for each treatment………..54 Figure 2.4: Correlation of dissolved reactive P (DRP) and dissolved organic carbon (DOC) (mg L-1) for silt+clay suspensions undergoing a 40-d anaerobic incubation period with three treatments (control, 0-d, and spiked-addition)…….55 Figure 2.5: Edge-normalized XANES spectra comparing the pre-edge region for the silt+clay sample to the pre-edge region for the PO4 sorbed to ferrihydrite and
non-crystalline Al-hydroxide mineral standards……….56
Figure 2.6: Dissolved reactive P (DRP), DOC, total Fe and Al as affected by pH for the silt+clay suspension reacted in a batch experiment for 48 h. Average Eh of the silt+clay suspensions was 535 ± 10 mV………..57 Figure 2.7: Dissolved reactive P (DRP), total Fe and Al as affected by increasing concentration of dissolved organic carbon for silt+clay suspensions reacted with different inputs of citrate for 19 h at pH 6.93 ± 0.06. Average Eh of the silt+clay suspensions was 454 ± 15 mV……….58 Figure A1: Schematic of the experimental setup for the reduction reactors…....60 Figure A2: Schematic of the sampling procedure for the reduced silt+clay
suspensions……….61 Figure B1: Normalized phosphorus K-XANES spectra for moist silt+clay
samples taken at time 0d, and at 40d for duplicate reactors (labeled 1 and 2) receiving 2 g dextrose kg-1 solids added at time 0d (0-d treatment,
Chapter 2)………68 Figure B2: Pre-edge region of the normalized phosphorus K-XANES spectra for moist silt+clay samples taken at time 0d (replicate 1), and at 40d for duplicate reactors (replicate 1 and 2) receiving 2 g dextrose kg-1 solids added at time 0d (0-d treatment, Chapter 2)………69 Figure B3: Normalized phosphorus K-XANES spectra for silt+clay samples taken at time 0d (t0 d), 5d (t5 d), 18d (t18 d), and 37d (t37 d) during a preliminary experiment treated with 2 g dextrose kg-1 solids added at time 0d………...70 Figure B4: Pre-edge region of the normalized phosphorus K-XANES spectra for silt+clay samples taken at time 0 d (t0 d), 5 d (t5 d), 18 d (t18 d), and 37 d (t37 d) during a preliminary experiment treated with 2 g dextrose kg-1 solids added at 0d……….71 Figure B5: Normalized phosphorus K-XANES spectra for 400 mM P + 500 mM Fe kg-1 HA, PO4 sorbed to ferrihydrite, and 50 mM H3PO4 and 0 mM Fe
aqueous solution...72 Figure B6: Pre-edge region of the normalized phosphorus K-XANES spectra for 400 mM P + 500 mM Fe kg-1 HA, PO4 sorbed to ferrihydrite, and 50 mM H3PO4
and 0 mM Fe aqueous solution...73
CHAPTER 1
INTRODUCTION AND LITERATURE REVIEW
Rationale
Long-term application of animal waste and fertilizers to agricultural land has resulted in elevated soil P concentrations. For years, fertilizers and animal waste have been applied to soils to meet the crop nitrogen (N) requirements. This has led to a 3- to 5- fold over-application of P to soils (Mikkelsen, 1997). In the United States, Europe and Canada, surface soil accumulations of P have increased to the extent that the loss of P in drainage waters and in runoff discharged to surface waters has become a management concern (Breeuwsma and Schoumans, 1987; Federico et al., 1981; Sallade and Sims, 1997a).
Phosphorus enrichment of surface waters stimulates excessive plant and algal growth, commonly referred to as eutrophication. Increased growth and decreased dissolved oxygen from P enrichment degrades water quality through increased costs of water purification, decreased aquatic species, decreased lake depths, and increased public concern over toxic and non-toxic algae (Pierzynski et al., 1994). Surface runoff of soluble P and particulate P, and P loss via subsurface flow are major pathways for P to enter surface waters (Figure 1.1) (Calvert, 1975; Hergert et al., 1981; Izuno et al., 1991). Decades of research have provided an understanding of soil P dynamics and release to runoff (Daniel et al., 1998; Sims et al., 1998). However, many of the dissolution and transport processes of soils enriched with P are not understood well enough to predict P loss quantitatively.
When P-enriched soil becomes waterlogged or particulate P is transported to surface waters the soil or soil particles encounter anoxic conditions and the oxidation-reduction (redox) potential decreases (Patrick et al., 1996). Redox Potential
Soil redox potential has been positively correlated with net P dissolution (Patrick and Khalid, 1974; Holford and Patrick, 1981; Willet, 1989; Sallade and Sims, 1997b; Phillips, 1998). Poorly-drained soils and soils that have a fluctuating water table exhibit lower redox potentials. Soils with a lower redox potential (more
reduced conditions) generally show enhanced P mobility. As the soil water content decreases, the redox potential will increase and likely inhibit P mobility.
The Coastal Plain region of North Carolina consists primarily of poorly-drained agricultural soils with subsurface drainage and soils with sandy surface horizons that have a low P sorption capacity. Many of these soils have elevated P concentrations due to long-term application of animal wastes (Hamm, 1999). In poorly-drained agricultural soils controlled drainage is used as a best management practice (BMP) to reduce the loss of nitrates from the soil by artificially raising the water table using a structure installed in the drain (Gilliam et al., 1997). Therefore, there is an increased risk of P mobility as these soils become saturated and the redox potential is lowered.
Redox reactions
Measured redox potential decreases as a soil becomes reduced. Soil reduction is usually a result of microbes oxidizing organic carbon compounds to obtain energy. The oxidation of carbon must be coupled with the reduction of an
electron acceptor in a thermodynamic sequence such as O2, NO3, Mn(IV), and
Fe(III). As the redox potential decreases, the following sequence of reduction
reactions typically occurs: O2(g) to H2O(l), NO3(aq) to N20(g) or N2(g), solid-phase Mn(IV)
oxides to Mn2+(aq), solid-phase Fe(III) hydrous oxides to Fe2+(aq), SO42-(aq) to HS- (aq)
or H2S(g), and finally CO2(g) to CH4(g) (Pierzynski et al., 1994).
Soil reduction (lower redox potential) can affect the solid-phase speciation of minerals, such as Fe(III) oxides (Brennan and Lindsay, 1998; Khalid et al., 1977). Vepraskas et al. (1999) studied the development of hydric soil field indicators that are formed by Fe(III) reduction in a created marshland. These depleted matrix indicators appear as the soil becomes gray, a result of Fe(III) oxides being reduced to soluble Fe(II) and leaching from the soil. Often, the soil is mottled (streaked with orange or red), as the soluble Fe(II) re-precipitates as Fe(III) oxides when the reduced iron encounters zones of oxygen. Brennan and Lindsay (1998) found that the reduction of Fe(III) oxides in laboratory reactors resulted in the dissolution and precipitation of two distinct Fe3O4 minerals. Khalid et al. (1977) showed differences
in the ratio of P sorption to oxalate-extractable iron (oxalate removes poorly crystalline and amorphous iron, and organic matter-associated Fe) for separate samples of Alfisols or Inceptisols that were reduced or oxidized for 15 days. The isotherms for the reduced treatments showed a higher correlation between P sorption and oxalate-extractable iron. This apparent increase in amorphous iron mineral species under reduced conditions would increase the reactive surface area, which could explain the greater P sorption capacity of these soils.
These results indicate a change in the crystalline phase of iron under reduced
conditions. Since P is often associated with iron (manganese) oxide minerals, the solid-phase speciation of soil phosphorus may change as the solid-phase speciation of the iron (manganese) mineral changes. These changes can impact processes that control P solubility such as sorption, surface complexation, and precipitation reactions.
Effect of redox on the dissolution of phosphate
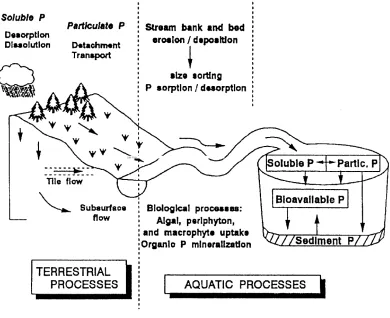
As the redox potential decreases changes in the solid-phase speciation of phosphorus can occur (Roden and Edmonds, 1997; Willet, 1985) resulting in simultaneous phosphate dissolution and removal mechanisms in the soil solution. Figure 1.2 illustrates how the reduction of Mn(IV)- and Fe(III)-minerals could affect the dissolution and speciation of P in soil. First, dissolution of iron oxides should release sorbed P into solution and continued reduction should release occluded or co-precipitated P. Roden and Edmonds (1997) showed P sorption to Fe(II)-minerals after oxide minerals underwent microbial reduction. At the same time, Fe(III)-phosphate minerals, such as strengite (FePO4 • 2H2O), could undergo reductive
dissolution (Lindsay, 1979; Willet, 1985; Miller et al., 1993). Fe(II)- and Mn(II)-phosphate minerals have been shown to precipitate under reduced conditions. Friedl et al. (1997) showed by electron microprobe analysis, the precipitation of (Fe,Mn)3(PO4)2 • 8 H2O from MnO2 (H+-birnessite) in anoxic sediment. Willet (1985)
showed the precipitation of the Fe(II)-phosphate mineral, vivianite ([Fe3(PO4)2 • 8
H2O]), after strengite was reduced for 11 days.
Phosphorus can be sorbed to aluminum hydroxide and aluminosilicate minerals that are not generally affected by reductive dissolution. Also, the
precipitation of aluminum phosphates can occur as the soil becomes reduced
(Tiessen, 1995). The concentration of dissolved aluminum in soil is higher at a lower pH (Lindsay, 1979). As iron oxides with sorbed or occluded P undergo reductive dissolution, the concentration of P in solution will increase. The precipitation of aluminum phosphates can occur if the concentrations of both P and Al are high enough (Tiessen, 1995). As the soil is reduced, the pH tends to increase and lower the concentration of dissolved aluminum in the soil solution. Phosphate dissolution and changes in solid-phase P species are further complicated by other reactions involving organic matter where complexation of cations by dissolved organic matter (DOM) with subsequent binding of PO4 and competitive adsorption for mineral
surfaces between PO4 and DOM (Gerke, 1992, 1993, 1997; Gerke and Hermann,
1992; Violante, 1991) can occurr. Reductive dissolution of Fe(III) oxides
The reductive dissolution of Fe(III) oxides has been related to the release of P under reducing conditions in flooded soils and sediments (Holford and Patrick, 1981; Willett, 1989; Roden and Edmonds, 1997; Phillips, 1998; Jensen, et al., 1998;
Sallade and Sims, 1997b). Sallade and Sims (1997b) correlated total Fe-oxide content with soluble P after soils were flooded under anoxic conditions for 21 days. Operationaly-defined chemical fractionation of solid-phase inorganic P in sediments (Sallade and Sims,1997b) and in soil (Maquire et al., 2000) showed Fe-associated P and Al-associated P to be the predominant inorganic P forms. Many of the P
saturation indices that have been used to asses the relationship between excess soil P on P desorbability and the subsequent loss of P via surface or subsurface
pathways contain variables describing relationships between Fe, Al, and P (Table 1.1; Beauchemin and Simard, 1999).
Many researchers proposed that the soil P saturation index variable would be able to better predict the risk of P loss (Sharpley 1995; Beauchemin et al., 1996; Pote et al., 1996) since the variable relates an “intensity factor” (solution P
concentration) with a “capacity factor” (P sorption capacity) and is often described as linear (Kuo et al., 1988; Giroux et al., 1996; Lookman et al., 1996; Sharpley 1996). However, Sims et al. (1998) observed that soils having a degree of P saturation (DPS) > 25% tended to have higher desorbable P values. Beauchemin and Simard (1999) state that the variablity of P solubilty and P saturation index are related to the range of soils tested and the types of extractants used (e.g. Soil Test Phosphorus). The P saturation index usually explains a larger variation of P solubility than a particular single extractant, however, it has been observed that the proportion of unexplained variation in P solubility will be greater over a wider range of soils studied (Beauchemin and Simard, 1999). While there seems to be agreement on the importance of iron oxides on P sorption capacity, it does not fully explain observed differences of P solubility under reduced conditions.
For example, in laboratory studies Willet (1989) compared 1 M acetate
extractable P for 18 soils that were flooded (reduced) for 4, 8, 16, or 32 days. While extractable Fe(II) [indicating reduction of Fe(III)] was positively correlated with
extractable P, he could not adequately relate changes in extractable P to just one single chemical property. For example, in comparing 1 M acetate extractions for a reduced Haplumbrept (prairie soil, pH 5.2) and a Haplaquept (alluvial soil, pH 5.3)
both soils showed similar increases in extractable Fe(II) and P. However, after reduction of a Paleustalf (yellow, podzolic soil, pH 6.6) soil extractable Fe(II) and P showed similar P concentrations but 8% less Fe(II) than the Haplumbrept and Haplaquept soils. Willet (1989) speculated that differences in the amount of
extractable P were due to re-adsorption of P to mineral surfaces and interaction with organic matter. Competing processes such as, desorption, sorption and interactions with organic matter make it apparent that the prediction of P dissolution in reduced soils cannot be simply correlated to an operationally-defined chemical fraction for Fe-associated P in fractionation methods such as Mahapatra and Patrick (1971). The study by Willet (1989) exemplifies the difficulty in trying to correlate specific chemical properties that control P dissolution over a range of soils with different chemical and physical properties.
Holford and Patrick (1981) studied the effects of the reduction of an acid soil on P sorption capacity over time. They discovered that the time dependence of competing reactions in the soil matrix is important in understanding simultaneous dissolution and removal mechanisms that govern the net release of P.
Understanding the time dependence of these mechanisms could also help explain results of previous studies where changes in P sorption were evaluated once at the end of a reduction period (Khalid et al., 1977; Ponnamperuma, 1972). Suspensions of silty loam soil were incubated under reduced conditions for 45 days (Holford and Patrick, 1981). After 1 day of reduction there was a large increase in P sorption, evidenced by a decrease in dissolved phosphate, and an apparent decrease in sorption between the 2nd and 18th day. During this time, an increase in dissolved
Fe(II) concentrations suggested an increase in the dissolution of iron hydrous oxides, possibly releasing sorbed/occluded P (Willett, 1989; Roden and Edmonds, 1997; Phillips, 1998; Jensen, et al., 1998; Sallade and Sims, 1997b). At day 27, the largest sorption of P was observed, possibly due to the precipitation of amorphous and more reactive Fe(II) hydroxide species (Arden, 1950). By 45 days, the PO4
sorption capacity of the soil had decreased and was near to that of the untreated soil (Holford and Patrick, 1981). This study implies that P dissolution may be different for soils flooded for various lengths of time. Phillips (1998) also studied P availability and sorption under alternating oxidized and reduced conditions. During soil
reduction, Phillips found the same initial sorption of P after one day (similar to Holford and Patrick, 1981), with an increase in dissolved Fe(II), Mn(II), and P solubility around day 21. Holford’s experiments substantiate the validity of complex simultaneous reactions occurring in the long-term reduction of soil that lead to periods of P release and sorption during the reduction period.
Analysis of solid-phase speciation
The mobilization of P in dissolved forms from a terrestrial to aquatic
ecosystem involves many complex and competing mechanisms of P dissolution and removal (Figure 1.2). Understanding these mechanisms requires that different solid-phase forms (species) of P be identified (e.g. adsorbed versus precipitated).
Chemical fractionation techniques (Hedley et al., 1982; Mahapatra and Patrick, 1969; Chang and Jackson, 1957) are important for determining operational pools of P, such as, P sorbed to oxide minerals, P associated with Ca minerals, and P associated with poorly crystalline and more crystalline iron oxide minerals.
However, these extractions may lack the ability to differentiate between related species that may affect redox behavior. For example, one extraction step in the Hedley method fractionates P associated with Fe-oxide (redox active) plus Al-oxide (non-redox active) minerals. This extraction step cannot differentiate between the Fe-oxide and Al-oxide solid-phase P species and their role in redox transformations.
X-ray absorption near edge structure (XANES) spectroscopy is a molecular-scale, physical method that can determine oxidation states and local bonding environments of a minor element in a complex matrix such as soil. Information obtained through XANES spectroscopy is important because an element is analyzed "in-situ" and is a non-destructive technique.
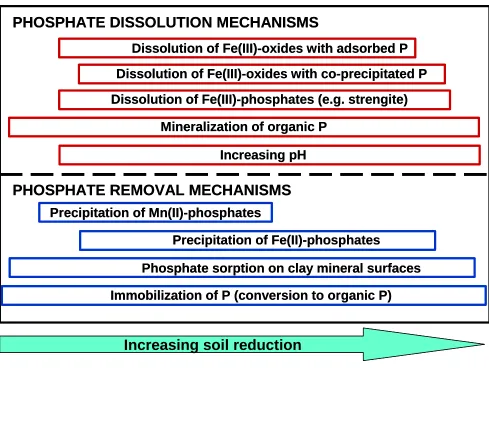
A typical x-ray absorption spectrum [consisting of XANES and extended x-ray absorption fine structure (EXAFS) regions] consists of a pre-edge region on the low-energy side of the absorption edge between -10 and -1 eV, an absorption edge at approximately 0 eV, a post-edge region between 2 and 30 eV, and an extended region at >30 eV (Figure 1.3). Analysis of phosphorus compounds often provide spectra that have unique features in these regions that can be used to discern information on the symmetry, electronic state and local chemical environment of P (Fendorf and Sparks, 1996). This information is obtained by comparing features of the energy positions of the white lines or absorption edges that occur as a core electron is ejected from the element of interest. For instance, Hesterberg et al. (1999) showed unique features among various crystallinities of strengite and adsorbed P on goethite (Figure 1.4a). Also, various calcium phosphate standards were compared to a soil sample, showing different spectral features in the post-edge
region (Figure 1.4b). These distinct features might be used to identify mineral or sorbed species in a soil sample by comparing the features of standards to those of P in the soil.
Also, Hesterberg et al. 1999 showed that phosphorus K-XANES spectra for strengite (FePO4 • 2H2O) and variscite (AlPO4 • 2H2O) or strengite and different
Al-hydroxides (Khare et al., 2004; (a) in review) contain unique features which enable one to differentiate PO4 associated with Fe(III) minerals from PO4 associated with
Al(III) minerals. A distinct pre-edge feature is present in the spectra of Fe(III)-associated phosphates due to electron orbital configurations and electronic
transitions near the x-ray absorption edge (Khare et al., (b) in review; Beauchemin et al., 2003); Hesterberg et al., 1999), and are absent in the spectra of Al-phosphates (Figure 2.5). As a result, XANES spectroscopy can differentiate between specific solid-phase chemical P species and their role in redox transformations and may be an important analytical method for redox studies.
Objectives
To quantitatively predict P dissolution and transport in reduced soils, a better understanding is needed of P release mechanisms during microbial reduction of soils. The objectives of this study were (i) to determine how the intensity of microbial reduction affects P dissolution from the surface horizon of an acidic, P-enriched Coastal Plain soil, and (ii) to determine the relative importance of various P dissolution mechanisms during the reduction of this soil.
REFERENCES
Arden, T.V. 1950. The solubility products of ferrous and ferric hydroxides. J. Chem. Soc. 1:882-885.
Beauchemin, S., D. Hesterberg, J. Chou, M. Beauchemin, R.R. Simard, and D.E. Sayers. 2003. Speciation of phosphorus in phosphorus-enriched agricultural soils using x-ray absorption near-edge structure spectroscopy and chemical fractionation. J. Environ. Qual. 32:1809-1819.
Beauchemin, S. and R.R. Simard. 1999. Soil phosphorus saturation degree: Review of some indices and their suitability for P management in Québe, Canada. Can. J. Soil Sci. 79:615-625.
Beauchemin S., R.R. Simard, and D. Cluis. 1996. Phosphorus sorption-desorption kinetics of soil under contrasting land uses. J. Environ. Qual. 25:1317-1325. Breeuwsma, A. and O.F. Schoumans. 1987. Forecasting phosphate leaching from soils on a regional scale. In: van Duijenbooden, W. and van Vaegeningh, H. G. (eds.) Proceedings of the International Conference on Vulnerability of Soil and Groundwater to Pollutants. National Institute of Public Health and
Environmental Hygiene. The Hague. pp. 973-981.
Brennan, E.W. and W.L. Lindsay. 1998. Reduction and oxidation effect on the solubility and transformation of iron oxides. Soil Sci. Soc. Am. J. 62:930-937. Calvert, D.V. 1975. Nitrate, phosphate and potassium movement into drainage lines
under three soil management systems. J. Environ. Qual. 4:183-186. Chang, S.C. and M.L. Jackson. 1957. Fractionation of soil phosphorus. Soil Sci.
84:133-144.
Daniel, T.C., A.N. Sharpley, and J.L. Lemunyon. 1998. Agricultural phosphorus and eutrophication: A symposium overview. J. Environ. Qual. 27:251-257.
Federico, A.C., D.G. Dickson, C.R. Kratzer, and F.E. Davis. 1981. Lake Okeechobee water quality studies and eutrophication assessment. Tech. Bull. 81-2. South Florida Water Management District. West Palm Beach, Florida. 270.
Fendorf, S.E., and D.L. Sparks. 1996. X-ray absorption Fine Structure Spectroscopy. pp. 337-416. In Methods of soil analysis. Part 3. Chemical methods. SSSA Book series:5. Madison, WI.
11
Gerke, J. 1992. Orthophosphate and organic phosphate in the soil solution of four sandy soils in relation to pH-evidence for humic-Fe (Al-) phosphate
complexes. 23:(5&6): 601-612.
Gerke, J. 1993. Solubilization of Fe(III) from humic-Fe complexes, humic/Fe-oxide mixtures and from poorly ordered Fe-oxide by organic acids-consequences for P adsorption. Z. Pflanzenernähr. Bodenk. 156: 253-257.
Gerke, J. 1997. Aluminum and iron(III) species in the soil solution including organic complexes with citrate and humic substances. Z. Pflanzenernähr. Bodenk. 160: 427-432.
Gerke J., and R. Hermann. 1992. Adsorption of orthophosphate to humic-Fe-complexes and to amorphous Fe-oxide. Z. Pflanzenernähr. Bodenk. 155: 233-236.
Gilliam, W.J., D.L. Osmond, and R.O. Evans. 1997. Selected agricultural best management practices to control nitrogen in the Neuse River Basin. North Carolina Agricultural Research Service Technical Bulletin 311, North Carolina State University, Raleigh, NC.
Giroux, M., D. Carrier, and P. Beaudet. 1996. Problématique et methode de gestion des charges de phosphore appliquées aux sols agricoles en provenance des engrais de ferme. Agrosol. 9(1):36-45.
Hamm, R.J. 1999. M.S.Thesis. Phosphorus movement in poultry, swine, and tobacco farm soils in the North Carolina Coastal Plain. North Carolina State University. 187 pp.
Hedley, M.J., J.W.B. Stewart, and B.S. Chauhan. 1982. Changes in inorganic soil phosphorus fractions induced by cultivation practices and by laboratory incubations. Soil Sci. Soc. Am. J. 46:970-976.
Hergert, G.W., D.R. Bouldin, S.D. Klausner, and P.J. Zwerman. 1981. Phosphorus concentration-water flow interactions in tile effluent from manured land. J. Environ. Qual. 10:338-344.
Hesterberg, D., W. Zhou, K.J. Hutchison, S. Beauchemin, and D.E. Sayers. 1999. XAFS Study of adsorbed and mineral forms of phosphate. J. Synchrotron Radiation. 6:636-638.
Holford, I.C.R., and W.H. Patrick, Jr. 1981. Effects of duration of anaerobiosis and reoxidation on phosphate sorption characteristics of an acid soil. Aust. J. Soil Res. 19:69-78.
Izuno, F.T., C.A. Sanchez, F.J. Coale, A.B. Bottcher, and D.B. Jones. 1991. Phosphorus concentrations in drainage water in the Everglades Agricultural Area. J. Environ. Qual. 20:608-619.
Jensen, M.B., H.C.B. Hansen, N.E. Nielsen, and J. Magid. 1998. Phosphate mobilization and immobilization in two soils incubated under simulated
reducing conditions. Acta Agriculturae Scandinavica Section B-Soil and Plant Science. 48(1):11-17.
Khalid, R.A., W.H. Patrick, Jr., and R.D. DeLaune. 1977. Phosphorus sorption characteristics of flooded soils. Soil Sci. Soc. Am. J. 41:305-310.
Khare, N., D. Hesterberg, S. Beauchemin, and S.L. Wang. 2004. XANES analysis of adsorbed phosphate distribution between ferrihydrite and boehmite in mixed-mineral systems. Soil Sci. Soc. Am. J. (in press).
Khare, N., D.L. Hesterberg, and J.D. Martin. (a). XANES investigation of metal phosphate precipitation in single and binary mixtures of Fe- and Al-oxide minerals. (in review).
Khare, N., J.D. Martin, and D.L. Hesterberg. (b). Assignment of phosphorus K-XANES spectral features to electronic transitions in Fe- or Al-phosphate systems. Geochimica et Cosmochimica Acta. (in review).
Kuo, S., J.E. Jellum, and W.L. Pan. 1988. Influence of phosphate sorption
parameters of soils on the desorption of phosphate by various extractants. Soil Sci. Soc. Am. J. 52:974-979.
Lindsay, W.L. 1979. Chemical equilibria in soils. John Wiley and Sons, New York. Lookman, R., K. Jansen, R. Merckx, and K. Vlassak. 1996. Relationship between
soil properties and phosphate saturation parameters. A transect study in northern Belgium. Geoderma. 69:265-274.
Maguire, R.O., J.T. Sims, and F.J. Coale. 2000. Phosphorus fractionation in bio-solids-amended soils: Relationship to soluble and desorbable phosphorus. Soil Sci. Soc. Am. J. 64:2018-2024.
Mahapatra, I.C. and W.H. Patrick. 1969. Inorganic phosphate transformation in waterlogged soils. Soil Sci. 107:281-288.
Mahapatra, I.C. and W.H. Patrick. 1971. Evaluation of the phosphate fertility of waterlogged soils. Proc. Int. Symp. on Soil Fertility Evaluation, New Delhi. Vol. 1, 53-61.
Mikkelsen, R.L. 1997. Agricultural and environmental issues in the management of swine waste. pp. 110-119. In J.E. Rechcigl and H.C. MacKinnon (eds.) Agricultural uses of by-products and wastes. American Chemical Society. Washington, D.C.
Miller, D.M., T.Tang, and D.W. Paul. 1993. Electrolytic reduction of soil suspensions. Soil Sci. Soc. Am. J. 57:356-360.
Patrick, W.H. Jr., and R.A. Khalid. 1974. Phosphate release and sorption by soils and sediments: Effect of aerobic and anaerobic conditions. Science. 186:53-55.
Patrick, W.H., R.P. Gambrell and S.P. Faulkner. 1996. Redox measurements of Soils: pp. 1255-1273. In, Methods of soil analysis. Part 3. Chemical methods. SSSA Book series: 5. Madison, WI.
Phillips, I.R. 1998. Phosphorus availability and sorption under alternating waterlogged and drying conditions. Commun. Soil Sci. Plant Anal. 29(19&20):3045-3059.
Pierzynski, G.M., J.T. Sims, and G.F. Vance. 1994. Soils and environmental quality. CRC Press, Inc., Boca Raton, FL.
Ponnamperuma, F.N. 1972. The chemistry of submerged soils. Adv. Agron. 24:29-96.
Pote, D.H., T.C. Daniel, A.N. Sharpley, P.A. Moore, Jr., D.R. Edwards, and D.J. Nichols. 1996. Relating extractable soil phosphorus to phosphorus losses in runoff. Soil Sci. Soc. Am. J. 60:855-859.
Roden, E.E. and J.W. Edmonds. 1997. Phosphate mobilization in iron-rich anaerobic sediments: Microbial Fe(III) oxide reduction versus iron-sulfide formation. Archiv Fur Hydrobiologie. 139:(3) 347-378.
Sallade, Y.E. and J.T. Sims. 1997a. Phosphorus transformations in the sediments of Delaware's Agricultural Drainageways: I. Phosphorus Forms and Sorption. J. Environ. Qual. 26: 1571-1579.
Sallade, Y.E. and J.T. Sims. 1997b. Phosphorus transformations in the sediments of Delaware's agricultural drainageways: II. Effect of reducing conditions on phosphorus release. J. Environ. Qual. 26:1579-1588.
Sharpley, A.N. 1995. Dependence of runoff phosphorus on extractable soil phosphorus. J. Environ. Qual. 24:920-926.
Sharpley, A.N. 1996. Availability of residual phosphorus in manured soils. Soil Sci. Soc. Am. J. 60:1459-1466.
Sims, J.T., R.R. Simard, B.C. Joern. 1998. Phosphorus losses in agricultural drainage: historical perspective and current research. J. Environ. Qual. 27:277-293.
Stevenson, F.J. 1994. Humus chemistry: genesis, composition, reactions. 2nd ed., John Wiley and Sons, New York. 496 pp.
Tiessen, Holm. (ed.) 1995. Phosphorus in the global environment. Wiley and Sons, New York.
Vepraskas, M.J., J.L. Richardson, J.P. Tandarich, and S.J. Teets. 1999. Dynamics of hydric soil formation across the edge of a created deep marsh. Wetlands. 19:78-89.
Violante A., C. Colombo, and A. Buondonno. 1991. Competitive adsorption of phosphate and oxalate by aluminum oxides. Soil Sci. Soc. Am. J. 55:65-70. Willet, I.R. 1985. The reductive dissolution of phosphated ferrihydrite and strengite.
Aust. J. Soil Res. 23:237-244.
Willet, I.R. 1989. Causes and prediction of changes in extractable phosphorus during flooding. Aust. J. Soil Res. 27:45-54.
Table 1.1: Partial review of some P saturation indices used in different studies for acidic soils (table extracted from Beauchemin and Simard, 1999.)
References pH, texture, and location Indices‡
Beauchemin et al. (1996) Acidic, loam Québec, Canada
Piox/(Alox + Feox)
De Smet et al. (1996a,b) Acidic to slightly alkaline, sandy loam Belgium
Pox/0.5(Alox + Feox)
Pote et al. (1996) Acidic, silt loam Arkansas
Pox/(Alox + Feox)
Sharpley (1996) Acidic to neutral, sandy to clay loams Texas and Oklahoma, USA
Strip-P/Xm
Sharpley (1995) Mainly acidic, sandy loam to loam Oklahoma, USA
M3P/Xm
Sims et al. (1998) Acidic, loamy sand to sandy loam Delaware, USA
Pox/(Alox + Feox)
Van der Zee et al. (1988) Acidic, sandy soils Netherlands
Pox/(Alox + Feox) ‡
Pox, Alox, and Feox: total P, Al or Fe extractable with ammonium-oxalate solution (mmol kg -1
); Piox: molybdate reactive P
in the non-digested extracts of ammonium oxalate (mmol kg-1); Xm: P sorption maximum derived from a Langmuir
isotherm (mg kg-1); M3P: Mehlich-III extractable P (mg kg-1); Strip-P: P extractable with Fe-oxide strips (mg kg-1).
Figure 1.1: Pathways for the transfer of P from terrestrial to aquatic ecosystems (Tiessen,1995).
Phosphate sorption on clay mineral surfaces
Increasing soil reduction
PHOSPHATE DISSOLUTION MECHANISMS
Dissolution of Fe(III)-oxides with adsorbed P
Dissolution of Fe(III)-oxides with co-precipitated P
Dissolution of Fe(III)-phosphates (e.g. strengite)
Mineralization of organic P
Increasing pH
PHOSPHATE REMOVAL MECHANISMS
Precipitation of Mn(II)-phosphates
Precipitation of Fe(II)-phosphates
Immobilization of P (conversion to organic P) Phosphate sorption on clay mineral surfaces
Increasing soil reduction
PHOSPHATE DISSOLUTION MECHANISMS
Dissolution of Fe(III)-oxides with adsorbed P
Dissolution of Fe(III)-oxides with co-precipitated P
Dissolution of Fe(III)-phosphates (e.g. strengite)
Mineralization of organic P
Increasing pH
PHOSPHATE REMOVAL MECHANISMS
Precipitation of Mn(II)-phosphates
Precipitation of Fe(II)-phosphates
Immobilization of P (conversion to organic P)
Figure 1.2: Some mechanisms of phosphate dissolution and mechanisms of
removal from soil solution that may occur during the reduction of an acid soil (based on Lindsay, 1979; Friedl et al., 1997; Stevenson, 1994; and Willet, 1985).
-10 0 10 20 30 40 50 0
1
Normalized Fluorescence Yield
Relative Energy (eV)
E
0 = 2149 eV
pre-edge absorption edge
post-edge extended region
XANES
EXAFS
-10 0 10 20 30 40 50
0 1
Normalized Fluorescence Yield
Relative Energy (eV)
E
0 = 2149 eV
pre-edge absorption edge
post-edge extended region
XANES
EXAFS
Figure 1.3: Background and baseline corrected x-ray absorption spectrum of
phosphorus in crystalline FePO4• 2H2O (strengite) showing the pre-edge, absorption
edge, and extended regions of the spectra (Hesterberg et al., 1999).
Figure 1.4: Stacked phosphorus K-XANES spectra for (a) non-crystalline iron phosphate, adsorbed phosphate, and strengite of varying crystallinity as induced by hydrothermal treatment time, and (b) for selected Ca-phosphate minerals and a soil sample (Hesterberg et al., 1999). The black-dotted line shows the pre-edge feature associated with Fe(III)-phosphate minerals (a), and the red-dotted line shows a post-edge feature associated with Ca-phosphate minerals (b).
CHAPTER 2
DISSOLUTION OF PHOSPHATE IN A PHOSPHORUS-ENRICHED
ULTISOL AS AFFECTED BY MICROBIAL REDUCTION
11
Hutchison, K.J. and D. Hesterberg. Submitted to the J. Environ. Qual., July 20, 2003.
ABSTRACT
Knowledge of the effect of reduced soil redox conditions on P dissolution is needed to better assess P mobility to surface or ground water. The objectives of our study were to determine the effect of microbial reduction on P dissolution and
determine mechanisms of P release in a reduced soil. Duplicate suspensions of silt+clay from a Cape Fear sandy clay loam were reduced in a continuously-stirred redox reactor for 40 d. We studied the effects of three treatments on P dissolution: (i) 2 g dextrose kg-1 solids added as a microbial carbon source at time 0 d; (ii) 2 g dextrose kg-1 solids split into three additions at 0, 12, and 26 d; and (iii) no added dextrose. Regardless of treatment or variation in the intensity of reduction rates, dissolved reactive P (DRP) increased up to 7-fold from 1.5 to 10 mg L-1 and was linearly related (R2 = 0.79) with dissolved organic C. Dissolved Fe and Al and pH also increased, suggesting the formation of aqueous Fe- and Al-dissolved organic matter (DOM) complexes. Separate batch experiments were performed to study the effects of increasing pH and citrate additions on PO4 dissolution under aerobic
conditions. Increasing additions of citrate increased concentrations of DRP, Fe, and Al, while increasing pH had no effect. Results indicated that increased DOM during soil reduction contributed to the increase in DRP, perhaps by competitive adsorption or by formation of aqueous ternary PO4-Fe-DOM or PO4-Al-DOM complexes.
Generation of DOM during microbial reduction may be an important model parameter for more quantitatively predicting the dissolution of PO4.
INTRODUCTION
Long-term land application of animal waste and fertilizers to agricultural land has resulted in a 3- to 5-fold over-application of P (Mikkelsen, 1997), and thus, elevated soil P concentrations. Accumulation of P in surface soils has increased to the extent that the loss of P in drainage waters and in runoff discharged to surface waters has become a management concern (Beauchemin et al., 1998; Breeuwsma and Schoumans, 1987; Federico et al., 1981; Sallade and Sims, 1997a) due to P contributing to the eutrophication of surface waters (Pierzynski et al., 1994).
Many of the dissolution and transport processes in soils enriched with P are not understood well enough to predict P loss quantitatively. Soil oxidation-reduction (redox) potential has been correlated with P dissolution (Patrick and Khalid, 1974; Holford and Patrick, 1981; Willet, 1989; Vadas and Sims, 1998; Phillips, 1998), where soils with lower redox potentials (more reduced conditions) generally show enhanced P mobility. Therefore, there is a concern for increased risk of P loss from poorly-drained (more reduced) soils with elevated P concentrations.
The reductive dissolution of Fe(III)-oxides has been related to the dissolution of P under reducing conditions in flooded soils and sediments (Holford and Patrick, 1981; Jensen et al., 1998; Maguire et al., 2000; Phillips, 1998; Sallade and Sims, 1997b; Willett, 1989). Sallade and Sims (1997b) correlated total Fe-oxide content with dissolved P after sediments were flooded under anoxic conditions for 21 days. Operationally-defined chemical fractionations of solid-phase inorganic P in
sediments (Sallade and Sims, 1997b) and in soil (Maguire et al., 2000) suggested
that P associated with Fe and Al were the predominant forms of P. Therefore, changes in Fe mineral equilibrium or the relative distribution of PO4 between Fe
(redox active) and Al (non-redox active) minerals could influence PO4 dissolution
during reduction.
Phosphate associated with Fe(III) minerals can be differentiated from PO4
associated with Al(III) minerals using x-ray absorption near-edge structure (XANES) spectroscopy, as phosphorus K-XANES spectra for strengite (FePO4 • 2H2O) and
variscite (AlPO4 • 2H2O) contain unique features (Hesterberg et al., 1999). A distinct
pre-edge feature is present in the spectra of Fe(III)-associated phosphates due to electron orbital configurations and electronic transitions near the x-ray absorption edge (Khare et al., (b) in review); Beauchemin et al., 2003; Hesterberg et al., 1999), and these features are absent in the spectra of Al-phosphates. Determination of the solid-phase speciation of P using XANES spectroscopy could indicate if phosphate is associated with redox or non-redox active minerals.
While there seems to be agreement on the importance of iron oxides on P sorption capacity of soils, it seems to be at variance with increased P dissolution during soil reduction. In laboratory studies, Holford and Patrick (1981) and Young and Ross (2001) observed fluctuations in the dissolution of PO4 and Fe over a 45 d,
or 60 to 90 d reduction period, respectively. These studies showed that the net dissolution of Fe and PO4 can vary over time when soils are anoxically incubated.
The rate of microbial reduction of a soil is a function of the rate of oxidation of organic carbon by soil microbes and is influenced by factors such as temperature, carbon source, presence and type of electron acceptors and the microbial population
present in the soil (Coyne, 1999). These factors would be different for aerobic soils, poorly-drained soils (under long-term anoxic conditions), and soils that are rapidly flooded by irrigation water, receive animal waste effluent, or are subjected to
controlled drainage practices (Gilliam et al., 1997), and could result in changes in the intensity of soil reduction (Eh), soil pH, generation of DOM, and availability of P sorption sites on mineral surfaces. As a result, changes in the solid-phase speciation of phosphorus may occur during reduction, resulting in different PO4
dissolution mechanisms (Roden and Edmonds, 1997; Willet, 1985) (Figure 1.2) and perhaps a variation in the intensity and rate of PO4 dissolution among different soils.
Given that pH and DOM may increase during microbial reduction of soils, proposed P dissolution mechanisms include (i) reductive dissolution of Fe(III) minerals with associated PO4, (ii) competitive adsorption for mineral surfaces
between DOM and PO4 by a ligand exchange mechanism, (iii) DOM-enhanced
dissolution of surface Fe or Al with concomitant release of PO4, (iv) the formation of
aqueous ternary PO4-Fe-DOM or PO4-Al-DOM complexes, and (v) decreased PO4
sorption with increasing pH.
The reductive dissolution of Fe(III)-associated PO4 has been postulated, and
includes the reductive dissolution of Fe(III) oxides (Roden and Edmonds, 1997), with adsorbed, occluded or co-precipitated P, and dissolution of Fe(III) phosphates such as strengite (FePO4 • 2H2O) (Lindsay, 1979; Willet, 1985; Miller et al., 1993).
It is documented that carboxylate anions (a common functional group of many plant root exudates and soil organic matter), compete with P for sorption sites on soil minerals (Earl et al., 1979; Lopez-Hernandez et al., 1986; Violante et al., 1991).
Carboxylate anions can also solubilize Fe and Al from mineral surfaces (Gerke, 1993). As Fe or Al is released from mineral surfaces through reductive dissolution or complexation with organic acids, aqueous DOM-Fe and DOM-Al complexes can form (Gerke, 1992, 1997). These complexes may enhance the dissolution of phosphate by forming ternary, aqueous complexes of phosphate bound to DOM through Fe and Al bridges (Gerke and Hermann, 1992). For soils receiving inputs of metabolizable carbon, e.g., from animal waste amendments, mechanisms (iii) and (iv) may be important for the dissolution of PO4 as these soils are reduced.
Soil pH typically rises during reduction and may increase after amendments with alkaline wastes, such as poultry litter (Vadas and Sims, 1998). Phosphate sorption on oxide minerals decreases with increasing pH due to increasing negative charge on the mineral surfaces (Oh et al., 1999). Also, DOM typically increases with increasing pH due to deprotonation of acidic functional groups (Swift, 1996), which may increase the dissolution of phosphate as described above.
To quantitatively predict P dissolution and transport in reduced soils such as those amended with high organic carbon inputs (e.g., from livestock waste), a better understanding is needed of P release mechanisms during microbial reduction of soils. The objectives of this study were (i) to determine how the intensity of microbial reduction affects P dissolution from the surface horizon of an acidic, P-enriched Coastal Plain soil, and (ii) to determine the relative importance of various P dissolution mechanisms during the reduction of this soil.
MATERIALS AND METHODS
Soil collection and handling
Samples were collected from the Ap horizon (0-7 cm) of a Cape Fear sandy clay loam (fine, mixed, semi-active, thermic Typic Umbraquult) in a cattle-grazed pasture on the NCDA Tidewater Research Station near Plymouth, North Carolina. The pasture had received past applications of swine lagoon effluent (exact history unknown). The soil samples were double-bagged in low-density polyethylene bags (LDPE), placed in 4-L pyrex glass jars, and transported to the lab on ice. To reduce the possibility of photochemical redox reactions, all sample handling in the
laboratory was done in a glove box under a N2(g) atmosphere and in the absence of
ultraviolet radiation (using a red-filtered safe light with an emission spectrum of 760 to 630 nm wavelength). The moist soil samples were sieved to <2 mm through a stainless steel sieve, combined, and thoroughly mixed in an LDPE bucket. The homogenized soil sample was stored in the dark at 4 °C in 4-L pyrex glass jars.
Soil Characterization
Total P was determined on samples of the whole soil, silt+clay fraction (each 0.25 g dry weight), and sand fraction (1.5 g dry weight) using the acid digestion method of Kuo (1996) with the following exceptions. A total of 3 mL of HF was added and unreacted F- was complexed with saturated boric acid. Mehlich 3-P and inorganic forms of P such as, NH4Cl-P, NH4F-P, and NaOH-P were determined on
the whole soil and silt+clay fractions by the procedures of Pierzynski (2000).
Dissolved reactive P was determined in filtrates by the molybdenum blue method (Olsen and Sommers, 1982).
Acid ammonium-oxalate (dark) extractable Fe and Al (Feox, Alox) and
citrate-bicarbonate dithionite (CBD) extractable Fe and Al (FeCBD, AlCBD) were determined
on the whole soil (0.25 and 0.5 g dry weight, respectively) and silt+clay fraction (0.25 g dry weight) according to Jackson et al. (1986). All digests and extracts were filtered through 0.2 µm Isopore polycarbonate membranes (Millipore Corp., Bedford, MA). Iron and Al were measured in the filtrates using flame atomic absorption spectrometry (FAAS).
Soil pH was measured using a 1:5 soil to water ratio (Thomas, 1996). To separate the silt+clay fraction and determine particle size distribution, the sand was wet-sieved through a 53 µm sieve. A subsample of the silt+clay fraction was further
separated by centrifugation and oven-dried at 110 °C before weighing (Dixon and White, 1999). Moisture contents of the whole soil and silt+clay fractions were determined by drying triplicate samples for 24 h at 110 °C and then weighing. Results of chemical analyses were calculated on a dry mass basis.
Reduction experiment
Suspension preparation
A preliminary experiment showed that continuously stirring a suspension of whole soil led to abrasion of the magnet and glass vessel by sand particles.
Therefore, we used only the silt+clay fraction of the soil in the reduction experiments. The silt+clay fraction was separated by sonicating soil in degassed, deionized water
for 10 min intervals in an LDPE bucket, while purging the headspace with N2(g). Two
sequential sonications were done with a 4:1 and 2:1 water:soil ratio, respectively. The sand and silt+clay fractions were separated as described above, and brought into a stock suspension with a solids concentration of 65 g silt+clay kg-1 using
degassed, deionized water. Stock suspensions were stored for up to 5 days at 4 °C prior to the start of each reduction experiment.
Reactor design
Reduction experiments were conducted in a 1.5 L Cytostir® glass bioreactor equipped with a suspended magnetic stirring device. The overall reactor system was designed, in part, based on the batch reactor system of Patrick et al. (1973) (Figure A1). Upstream from the reactor, flowing N2(g) (0.2 or 0.5 L min-1) was split, and half
was flowed through 200 mL of a standardized 0.005 mol L-1 NaOH solution acting as a CO2(g) trap. The other half flowed through deionized water, to water saturate, then
into the reactor through a gas-dispersion tube. Effluent gas from the reactor was also flowed through a CO2(g) trap (0.005 mol L-1 NaOH).
The reactor vessel cap was modified to accommodate a gas dispersion tube as an inlet for N2(g), a sampling tube, and a port for a pH or Eh electrode. Periodic
measurements of pH and Eh were taken directly in the silt+clay suspensions using calibrated combination pH and redox electrodes. Proper working condition of the redox electrode was ensured by measuring the potentials of pH 4.0 and 7.0 buffer solutions containing 30 mg of quinhydrone (Microelectrodes, Inc., Bedford, NH).
Measurements of Eh for the Ag/AgCl reference electrode were corrected to the standard hydrogen electrode (+199 mV) (Patrick et al., 1996).
Suspension treatments and sampling method
For a typical experiment, duplicate reactors containing 600 mL (control treatment) or 1200 mL of soil silt+clay suspensions (65 g kg-1 solids) were
simultaneously reacted for 40 d while purging with N2(g). We studied the effects of
three treatments: (1) no added dextrose (control treatment), (2) addition of 2 g
dextrose kg-1 solids (D-glucose, anhydrous; ACS grade, Fisher Scientific, Pittsburgh, PA) at time 0 d (0-d treatment), and (3) three additions of 0.67 g dextrose kg-1 solids (at 0, 12, and 26 d) to yield a total addition of 2 g dextrose kg-1 solids
(spiked-addition treatment). Suspensions were sampled periodically (over 40 d) and the total volume of suspension did not decrease by more than 20% before the final sample was removed at the termination of the experiment. The following sampling method was used to prevent oxidation of Fe(II) (Figure A2). Approximately 40 mL of suspension were removed from the reactor as four 10-mL subsamples using a glass syringe. Each of the four subsamples of suspension was transferred anoxically into four 15 mL, evacuated pyrex test tubes fitted with rubber stoppers and then
centrifuged at 27,000 x g for 10 min.
To prevent exposure to oxygen, supernatant solutions from all four
centrifuged test tubes were filtered through 0.2 µm polycarbonate membranes under a N2(g) atmosphere, by drawing a vacuum at the receiver flask (beneath the filter) of
a Millipore polycarbonate, 47 mm filter holder while flowing N2(g) through the cover
All filtering was done in a N2(g)-purged glovebox. A 2.5 mL subsample of filtrate was
removed with a macropipetter and the Fe(II) in the sample was immediately complexed by adding the reagents for colorimetric analysis of Fe(II): 0.1 mL of concentrated HCl, 1 mL of 0.1% 1,10-phenanthroline, 0.5 mL of ammonium acetate buffer solution, and 1 mL of degassed, deionized water (Clesceri et al., 1989; Olson and Ellis, 1982). The remaining filtrate was acidified with HCl, and stored at 4 °C for analysis.
Chemical analysis of aqueous reactor samples
Within 24 h of complexing, Fe(II) was measured colorimetrically (λ=510 nm) in duplicate subsamples using a UV-visible spectrophotometer. Duplicate or triplicate filtrate samples were also analyzed colorimetrically (λ=840 nm) for DRP using the molybdenum blue method (Olsen and Sommers, 1982). Measurements for DRP are assumed to include PO4 bound to Fe- or Al-DOM complexes as
indicated by Gerke (1992) as a result of acid hydrolysis of Fe and Al associated with DOM and phosphate during the colorimetric process. To avoid interference of absorbance readings due to varying concentrations of DOC, blanks of each filtrate sample were prepared by replacing the coloring reagents (i.e., 1,10-phenanthroline for Fe(II) analysis and molybdate “reagent B” for PO4 analysis) with an equal amount
of deionized water and subtracting absorbance readings for the blanks from sample absorbance readings.
Sample filtrates were analyzed for DOC using a TOC analyzer. Total dissolved Fe and Al were measured on acidified samples using FAAS. The
concentration of CO2(g) trapped in NaOH solutions was determined by titrating the
NaOH solution for unreacted alkali with standardized HCl solution after the addition of 1 mL of 1.5 mol L-1 BaCl2 to precipitate CO3-2 as BaCO3(Anderson,1982).
Reactor CO2(g) (mmol) titrated downstream from the reactor was corrected by
subtracting the concentration of CO2(g) in the blank upstream of the reactor. Results
of titrated CO2(g) (mmol) should be considered relative as the CO2(g) traps may not
have been 100% efficient.
X-ray absorption near-edge structure (XANES) spectroscopy
XANES analysis was used to qualitatively determine whether
Fe(III)-associated P was present in the silt+clay sample used in the reduction experiments. A moist sample taken at time 0 d was analyzed at Beamline X19A (National
Synchrotron Light Source, Upton, NY) following methods described by Khare et al. (a) (in review). XANES data were normalized according to Khare et al. (a) (in review) and compared with data for standards of PO4 sorbed to ferrihydrite or
non-crystalline Al-hydroxide collected in that study.
pH experiment
A separate 48 h batch experiment was conducted to determine the effect of pH on DOC, and dissolved PO4, Fe, and Al in silt+clay suspensions. Aliquots of a
stirred, aqueous stock suspension of silt+clay were weighed into tared, 250 mL polycarbonate centrifuge bottles to yield 65 g kg-1 solids in the final 60 g sample. While stirring, duplicate samples were adjusted in random chronological order to pH 5.0, 5.5, 6.0, 6.5, 7.0, or 7.5 using standardized 0.5 mol L-1 KOH or HCl. The
samples were brought to the final mass with deionized water and 0.5 mol L-1 KCl (to
yield a 5 mmol L-1 K+ background), and equilibrated for 48 h by shaking at 25 °C in a temperature-controlled water bath. Periodically, throughout the equilibration period, sample pH was adjusted and K+ concentration corrected. Redox potential was measured on each sample at time 0 and 48 h. After 48 h, suspension pH was measured and samples were centrifuged at 16,000 x g for 20 min. Filtered (0.2 µm) supernatant solutions were analyzed as described above for reactors.
Citric acid experiment
A separate 19 h batch experiment was conducted to determine the effect of a complexing organic acid (citrate) on dissolved PO4, Fe, and Al in the silt+clay
suspension. Aliquots of a stirred, aqueous stock suspension of silt+clay were
weighed into tared, 30 mL polycarbonate centrifuge tubes to yield 10 g kg-1 solids in the final 30 g sample. While stirring, a 0.25 mol L-1 citric acid monohydrate
(H3C6H5O7 • H2O) solution neutralized with 0.75 mol L-1 KOH was added to each
duplicate sample in random chronological order, yielding final input citrate
concentrations of 0, 25, 50, 75, 100, 150, 200, 250, 300, 350, 400, and 500 mmol citrate kg-1 solids. Samples were adjusted to pH 7.0 with 0.25 mol L-1 KOH or HCl (after the addition of deionized water, two times the volume of input citrate solution), brought to final mass by the addition of 0.25 mol L-1 KCl, and equilibrated for 19 h by shaking at 25 °C in a temperature-controlled waterbath. Periodically, suspension pH was adjusted. After the 19 h equilibration period, suspension pH was measured and samples were centrifuged at 22,000 x g for 20 min. Redox potential was measured
on each sample at 0 and 19 h. Filtered (0.2 µm) supernatant solutions were analyzed as described above for reactors.
RESULTS
Soil characteristics
Selected properties for the whole soil and silt+clay fraction used in the reduction experiments are shown in Table 1. Both samples were slightly to
moderately acidic (pH 5.9 and 6.4). While the silt+clay fraction constituted 51% of the soil mass, chemical extraction results (Table 1) indicate that the silt+clay fraction accounted for about 86%, 71%, 100%, 85%, and 83% of the total P, Feox, FeCBD, Alox
and AlCBD, respectively. The Feox to FeCBD ratio for the silt+clay was 0.6, consistent
with soils containing elevated amounts of poorly crystalline Fe-oxides due to active redox processes (Schwertmann, 1985).
Plant available P and selected inorganic P parameters are shown in Table 2.2 for the whole soil and silt+clay fraction. Mehlich 3-P (related to plant available P) is 7-fold greater than what is considered to be optimum for plant growth and crop yields (Pierzynski, 2000) indicating that the soil has excess P loading perhaps due to past applications of swine lagoon effluent. Chemical extraction results (Table 2.2) targeting “labile P” (NH4Cl-P), “Al-associated P” (NH4F-P), and “Fe-associated P”
(NaOH-P) for the whole soil and silt+clay fraction show extractable Al-associated P to be 1.8 and 1.9 times greater, respectively, than extractable Fe-associated P which is consistent with North Carolina Coastal Plain soils that typically have greater
extractable Al-associated P than Fe-associated P (Novais and Kamprath, 1978). Extractions typically dissolved only part of the total P. For example, the sum of extractable fractions from the total soil were only 56% of the total P measured on the whole soil. Total P for the silt+clay fraction accounted for 86% of the total P in the whole soil (Table 2.1), indicating that these phosphorus extractions were less effective for the whole soil than for the silt+clay fraction.
Reduction experiments
Figure 2.1 shows changes in Eh, CO2(g) trapped in 0.005 mol L-1 NaOH , and
pH for duplicate redox reactor solutions subjected to the three dextrose treatments. The redox potential (Eh) decreased over time for all treatments, however, the rate of reduction for the 0-d treatment was much faster than for the control and spiked-addition treatment. Evolution of CO2(g) occurred during all treatments and indicated
that the Eh declined as a result of microbial oxidation of organic carbon (Coyne, 1999). This is particularly evident in the 0-d dextrose treatment (Figure 2.1B) where a rapid decline in Eh from 340 mV at 0d to 99 mV at 7d corresponded with the greatest incremental trapping of CO2(g). The Eh then stabilized at ~70 mV for the
remainder of the 40-d reduction period. The Eh of the spiked-addition and control treatment decreased at about the same overall rate, between 0 and 40 d. The Eh appeared to drop more rapidly after the dextrose additions in the spiked-addition treatment, particularly after 26 d. For the control and spiked-addition treatments, the Eh exhibited a downward trend at the end of the 40-d incubation period. Overall, the average Eh for all treatments decreased significantly (p<0.01) from 410 ± 30 (initial)
to 100 ± 30 mV (40 d), while the cumulative, trapped CO2(g) was 2.0 ± 0.3 mmol.
With declining Eh over time, the pH increased significantly (p<0.05) towards neutrality (from 5.9 ± 0.2 to 6.7 ± 0.4), as has been observed when acidic soils are reduced (Patrick et al., 1996).
Figures 2.2 and 2.3 show changes in the concentrations of DRP, DOC, Fe(II), total Fe (FeT), and Al in duplicate redox reactor suspensions subjected to the three
dextrose treatments. Regardless of the rate of microbial reduction (Figure 2.1), DRP increased significantly (p<0.01) by up to 7-fold, with a grand mean ranging from 1.5
± 0.2 mg L-1 at 0 d to 10 ± 2 mg L-1 at 40 d for all three treatments. Similarly, DOC
increased significantly (p<0.01) up to 5-fold ranging from 34 ± 9 mg L-1 at 0 d to 155
± 45 mg L-1 at 40 d. When data for all three treatments were combined, a significant
(p<0.01) linear relationship was found between DRP and DOC (R2 = 0.79, n = 34) (Figure 2.4). For all three treatments, DRPand DOC increased at a rate consistent with the rate of decreasing Eh and increasing trapped CO2(g) (Figure 2.1), implying
that microbial respiration led to the increases in these constituents. These trends are particularly evident for the 0-d dextrose treatment between 0 and 15 d, where a sharp increase in DRP and DOC (Figure 2.2B) corresponded with a sharp decrease in Eh (Figure 2.1). Dissolved reactive P and DOC then stabilized for the remainder of the 40-d reduction period for this treatment.
For all three treatments, the concentration of dissolved Fe(II) increased with decreasing Eh and increasing amount of trapped CO2(g) (Figure 2.3). When data
(mmol) for all three treatments were taken together, significant (p<0.01) linear
relationships were found between DOC and dissolved Fe(II), AlT, or FeT with R2
values of 0.60, 0.30, and 0.23, respectively (correlation plots not shown). Also, significant linear relationships (p<0.01) were found between DRP and Fe(II), and AlT,
and FeT, having R2 values of 0.51, 0.41, and 0.36, respectively (correlation plots not
shown).
XANES spectroscopy
Figure 1.3 shows the overall features of a typical normalized and background corrected x-ray absorption spectrum. Figure 2.5 is a plot of the pre-edge region only (-6 to -1 eV) of P K-XANES spectra for PO4 sorbed on ferrihydrite, non-crystalline
Al-hydroxide, and the initial silt+clay sample. The distinct pre-edge feature can be seen for the PO4 sorbed on ferrihydrite, whereas, no pre-edge feature is evident for the
non-crystalline Al-hydroxide. The spectrum for a silt+clay sample shows a pre-edge feature intermediate between those of the standards, indicating that PO4 was
associated in part with Fe(III) and possibly with Al(III), as was also suggested by the chemical fractionation data in Table 2. The fact that the pre-edge feature in the soil XANES spectrum was weak, implies that PO4 was more likely adsorbed on Fe-oxide
minerals, rather than occurring as an Fe(III)-phosphate mineral (Hesterberg et al., 1999).
pH Experiment
Results of the experiment on chemical changes in aqueous silt+clay suspensions as a function of pH (with minimal microbial respiration) is shown in Figure 2.6. Dissolved FeT and AlT increased slightly as pH increased, while DOC
and DRP exhibited a minimum at pH 6.5. Dissolved organic carbon increased
significantly (p<0.05) from 35.8 ± 0.4 mg L-1 to 50 ± 2 mg L-1. Redox potential (Eh) indicated oxidizing conditions (Fe(II) not measured), with minimal change, over the 48 h equilibration period (grand mean = 535 ± 10 mV).
Citrate Experiment
Figure 2.7 shows results of a batch experiment on citrate effects on aqueous solution chemistry for silt+clay suspensions. Dissolved reactive P, FeT, and AlT all
increased significantly (p<0.01) with increasing additions of citrate, with DRP, FeT,
and AlT increasing from 0.41 ± 0.01 to 3.70 ± 0.03 mg DRP L-1, 0.07 ± 0.01 to 7.9 ±
0.1 mg Fe L-1, and 0.7 ± 0.3 to 11.1 ± 0.3 mg Al L-1, respectively. Again, Eh
remained stable (434 ± 15 mV) and conditions were oxidizing (Fe(II) not measured) during the 19 h equilibration period.
DISCUSSION
Results from redox reactor studies indicated that the intensity of microbial reduction of the silt+clay suspensions was similar for the control and spiked addition treatment but different for the 0d treatment. Regardless of the differences of the intensity of microbial reduction, concentrations of DRP after 40 d of reduction were similar for all treatments (grand mean = 10 ± 2 mg PO4 L-1). However, the maximum
dissolution of PO4 occurred most rapidly (by 15d) for the 0-d treatment, while
dissolved PO4 did not reach a maximum until after 30d for the control and
spiked-addition treatment indicating that the spiked-addition of an easily metabolizable carbon source increased the rate of the net dissolution of PO4. Increased dissolution of