FEASIBILITY STUDY OF FUZZY CLUSTERING TECHNIQUES IN CHEMICAL DATABASE FOR COMPOUND CLASSIFICATION
VOT 75107
JABATAN SISTEM MAKLUMAT
FAKULTI SAINS KOMPUTER DAN SISTEM MAKLUMAT PENYELIDIK:
ROZILAWATI BT DOLLAH @ MD. ZAIN (Ketua) ARYATI BT BAKRI
FEASIBILITY STUDY OF FUZZY CLUSTERING TECHNIQUES
IN CHEMICAL DATABASE FOR COMPOUND
CLASSIFICATION
RESEARCHER :
ROZILAWATI BINTI DOLLAH @ MD. ZAIN (HEAD)
ARYATI BINTI BAKRI
MAHADI BIN BAHARI
PM DR. NAOMIE BINTI SALIM
UNIVERSITI TEKNOLOGI MALAYSIA
ACKNOWLEDGEMENT
Alhamdullillah…
ABSTRACT
Compound selection methods are important in drug discovery especially in lead identification process. Finding the best method in compound selection has become a need to the pharmaceutical industry because of the increasing number of chemical compound to be screened. One of the best and widely used methods in compound selection is cluster-based selection where the compound datasets are grouped into clusters and representative compounds are selected from each cluster. Non-overlapping methods, such as Ward’s clustering method, have been widely used and it was agreed as the most efficient clustering method in compound selection. However, little focus has been given to overlapping method in compound selection or even in lead identification process. The research focused on the fuzzy c-means
clustering where the effectiveness of the clusters produced with regard to compound selection is analyzed and compared with other conventional cluster-based compound selection method. Fuzzy c-means have been chosen because it produces clusters by identifying the cluster centroid and their corresponding degree of membership,
therefore the compounds may belong to more than one cluster. The results from fuzzy c-means method are compared to Ward’s clustering method and also to the results from the fuzzification of Ward’s cluster. The analysis shows that fuzzy c-means clustering gives the best result in intermolecular dissimilarity; however it shows poor results of separation of active/inactive structure.
Key Researchers :
Rozilawati bt Dollah @ Md. Zain (Head) Aryati bt Bakri
Mahadi b Bahari PM Dr Naomie bt Salim
Email : [email protected]
Tel : 07-5532425
ABSTRAK
Kaedah pemilihan sebatian merupakan kaedah yang penting di dalam penemuan ubat, terutamanya bagi proses pengenalpastian molekul yang berpotensi menjadi ubat. Penyelidikan untuk mencari kaedah yang terbaik bagi pemilihan sebatian telah menjadi satu kepentingan kepada industri farmasi kerana peningkatan pada jumlah sebatian yang perlu ditapis. Kaedah yang terbaik dan sering digunakan di dalam pemilihan sebatian adalah kaedah pengkelompokan; di mana set-set data sebatian dikumpulkan dalam kelompok masing-masing dan wakil daripada setiap kelompok akan dipilih. Kaedah tidak bertindih seperti kaedah pengkelompokan Ward’s merupakan satu kaedah yang paling berkesan di dalam pengkelompokan sebatian dan digunakan dengan meluas di dalam pemilihan sebatian. Namun begitu, kaedah pengkelompokan bertindih tidak diberikan perhatian yang khusus di dalam pemilihan sebatian mahupun di dalam proses pengenalpastian molekul. Fokus kajian ini adalah kepada kaedah fuzzy c-means dan keberkesanan kelompok yang dihasilkan oleh kaedah ini dianalisa dan dibandingkan dengan kaedah konvensional
pengkelompokan yang lain. Kaedah fuzzy c-means ini telah dipilih kerana ia akan menghasilkan kelompok yang baik dengan mengenalpasti titik tengah kelompok dan darjah keahlian bagi setiap ahli di dalam kelompok. Oleh itu, satu sebatian mungkin berada di dalam lebih daripada satu kelompok berdasarkan kepada darjah
keahliannya. Hasil daripada eksperimen ini dibandingkan dengan keputusan daripada kaedah pengkelompokan Ward’s. Analisa yang diperolehi menunjukkan bahawa pengkelompokan fuzzy c-means memberikan keputusan yang terbaik bagi ketidak-samaan molekul bagi pusat kelompok yang terhasil, tetapi ia tidak
melakukan pemisahan struktur aktik/tidak aktif dengan baik di dalam kelompok yang berkenaan.
Penyelidik :
Rozilawati bt Dollah @ Md. Zain (Ketua) Aryati bt Bakri
Mahadi b Bahari PM Dr Naomie bt Salim
Email : [email protected]
Tel : 07-5532425
TABLE OF CONTENT
CHAPTER TITLE PAGE
ABSTRACT iii
ABSTRAK iv
TABLE OF CONTENT v
LIST OF TABLES viii
LIST OF FIGURES ix
LIST OF SYMBOLS xi
LIST OF ABBREVIATION xii
LIST OF TERMINOLOGY xiii
1 INTRODUCTION 1
1.1 Background of Problems 3
1.2 Problem Statement 5
1.3 Objectives 5
1.4 Scope 6
1.5 Project Plan 6
1.6 Contribution 7
1.7 Organization of Report 8
2 LITERATURE REVIEW 9
2.0 Introduction 10
2.1 Cluster-based Compound Selection 11
2.1.2 Non-Overlapping Method 14
2.1.2.1 Non-Hierarchical Clustering 15
2.1.2.2 Hierarchical Clustering 19
2.1.2.3 Ward’s Technique 21
2.2 Clustering in Chemical Application 23
2.3 Fuzzy Clustering Method 24
2.3.1 Application of Fuzzy Clustering 27
2.4 Evaluation of Compound Clustering for Compound 29 Selection Purpose
2.4.1 Separation of Active/Inactive Structure 29
2.4.2 Diversity Analysis 30
2.4.3 Grouping Similar Compound 31
2.5 Descriptors for Chemical Databases 31
2.5.1 Bit String 33
2.6 Discussion 36
2.7 Summary 38
3 EXPERIMENTAL DESIGN 39
3.0 Introduction 40
3.1 Dataset 41
3.2 Generation of Descriptors 42
3.3 Selection of Similarity Measures 43
3.4 Implementation of Fuzzy Clustering 44
3.4.1 Ward’s Algorithm 47
3.4.2 Fuzzification of Ward’s Cluster using Fuzzy c 49 Means Clustering Method
3.5 Analysis of Results 50
3.6 Discussion 52
3.7 Summary 54
4 EXPERIMENTAL RESULT 56
4.0 Introduction 57
4.1.1 Analysis of Active/Inactive Separation 58
4.1.2 Analysis of Mean Intermolecular 60
Dissimilarity (MIMD)
4.2 Comparison of Fuzzy c-Means and Ward’s 63
Clustering Method
4.2.1 Analysis of Active/Inactive Separation 64
4.2.2 Analysis of Mean Intermolecular 65
Dissimilarity (MIMD)
4.3 Fuzzification of Ward’s Cluster using Fuzzy c 67 Means
4.3.1 Analysis of Active/Inactive Separation 68
4.3.2 Analysis of Mean Intermolecular 69
Dissimilarity (MIMD)
4.4 Discussion 70
4.5 Summary 73
5 CONCLUSION 75
5.0 The Analysis of Contribution 77
5.1 Suggestion for Future Work 78
5.2 Summary 79
LIST OF TABLES
TABLE NO TITLE PAGE
2.1 Types of compound selection method 11
2.2 Different types of non-hierarchical clustering methods 17
2.3 Different choices of hierarchical-agglomerative 20
clustering
2.4 Different types of fuzzy clustering algorithm 26
4.1 Results for proportion of actives from different 58
fuzziness index
4.2 Results for intermolecular dissimilarity from different 61 fuzziness index
LIST OF FIGURES
FIGURE NO TITLE PAGE
1.1 Drug discovery process 2
2.1 Examples of overlapping and non-overlapping clusters 13 (Wild, 2003)
2.2 Overlapping clustering (MacCuish and MacCuish, 14
2003)
2.3 A broad classification of the most common clustering 15 methods (Barnard and Downs, 2002)
2.4 Example of hierarchical-agglomerative and 19
hierarchical-divisive method (Wild, 2003)
2.5 A simple representation of bit string (MacCuish and 33 MacCuish, 2003)
2.6 Encoding chemical structure as a bit string (Flower, 34 1997)
2.7 A detailed encoding of a bit string (Flower, 1997) 34
3.1 Flowchart for fuzzy clustering algorithm 41
3.2 Fuzzy c-means algorithm 46
3.3 Algorithm for Ward’s clustering 48
3.4 Algorithm for Ward’s clustering using RNN 48
3.5 Algorithm for fuzzy c-means clustering in Ward’s 50
method
3.6 Research methodology framework 54
4.1 Result of Proportion of actives (Pa) for Cluster 10 59 4.2 Result of Proportion of actives (Pa) for all clusters 60
(using q = 1.1, 1.5 and 2.0)
4.3 Result of MIMD for Cluster 10 62
4.4 Result of MIMD for all clusters (using q = 1.1, 1.5 and 62 2.0)
4.5 Results from fuzzy c-means and Ward’s clustering 64
4.6 Results from fuzzy c-means and Ward’s clustering 66 based on their MIMD
4.7 Results based on their proportion of actives 68
LIST OF SYMBOLS
q - fuzziness index
k - number of cluster
uij - degree of membership
Xj - the data point of the jth compound
M - number of data point
U - a fuzzy K-partition of the data set C - a set o K prototypes (cluster center) Ci - the centroid of the ith cluster
xik - the attribute value of molecule i in cluster k
n - size of cluster
Pa - proportion of active structure
d2(Xj,Ci): - any inner product metric or the distance measure SA,B - similarity measure between compound A and B
a - the number of unique fragments in compound A b - the number of unique fragments in compound B c - the number of unique fragments shared by compounds
LIST OF ABBREVIATION
AFC - Adaptive Fuzzy Clustering
BCI - Barnard Chemical Information
CA - Confirmed Active
CI - Confirmed Inactive
CM - Confirmed Moderately Active
DNA - Deoxyribonucleic Acid
E.COLI - Escherichia coli
EM - Expectation Maximization
ESS - Error Sum of Squared
FCM - Fuzzy c-Means
FCV - Fuzzy c-Varieties
GG - Gath-Geva
GK - Gustafson-Kessel
HTS - High Throughput Screening
MDDR - MDL Drug Data Report
MDL - Molecular Design Limited
MIMD - Mean Intermolecular Dissimilarity
NCI - National Cancer Institute
PPP - Potential-Pharmacophore-Point
QSAR - Quantitative Structure-Activity Relationship
R&D - Research and Development
RNN - Reciprocal Nearest Neighbor
LIST OF TERMINOLOGY
Alignment - Concerned with the relationships between biological sequences
Analyte - A sample mixture that is passed through some form of material that will provide resistance by virtue of chemical interactions between the components of the sample and the material
Atom - The smallest irreducible constituent of a chemical system Benign - A tumor that is not dangerous to one’s health
Bond - The force which holds atoms together in molecules Compound - A substance formed from two or more elements, with a
fixed ratio determining the composition
E.Coli - One of the main species of bacteria that live in the lower intestines of warm-blooded animals
Gene - A sequence of DNA that represents a fundamental unit or heredity
Gene - Refers to the multi-step process that begins with protein Expression biosynthesis and is followed by folding, post
translational modification and targeting.
Lead - A molecule that have the potential to become new drug Malignant - A tumor that was formed when the body’s own cell
divide in an uncontrolled manner
Molecule - The smallest indivisible portion of a pure compound that retains a set of unique chemical and physical properties Organic - A branch of chemistry dealing with carbon-based compounds Outlier - An unusual data objects
EDIE E D I E J a b
I S $ àa
Ø¿
CHAPTER 1
INTRODUCTION
Chemoinformatics is the collection, representation and organisation of chemical data to create chemical information, to which it can be applied to create chemical knowledge. In pharmaceutical and agrochemical industry,
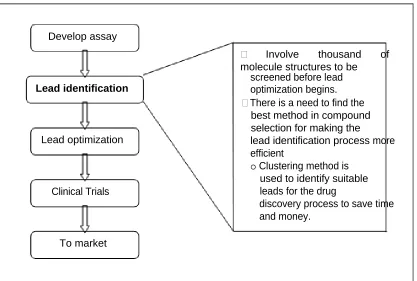
chemoinformatics has been used for identification of novel compounds with useful, and commercially valuable, biological properties (Brown and Martin, 1996; Warr, 1997; Tropsha and Zheng, 2001). The drug discovery process is very complex, and it is a multi-disciplinary task with many stages to be performed in a long time, as shown in Figure 1.1. However, the drug discovery process is a very risky business because most of the newly found compounds do not result in a drug. The molecule that has the potential to become drugs may cause unexpected long-term side effects. The drug discovery process can take about 12 years and the costs may reach USD $350 millions per drug.
2
Malaysia’s research and development (R&D) (Law, 2003). Malaysian government’s commitment to participate actively in biotechnology industry is proven by the
development of Bio Valley Malaysia, in the south of Cyberjaya. Bio Valley Malaysia will conduct a wide spectrum of biotechnology-related activities, especially in drug research.
Develop assay
Involve thousand of molecule structures to be
Lead identification
Lead optimization
Clinical Trials
To market
screened before lead optimization begins. There is a need to find the best method in compound selection for making the
lead identification process more efficient
o Clustering method is used to identify suitable leads for the drug
discovery process to save time and money.
Figure 1.1: Drug discovery process
This project concentrates in the lead identification process. Here, initial leads for drug development will originate from high-throughput screening (HTS), where hundreds of thousands of compounds are tested for biological activity. This slow process of
identifying the leads has created constrictions in the drug discovery process, which are time constraint and the huge amount of cost in developing drugs. Because of these
3
There are many approaches for compound selection such as cluster-based compound selection, dissimilarity-based compound selection, partition-based compound selection and optimization-based compound selection (Salim, 2003). Among these different approaches, cluster-based or clustering has become the most commonly used in
compound selection. Clustering is an unsupervised learning problem, where only inputs are available and no target outputs are predefined by the users. Thus, it deals with finding structure in a collection of unlabeled data. It is used to measure the similarity of items in multi-dimensional space. Below are the three main uses of clustering in
chemoinformatics for compound selection:
i) Grouping compounds into chemical series, which is particularly helpful in analyzing large datasets (Wild, 2003).
ii) Grouping structures which are likely to have similar biological activity (Wild, 2003).
iii) Choosing small sets of representative compounds from large datasets. The small number of compounds is selected from each cluster to represent the entire dataset to be used as candidates for chemical and biological compound screening (Wild, 2003; Massart and Kaufman, 1993 and Takashi et al., 1980).
By using cluster analysis method, it has helped the researches of finding lead compounds faster and more effectively. Thus, cluster-based is one of the most important
unsupervised learning problems in chemoinformatics.
1.1BACKGROUND OF PROBLEM
One effective way to summarize the content of a chemical database is by using the compound clustering method. This method is a technique to separate the datasets into different groups or clusters where items in one group are similar to each other.
4
simplify and interpret large amounts of multidimensional data. It has been widely used for researches in biological science. It is likely needed for datasets of chemical
structures, since the datasets are likely to be very large and have millions of compounds.
Clusters can be overlapping or non-overlapping. The non-overlapped clustering method is where each compound is a member of exactly one cluster. It has two major categories, hierarchical and non-hierarchical clustering. Most of the clustering methods used in chemical datasets are from non-overlapping method, because the development and analysis of this clustering method is simpler compared to overlapping methods. Willett (1987) has proven that non-overlapping methods are most effective methods for compound selection in his study of comparing Ward’s (hierarchical) and Jarvis-Patrick (non-hierarchical).
Most of compound clustering method for compound selection is from the non-overlapping method. The effectiveness of the non-non-overlapping methods has always been analyzed and compared, in order to find the best clustering method for compound selection. Most pharmaceutical industries are using these methods in the process of drug discovery for lead identification.
5
1.2PROBLEM STATEMENT
This study on fuzzy clustering in compound selection is experimented based on their intermolecular dissimilarity of their centroids and their ability to separate active/inactive structures. The different values of fuzziness index and the number of clusters are also experimented to see the effect of these different values to the clusters produced by fuzzy clustering. The combination of fuzzy c-means and Ward’s clustering method is analyzed to evaluate the effectiveness and efficiency of both methods.
1.3OBJECTIVES
Objectives of the project are as follows:
i) To investigate the fuzzy clustering techniques in chemical database.
ii) To test the effectiveness of the clusters produced from fuzzy method based on their ability to separate actives/inactives compounds and their intermolecular similarity of their centroids.
iii)To test the different fuzziness index and their effect on the clusters produced. iv)To analyze and compare the result from the fuzzy clustering method with Ward’s
method.
6
1.4SCOPE
The scopes of this project are as follows:
i)The analysis is done to the National Cancer Institute’s (NCI) AIDS. ii)String (binary descriptor) is used as representation of the chemical
compounds.
iii) Distance measures between the descriptors are by using the Euclidean distance measures and for intermolecular similarity, the Tanimoto distance
measures are used.
iv) Fuzziness index in the range of 1.1 to 2.0 is tested.
v) For comparison with overlapping method, the fuzzy clustering method results will compared to the Ward’s clustering method.
vi) For the combination of both methods, the clusters produced by Ward’s clustering method will be used as the initial clusters in fuzzy clustering.
1.5PROJECT PLAN
The project will be carried out in two parts. The first part of the project will focused in understanding of the literature review and the methodology to be used. Here, most time is spent on searching and gathering information from articles in journals. The understanding of cluster-based method in compound selection is important in order to know different methods of clustering. The fuzzy clustering
implementation in chemical compounds is also being researched. The first part aim is to have better understanding of compound selection using fuzzy clustering before
7
For the second part of the project, the implementation of the fuzzy clustering method will be started. The implementation of part two will start with generating descriptors and calculating the distance measure for each descriptor. Then the fuzzy cluster and Ward’s programming codes will be written and the results will be analyzed to compare both cluster methods. The combination of both methods will also be done in part two. After comparing the results to see whether fuzzy
clustering can produce the better cluster for compound selection, the second part of the report will be written. This will include the experimental result, analysis of results and its comparison with other method.
1.6CONTRIBUTION
The developed clustering method based on the fuzzy c-means clustering algorithm, was tested and analyzed based on their ability to separate active/inactive structure and the difference of their centroid based on their intermolecular dissimilarity. Thus, the result from the clusters produced gives the information of whether the
8
1.7ORGANIZATION OF REPORT
Chapter 1 of this report will give the introduction and the background of problem on why is study is being conducted. Thus, from the background of problem, a problem statement is derived and this will become the aim for this project. It will also give the objectives and scope of study for the project.
Chapter 2 will discuss mainly on the compound clustering and details on the clustering method, its application and types of techniques from the overlapping and non-overlapping method produced in clustering. It will also discuss in detail the fuzzy clustering method as the method to be compared to Jarvis-Patrick or Wards and the application produced by fuzzy clustering. The last part of the chapter will discuss the diversity analysis as the technique to compare all the method in order to find the best method in clustering-based approach in compound selection.
CHAPTER 2
LITERATURE REVIEW
This chapter will discuss the compound selection technique that is chosen for the project, the cluster-based method. In Introduction, we will see the importance of compound selection in chemical studies. Many different approaches of compound selection are introduced and the reason of selecting cluster-based method is mentioned.
10
The second part will discuss fuzzy clustering method in details and the studies that were using fuzzy clustering in their experiment of chemical compound. Studies by Feher and Schmidt (2003), Barkó et.al (1999), Guthke et.al (2002) and Rodgers et.al (2004) will be referred as they have successfully used fuzzy clustering in their
experiment of chemical, organics, gene clustering and chemical structures, respectively. The last part of the chapter will discussed the diversity analysis and the separation of active/inactive structures as a technique for measuring the performance between fuzzy and Ward’s clustering method, and the combination of both methods.
2.0 INTRODUCTION
The main purpose of compound selection in lead identification is because of the existence of millions of compounds. This has made it extremely hard to synthesize all of the library compounds in a short period. It could take a chemist 27 million weeks or 0.5 million years to synthesize 1,000 compounds per week (Tropsha & Zheng, 2002). The similarity of the compound structures will create redundancies in the chemical
information contained in the library. This has made the compound selection an important study in chemoinformatics because there is a need to speed up the search in the library compound.
There are many approaches for compound selection such as cluster-based
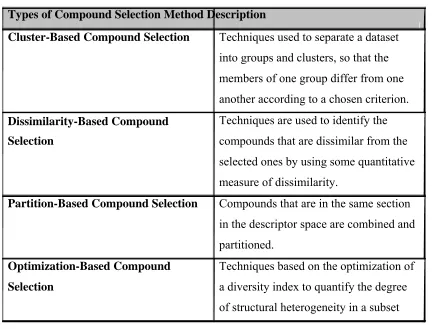
compound selection, dissimilarity-based compound selection, partition-based compound selection and optimization-based compound selection. Table 2.1 summarizes the
11
Table 2.1: Types of compound selection method Types of Compound Selection Method Description
Cluster-Based Compound Selection Techniques used to separate a dataset into groups and clusters, so that the members of one group differ from one another according to a chosen criterion.
Dissimilarity-Based Compound Techniques are used to identify the Selection compounds that are dissimilar from the
selected ones by using some quantitative measure of dissimilarity.
Partition-Based Compound Selection Compounds that are in the same section in the descriptor space are combined and partitioned.
Optimization-Based Compound Techniques based on the optimization of Selection a diversity index to quantify the degree
of structural heterogeneity in a subset
2.1CLUSTER-BASED COMPOUND SELECTION
Cluster-based compound selection involves subdividing a set of compounds into clusters and choosing one compound or a small number of compounds from each cluster (Salim, 2003). Clustering was first studied in biological science and it is now being applied to many other areas including chemoinformatics. The items to be clustered in
12
Among all of the compound selection approaches, cluster-based compound selection is a useful subset selection based on experiments by Bayada et.al (1999), Brown and Martin (1996), Matter (1997), Taylor (1995) and Van Geerestein et.al (1997). Bayada et.al (1999) experiment using Ward’s clustering method, have found that
clustering is the best choice for compound selection because it can extract a diverse set of activities from compound file. Ward’s method was also agreed to give a better result in experiment by Brown and Martin (1996). They compared Ward’s method to group-average clustering, Guēnoche clustering from hierarchical-divisive and Jarvis-Patrick from non-hierarchical clustering. While experiment by Matter (1997) shows that hierarchical clustering gives only small difference between median, average and single linkage, when used with 2D descriptors.
Another experiment by Taylor (1995) used cluster sampling based on analysis of nearest neighbors where the molecules that have the highest occurrence in the nearest neighbor lists of other molecules were chosen. After the molecules have been chosen, their own nearest neighbors were excluded from the following selection. This technique tends to get molecules sampled from natural clusters, in the order of the largest clusters down to singletons (Salim, 2003).
13
Figure 2.1: Examples of overlapping and non-overlapping clusters (Wild, 2003)
2.1.1OVERLAPPING METHOD
Clusters can be overlapping or non-overlapping. If a compound occurs in more than one cluster, the clusters are overlapping. At one extreme, each compound is a member of all clusters to a certain degree (Barnard and Downs, 2002). This is an example of fuzzy clustering, in which the degree of membership of an individual compound is in the range 0 to 1. The total membership summed across all clusters is normally required to be 1. Overlapping clusters can be very useful; however, more overlapping will produce more ambiguity, and will be more difficult to interpret (MacCuish and MacCuish, 2003). The diagram is shown in Figure 2.2.
14
Detailed discussion on Fuzzy clustering method is focused in section 2.4.
Distinct (Disjoint) Overlapping clusters, Overlapping clusters Clusters: just one but understandable but difficult to
clustering of many understand
possible
Fewer Decision Ties less Ambiguity More Decision Ties more Ambiguity
Figure 2.2: Overlapping clustering (MacCuish and MacCuish, 2003)
2.1.2NON-OVERLAPPING METHOD
15
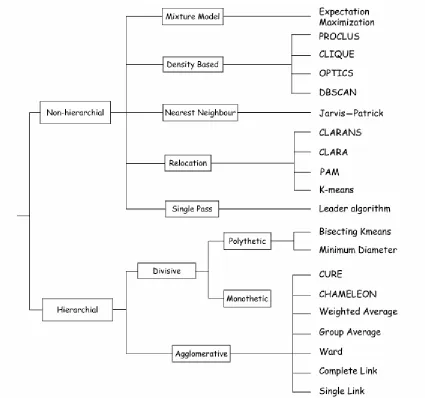
Figure 2.3: A broad classification of the most common clustering methods (Barnard and Downs, 2002)
2.1.2.1NON-HIERARCHICAL CLUSTERING
16
objects in the same cluster is being separated from non-similar objects placed in different cluster. Thus, the clusters have no hierarchical relationships between them.
Non-hierarchical methods cover a wide range of different techniques to build the clusters. The first method is the single-pass method where the partition is created by a single pass through the data set. However, if the partition is randomly accessed, each compound is examined only once to decide which cluster it should be assigned. An example of the single-pass method is the Leader Algorithm, where the cluster is represented by its centroid. The first compound selected becomes the first cluster; a single sequential scan of the dataset and cluster centroids are updated as each compound is assigned to a particular cluster (Barnard and Downs, 2002). According to Barnard and Downs (2002), this method is simple to implement and very fast. However, the disadvantages of the method is that it is order dependent; if the compounds are rearranged and scanned in a different order, then the resulting clusters can be different.
The second method is the relocation method. In this method, compounds are reassigned from one cluster to another in order to improve on the initial estimation of the clusters. Typically, it is accomplished based on improving a cost function (Barnard and Downs, 2002). This is done by guessing where the centers of the clusters are located and then the centers are iteratively refined by shifting the compounds between the clusters until stability is achieved. The best-known relocation method is the K-Means method (Barnard and Downs, 2002), where there exist many variants and different algorithms for its implementation. The K-Means algorithm minimizes the sum of the squared Euclidean distances between each item in a cluster and the cluster centroid.
17
neighbor compounds. The criterion used for cluster formation is the commonality between nearest neighbors. Although several nearest-neighbor methods have been developed, the Jarvis-Patrick method is the mostly used for chemical applications.
The next non-hierarchical clustering is the mixture model, where the data are assumed to exist as a mixture of densities. The densities of the data are not known in advance, however usually it was assumed as Gaussian (normal) distributions. The most widely used and most effective general technique for estimating the mixture model parameters is the Expectation Maximization (EM) algorithm (Barnard and Downs, 2002). It finds values of the parameters, which associated with the mixture model, by using an iterative refinement approach. This is almost similar to the K Means relocation method, but the mixture model has not been widely use in the chemical application.
A density-based, or mode-seeking, method is based on the distribution of
descriptors across the dataset as generated patterns of high and low density. When these patterns are identified, they can be used to separate the compounds into clusters. Other nonhierarchical methods include topographic and probabilistic methods (Barnard and Downs, 2002). Table 2.2 summarizes different types of nonhierarchical clustering method:
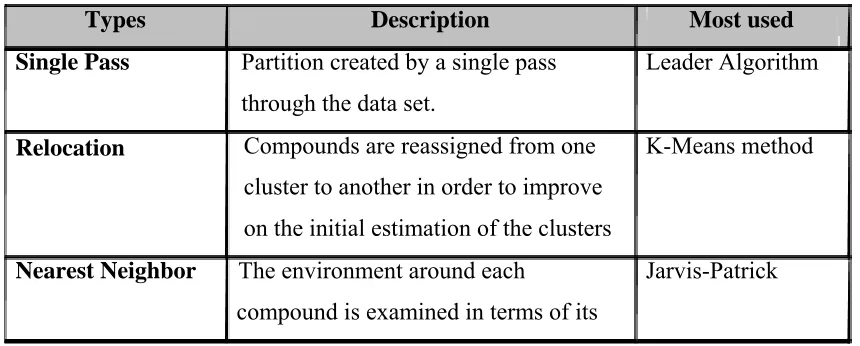
Table 2.2: Different types of non-hierarchical clustering methods
Types Description Most used
Single Pass Partition created by a single pass Leader Algorithm through the data set.
Relocation Compounds are reassigned from one K-Means method cluster to another in order to improve
on the initial estimation of the clusters
18
most similar neighbor compounds
Mixture Model Data are assumed to exist as a mixture of densities.
Density Based Based on the distribution of descriptors across the dataset as generated patterns of high and low density - used to separate the compounds into clusters
Topographic Apply a variable cost function with added restriction that topographic relationships are preserved- the neighboring clusters are close in descriptor space
Probabilistic Generates non-overlapping clusters where the compound is assigned a probability that it belongs to the chosen clusters.
Expectation Maximization (EM) algorithm
-none-
Kohonen maps
19
2.1.2.2HIERARCHICAL CLUSTERING
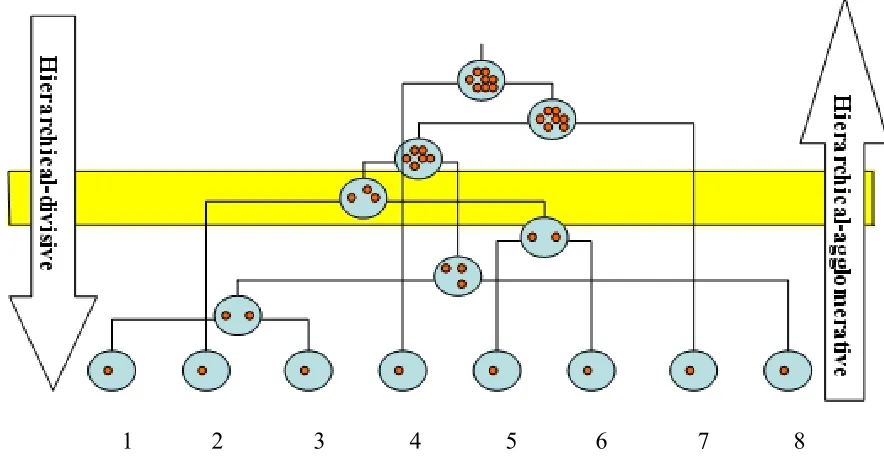
If a data set is analyzed in an iterative way, where in each step a pair of clusters is merged or a single cluster is divided, the result is hierarchical clustering (Barnard and Downs, 2002). The first method starts with all compounds as single object, known as a singleton, and then merged iteratively until all compounds are in a single cluster. This method is called hierarchical-agglomerative clustering. If the hierarchical method starts with all compounds in a single cluster and iteratively splits one cluster into two until all compounds are singletons, the method is called hierarchical-divisive method.
1 2 3 4 5 6 7 8
Figure 2.4: Example of hierarchical-agglomerative and hierarchical-divisive method (Wild, 2003)
In the hierarchical-agglomerative method, it starts with each compound in its own cluster (Wild, 2003). The two most similar clusters are merged to form a new cluster and this process will be repeated until all items are merged into one cluster. In Figure 2.4, the two most similar initial clusters are 1 and 3, which are then merged to form a new
cluster. After the first merge to form a new cluster, the most similar clusters (8), are then merged with the new cluster. Next, clusters 5 and 6 are merged, this process will
20
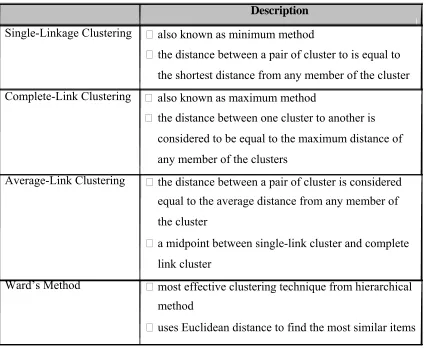
Table 2.3: Different choices of hierarchical-agglomerative clustering Description
Single-Linkage Clustering also known as minimum method
the distance between a pair of cluster to is equal to the shortest distance from any member of the cluster Complete-Link Clustering also known as maximum method
the distance between one cluster to another is considered to be equal to the maximum distance of any member of the clusters
Average-Link Clustering the distance between a pair of cluster is considered equal to the average distance from any member of the cluster
a midpoint between single-link cluster and complete link cluster
Ward’s Method most effective clustering technique from hierarchical method
uses Euclidean distance to find the most similar items
There are different choices of hierarchical-agglomerative clustering, such as
simplelinkage, average-linkage, complete-linkage, and Ward’s method as in Table 2.3:
21
The second method in the hierarchical clustering is the divisive clustering. Divisive method occurs when the hierarchical method starts with all the compounds in a single cluster, and it iteratively splits the cluster into two until all compounds are
singletons. One way to choose a set of clusters is normally by using stopping rules. The stopping rules are used to select the clusters that best represent the populations (Mojena, 1977) and this is represent by the slice across the hierarchy. Any slice should provide a set of non-overlapping clusters that cover all of the items. In Figure 2.4, the slice highlighted would produce two clusters of three items, two clusters of two items, and two singletons. From the divisive method, it will depend on the presence and absence of some chosen features. This means that, after the division of the cluster, only that attribute is presence in the clusters, but it will be absent from the attribute in the other new cluster that has been formed.
In hierarchical-divisive clustering, there are two methods on how the cluster splits; namely monothetic and polythetic. Monothetic happens when only one descriptor is used to determine how the cluster is split. Polythetic used more than one descriptor, but most polythetic methods are slow. According to Barnard and Downs (2002), even though monothetic methods are generally much faster compared to the hierarchical-agglomerative method, it often gives poor performance because they only based on just one attributes. Chu (1974) has made a comparison of a range of classification procedures for 66 structurally diverse molecules as either tranquilizers or sedatives and his research has included monothetic divisive method. For polythetic method, Kaufman et.al (1983), Massart and Kaufman (1983) have used the method to cluster coals based on their elemental and mineral compositions.
2.1.2.3WARD’S TECHNIQUE
22
produced the smallest variance in the merged group is linked. Thus, Ward’s method is classified as geometric or cluster-center method, together with centroid and median method.
Reducibility property concept was introduced by Murtagh (1983), and it was applicable to geometric method. It states that for the merger of two clusters a and b, to form a cluster c, there cannot be another cluster d that is closer to c than to a and b (Murtagh, 1983). Ward’s method, implemented using the Euclidean distance, is one of a few geometric methods that satisfy the reducibility property (Barnard and Downs, 2002).
The importance of the reducibility property is that it enables the stored-matrix algorithm to be replaced by the more efficient reciprocal nearest-neighbor (RNN) algorithm that requires only O(N2) time and O(N) space (Barnard and Downs, 2002).
According to Barnard and Downs (2002), RNN algorithm works by tracing paths through proximity space from one point to its nearest neighbor. This is repeated until a point is reached where the nearest neighbor was the previous point in the path. This pair of points is called the reciprocal nearest neighbors.
In 1994, Downs et.al used RNN implementations of the Ward and groupaverage methods to compare methods for clustering compounds based on property data. These two agglomerative methods have been used successfully in comparative studies covering a wide range of non-chemical applications. From this comparison, Ward’s showed a consistently reasonable result. Willett (1997) has found that the best result among the hierarchical method was produced by Ward’s method. However, this method was not well suited to process large datasets due to the requirement for random access to
23
2.2 CLUSTERING IN CHEMICAL APPLICATION
Most of the clustering in chemical compounds emphasize on pharmaceutical applications because these applications tend to process very large and high dimensional data sets (Barnard and Downs, 2002). The most widely used of clustering techniques are the hierarchical-agglomerative technique, especially the Ward’s technique. This is because Ward’s gives the best result in separating actives and inactives structures. The finding was based on studies by Brown and Martin (1996) in their experiment of
comparing different cluster method and descriptors for use in compound selection. In the experiment, the performance of group-average clustering and Guēnoche method were almost similar and only slightly worse than Ward’s. Whereas, Jarvis-Patrick performed the poorest due to the most uneven cluster size and was prone to produce many
singletons as well as large diverse clusters (Brown and Martin, 1996).
Van Geerestein et.al (1997) showed that cluster representatives from Ward’s clustering provide a significantly better sampling of activity space than random selection. Their research showed that clustering could separate actives from inactives in a dataset. Thus, a cluster containing at least one active compound will likely have more than an average number of other active compounds in the cluster. An example that used the Ward’s technique was the CerBeruS, a system that incorporated Ward’s clustering and level selection. The system is used for analysis of Johnson and Johnson Company’s compound database. The clustering was used to produce smaller, more homogeneous subsets from which one representative compound was selected as a screening candidate. The level selection was used to determine the optimal clustering level (Barnard and Downs, 2002).
24
chemical database. The Daylight Clustering Package is a set of programs that provide general-purpose clustering of molecules based on their structural connectivity. Jarvis-Patrick clustering has also been used to support QSAR analysis in a system developed at the European Communities Joint Research Center (Barnard and Downs, 1992). The database contains more than 100,000 compounds and it has been clustered using 2D structural descriptors. According to Barnard and Downs (2002), Jarvis-Patrick clustering was used to extract clusters containing sufficient compounds with measured data. This can be used to estimate the properties of the compounds in the clusters that have lack of data.
2.3 FUZZY CLUSTERING METHOD
The goal of traditional clustering is to assign each data point to only one cluster. In contrast, fuzzy clustering assigns different degrees of membership to each point where the membership of a point is shared among various clusters (Fung, 2001). Fuzzy
clustering method has been chosen from the overlapping clustering method to be compared to non-overlapped clustering method. This is because fuzzy was expected to perform better, in cases where there are a significant number of outliers, such as molecular dynamics simulations and molecule alignments (Feher and Schmidt, 2003). This is a similar case of compound selection where finding unusual data objects or outliers from the inactive set produced by the clusters can be a result of determining grouping in a set of unlabelled data.
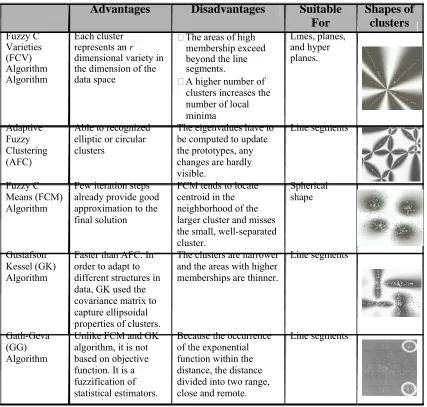
There are few types of fuzzy clustering, such as fuzzy c-varieties (FCV)
25
Since the shape o the clusters is often not known, the AFC algorithm is more suitable (Kaymak and Setnes, 2000), where the shape of the clusters is change from point-shaped clusters to straight lines, via elliptic shape.
The third type of the fuzzy clustering is fuzzy c-means clustering algorithm. The shape of clusters produces by fuzzy c-means clustering is determined by the distance measure that is used. Usually, it uses Euclidean distance measure and it is suitable for clusters with spherical shape (Dunn, 1973). Fuzzy c-means algorithm have been used extensively for different tasks such as pattern recognition, data mining, image processing and fuzzy modeling (Kaymak and Setnes, 2000).
26
Table 2.4: Different types of fuzzy clustering algorithm
Advantages Disadvantages Suitable Shapes of For clusters Fuzzy C Each cluster The areas of high Lines, planes,
Varieties represents an r membership exceed and hyper (FCV) dimensional variety in beyond the line planes. Algorithm the dimension of the segments.
Algorithm data space A higher number of clusters increases the number of local minima
Adaptive Able to recognized The eigenvalues have to Line segments Fuzzy elliptic or circular be computed to update
Clustering clusters the prototypes, any
(AFC) changes are hardly
visible.
Fuzzy C Few iteration steps FCM tends to locate Spherical Means (FCM) already provide good centroid in the shape Algorithm approximation to the neighborhood of the
final solution larger cluster and misses the small, well-separated cluster.
Gustafson Faster than AFC. In The clusters are narrower Line segments Kessel (GK) order to adapt to and the areas with higher
Algorithm different structures in memberships are thinner. data, GK used the
covariance matrix to capture ellipsoidal properties of clusters.
Gath-Geva Unlike FCM and GK Because the occurrence Line segments (GG) algorithm, it is not of the exponential
Algorithm based on objective function within the function. It is a distance, the distance fuzzification of divided into two range, statistical estimators. close and remote.
27
2.3.1APPLICATION OF FUZZY CLUSTERING
The study by Barkó et.al(1999) used fuzzy c-means clustering for discrimination of organic compounds using piezoelectric chemical sensor array data of 14 analytes. They applied fuzzy c-means and fuzzy c-lines algorithm for classification and quantitative determination of different volatile organic compounds. Here, the fuzzy clustering algorithm is used to handle the frequency signals of the piezoelectric quartz sensors and all of the sensing materials gave a different response to each analytes. The aim of using fuzzy clustering is to recognize the signals of 14 analytes, where the points related to the analytes are grouped according to their place in n dimensional place. The results were compared using the Principal Component Analysis (PCA) and all of the analytes was successfully identified by PCA algorithm. The fuzzy c-means algorithm has proved to be better in the discrimination of analytes with similar structure, like benzene and toluene (Barkó et.al, 1999). All 14 organic compounds can be distinguished by fuzzy clustering and the similar alcohols, aromatic hydrocarbons and open chain hydrocarbons were easily discriminated.
In another study, Feher and Shmidt (2003) focused on developing and testing algorithm that will provide an applicable clustering approach to deal with a collection of conformers and molecular alignments. Fuzzy clustering was chosen for the study
because of the need to select representative conformations or alignments in cases where there are no clear groupings in the data. In this study, Feher and Shmidt (2003) was using five examples, the first three examples shows the application of fuzzy clustering to conformation and the other two examples show the use of fuzzy clustering in flexible alignments. From the result of the study, the alignments process can be optionally
incorporated with the quality of alignments using the weighted fuzzy c-means. They also proved that conformers or alignments might belong to more than one cluster with
28
A study by Guthke et.al (2002) used fuzzy c-means algorithm to study the gene expression data and gene functions of the microorganism Escherichia coli or
E.coli. The experiment were conducted by comparing fuzzy c-means algorithm and Gustafson-Kessel algorithm with K-means clustering, Kohonen’s self-organizing maps (SOM), Eisen’s hierarchical clustering and Quinlan’s C4.5 decision tree induction algorithm. Their experiment was using 265 genes that belong to three functional groups.
Among the methods used in the experiments, the highest prediction accuracy was from fuzzy c-means and Gustafson-Kessel with 66.0% and 70.6%, respectively. The accuracy of gene function prediction can be higher using fuzzy technology (Guthke et.al, 2002). Thus it should be favored due to the limited accuracy of gene expression
measurements by DNA arrays as well as due to the fact that one gene may be related to more than one physiological function.
The most recent research of fuzzy c-means in chemoinformatics is by Rodgers et.al (2004), where they evaluates the use of fuzzy c-means clustering method for the clustering of files of 2D chemical structures. In their experiment, they used two datasets, Sygenta and Starlist, and compared their findings to K-means and Ward’s clustering method.
In their experiments, the results from fuzzy c-means were compared to kmeans clustering and Ward’s clustering. The comparison involves simulated property
29
2.4 EVALUATION OF COMPOUND CLUSTERING FOR COMPOUND SELECTION PURPOSE
The need to ensure coverage of the largest possible expanse of chemical space to search for bioactive molecules means that the selection techniques must aim to maximize the diversity of the library (Bayley et.al, 1999). The evaluation of the effectiveness of the clusters produced by many compound clustering for compound selection can be
experimented in many ways. The most used analyses are the ability to separate active/inactive structure, diversity analysis and the ability to group similar compound together.
2.4.1SEPARATION OF ACTIVE/INACTIVE STRUCTURE
According to Brown and Martin (1996), to select the most suitable clustering method, the clusters produced must cluster together biologically similar structures and separate actives and inactives into different set of cluster. Selecting a representative from each cluster should allow the range of diversity among active compounds to be sampled and number of actives to be missed should be minimized. The degree of separation of actives and inactives in a set of clusters is indicated by the difference of the proportion of structures in the dataset that are actives. Brown and Martin (1996) have given the
parameter in calculating the proportion of actives (Pa) in a cluster and the active cluster subset. An active cluster is defined when there are at least one member of a cluster is active. A subset of the active dataset is considered as a set of structures in active cluster (Brown and Martin, 1996).
30
where the active may distribute at no more than one per cluster and thus, inactive clusters will still be formed. Another reason for the increasing of the Pa value is when if there will occur is any greater similarity between pairs of actives than active-inactive pairs. This depends on both the presence of such pairs in a dataset and the ability of a given descriptor to characterize the similarity.
2.4.2DIVERSITY ANALYSIS
Another evaluation on the clusters for compound selection is by using the diversity analysis, where diversity refers to the degree of structural variation that is present within the set of molecules from a combinatorial synthesis. One of the applications of diversity techniques is subset selection (Wild, 2003). This application requires a small representative set of compounds for a large dataset. It is based on the assumption that the conclusions drawn from the small set is the representative a larger set. Thus, the representative sets represent the variety of the dataset. Diversity measures can be used to compare the diversity of one dataset to another. The measures can be used to see the different of two sets of compounds
31
quantify the degree of resemblance between two such representations (Holliday et.al, 2002).
2.4.3GROUPING SIMILAR COMPOUND
In the ability to group similar compound, the techniques were derived from the similarity searching techniques in chemical databases. Similarity searching involves comparing the set of structural descriptors that characterize a molecule. The molecule will exhibit activity corresponding to the sets of descriptors for each of the database structures. The result of the comparison enables the calculation of a measure of inter-molecular structural similarity and it will determine the structures that are most similar to the target structure or the nearest neighbors.
2.5DESCRIPTORS FOR CHEMICAL DATABASES
32
Descriptors can be classified into 1D descriptors, 2D descriptors and 3D
descriptors. Examples of 1D descriptor are physicochemical properties. 2D screens (such as bit strings) and topological indices are examples of 2D descriptors. 3D descriptors consist of 3D screens, potential-pharmacophore-point descriptors or PPP and affinity fingerprints. 3D-descriptor usually changes its values if the molecule shifts to a different spatial conformation.
The use of molecular descriptor is based on the notion that similar molecules generally produce similar biological effects (Gillet, 1999). According to Gillet (1999), the factors affecting the choice of structural descriptors for library design are as follows:
i) If the descriptor is a good indication of biological activity, the good coverage of biological space can be achieved by covering as diverse range of structural types as possible.
ii) The speed with which they can be calculated should be fast enough to allow the analysis of the huge numbers of compounds.
For this research, the focus will be on 2D descriptors, that is Barnard Chemical Industries (BCI) dictionary bit string for binary descriptor. 2D descriptors have been chosen because it performs remarkably well in numbers of application (Bajorath, 2001). They are also capable of producing meaningful results in virtual screening. This is also agreed by Brown and Martin (1996) where they compare 2D descriptors available from MACCS, Unity and Daylight with 3D descriptors of Unity and PPP, by using different clustering method. They suggested that all 2D
33
2.5.1 BIT-STRING
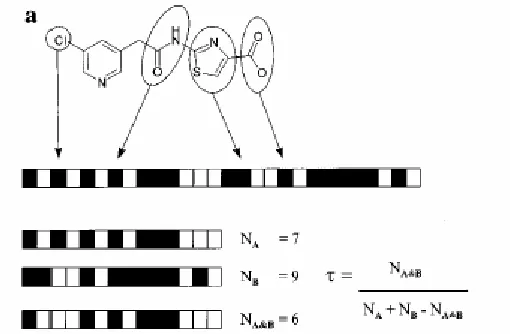
Another example from the 2D description is the 2D screen, where it is categorized as dictionary bit strings and hashed fingerprint. The process converting the molecules into bit string involves splitting a molecule up into fragments and if a particular fragment is present, then a corresponding bit is set in the bit string
(Flowers, 1997) as shown in Figure 2.5. There are several methodologies exist for chemical binary representations such as Daylight Chemical Information Systems (Daylight), Molecular Design Limited (MDL) and Barnard Chemical Information Systems (BCI).
CH3
Cl NH2
1 0 0 0 1 0 0 0 1 ...1
NH 2
Figure 2.5: A simple representation of bit string (MacCuish and MacCuish, 2003)
34
Figure 2.6: Encoding chemical structure as a bit string (Flower, 1997)
A more detailed representation of how bits are set is shown in Figure 2.7. The molecule is decomposed into a set of atom paths of all possible lengths and each of these paths is then mapped to a bit set in a corresponding binary string.
Figure 2.7: A detailed encoding of a bit string (Flower, 1997)
35
approaches. BCI bit string is a 1052-bit structural key-based bit string generated based on presence and absence of fragments in the BCI’s standard 1052 fragment dictionary, which encodes augmented atoms, atom sequences, atom pairs, ring components and ring fusions descriptors (Dittmar et.al, 1983). BCI dictionary could generate thousands of keys, resulting in molecular fingerprint bit lengths approximately 5,000 bits (MacCuish and MacCuish, 2003).
Another type of the 2D screen descriptors is the hashed fingerprint. It was designed to remove the disadvantage associated with structural keys (Gillet, 1999). This will allow for more generalization where the unique fragments that exists in a molecule is hashed using some hashing function to fit into the length of the bit string. The hashed fragments encode all unique linear, branched, and cyclic fragments, including
overlapping fragments (Flower, 1997). Then, each fragment is mapped to an integer randomly in the range 0 to (231-1) and the integer generated is unique and reproducible for each unique structure.
Daylight algorithm is an example of a hashed fingerprint. A molecular fingerprint is generated from a hash of all the unique connection paths or a subgraph up to a
36
2.6DISCUSSION
In compound selection, the cluster-based or clustering method, especially the non-overlapping clustering, is widely used. Many studies have focused on
nonoverlapping clustering method in chemoinformatics since the 1980s; hence, most of the clustering methods that have been widely used are from this approach. Methods that have become particularly popular for clustering chemical structures include Ward’s clustering, a hierarchical method and Jarvis-Patrick clustering, a nonhierarchical method (Bajorath, 2001). Hierarchical and non-hierarchical clustering are the two major
categories from the non-overlapping clustering.
In comparing the clustering method, the method’s efficiency in terms of computational complexity is considered one factor of choosing the best method. Other than the computational efficiency, there are other factor have to be taken into account in choosing the best clustering method for compound selection. These factors are as follows:
i) The clustering ability to recover the natural clusters that exist in the dataset.
ii) Their effectiveness in gaining the desired results from their intended applications.
37
number of small clusters since they are independent of one another. New compounds can also be added without having to re-cluster the whole dataset.
Ward’s method is a hierarchical clustering method, where the cluster size distributions are more even than Jarvis-Patrick, but the clusters tend to be spherical (Downs, 2001). In Ward's method, the Euclidean distance is used to determine distances between points. The cluster centroid can be taken as the point in the middle of the distance between the two initial points. Studies also indicate that Wards methods are better than Jarvis-Patrick for property prediction (Downs et al., 1994) and better than other hierarchical clustering for active/inactive separation (Brown and Martin, 1996).
Brown and Martin's experiment (1996) has compared various clustering method (including Jarvis-Patrick and Ward’s method) for compound selection using various 2D and 3D fingerprint. Their assessment was based on the degree to which clustering separate active from inactive compounds and they have found that JarvisPatrick
performed the poorest but fastest, which means that, even though JarvisPatrick has been widely used for structure-based clustering for compound selection, it may not be the best method for compound selection. There are possibilities that an inactive compound might be selected as representative of one or more actives. The results show that Ward’s method gave the best and most consistent results.
38
The use of fuzzy clustering has been implemented in the study of separation of malignant and benign tumors and the study of selecting representative conformers (Luke, 2000) and molecular alignments (Feher and Shmidt, 2003). These two studies have shown that fuzzy clustering gives better results in term of having little impact on the success rate. The latest study in fuzzy c-means have also proved that based on simulated property prediction, fuzzy c-means method was at least as effective as traditional, crisp clustering based on 2D fingerprint (Rodgers et.al, 2004). Thus, fuzzy clustering should be tested in term of efficiencies and process time, in the compound selection
environment more seriously because the result may gives us other choices in searching the compound libraries.
2.7SUMMARY
In this chapter, we can see that most clustering used in chemoinformatics focused to the non-overlapping method, where most methods have been tested for efficiency and compared to find the best and fastest method for compound clustering. These include the study of Ward’s and Jarvis-Patrick, where both methods have been proven that they are the best method for compound clustering (Brown and Martin, 1996; Downs et.al, 1994; Willett, 1987; Willett et.al, 1986).
However, the efficiency of fuzzy clustering has never been tested in the
compound selection environment or compared to the other clustering methods. The need to this comparison is that the results from the comparison will give a variety of
CHAPTER 3
EXPERIMENTAL DESIGN
40
3.0 INTRODUCTION
The current main use of clustering for chemical datasets is to find representative subsets from high throughput screening (HTS) and combinatorial chemistry. Another use is to increase the diversity of in-house datasets through selection of additional
compounds from other datasets (Downs and Barnard, 2002). Overall, the process of clustering involves four basic steps:
i) Generate appropriate descriptors for each compound in the dataset ii) Select an appropriate similarity measure
iii) Use an appropriate clustering method to cluster the dataset
iv) Analyze the result. Repeat the clustering process or select only the best clusters.
These four steps will be the methodology used in this project. However, for step (iii), fuzzy clustering has been chosen for this project. The fuzzy clustering method will be based from the fuzzy c-means algorithm. Fuzzy c-means clustering is an extension of classic K-means using the concepts of fuzzy logic and it is the most prominent fuzzy clustering algorithm. It uses Euclidean distance measures to produce spherical clusters and it does not let a cluster change its shape dependent on the data used in the
experiments (Kaymak and Setnes, 2000).
Fuzzy c-means is currently being used in clustering, referring to the work from Feher and Shmidt (2003), Barkó et.al (1999) and Guthke et.al (2002). The fuzzy c-means algorithm has been chosen because of its ability to produce the best clusters by
41
their separation of active/inactive structure and the inter-cluster dissimilarity of the centroids.
START
Initialize the membership matrix
Calculate the degree of membership
Compute the fuzzy centroid and update the new membership.
Recalculate the degree of membership
If the difference of
centroid matrix between no new and previous
iteration < ε
yes
STOP
Figure 3.1: Flowchart for fuzzy clustering algorithm
3.1 DATASET
42
tested based on the clusters ability to separate actives and inactives compound into different set of clusters. It will also be tested for its effectiveness based on their inter-cluster dissimilarity by using the Tanimoto measures.
In the AIDS dataset, there are 5772 molecules and they are categorized as confirmed active (CA), confirmed moderately active (CM) or confirmed inactive (CI) in each group and molecules. There 247 molecules of CA, 802 molecules that are CM and 4723 CI molecules. However, for this project, only 1000 molecules are tested and analyzed, where it consist of 247 of actives molecules (CA) and 753 inactive molecules (CI).
3.2 GENERATION OF DESCRIPTORS
43
3.3 SELECTION OF SIMILARITY MEASURE
For similarity measures, we will calculate the distance matrix that choose a subset of the compound space which consist only compounds which have sufficient number of close neighbors. This is obtained based on the descriptor chosen in the earlier step. The similarity measures often used in calculation of similarity between chemical compounds are Euclidean measures, Tanimoto measures and Cosine measures. The similarity measure chosen is the Euclidean distance, which is based on the triangle inequality. Euclidean measure is chosen because it shows that it was best used in fuzzy clustering based on studies from Feher and Shmidt (2003).
Euclidean distances are usually computed from raw data and the advantage of this method is that the distance between any two object is not affected if we add new objects (such as outliers) into the analysis. The similarity measures using Euclidean distance is measured based on inter-point distance d(x1,x2) and the equations for binary
descriptor is as follows:
d(x,x2) = 1 -
(
a + b – 2c ……….(3.1))
n
where
a: the number of unique fragments in compound A
b: the number of unique fragments in compound B c: the number of unique fragments shared by compounds A and B
n: the number of fragments in the compounds
44
3.4 THE IMPLEMENTATION OF FUZZY CLUSTERING
The third step of clustering using fuzzy clustering is implementing the fuzzy clustering itself. The fuzzy algorithm that will be used is the fuzzy c-means. The first stage of fuzzy c-means is initialing the centroid for each cluster. The primary centroid Ĉi
is chosen randomly, depending on the number of clusters defined in each clustering process. The centroid is then used to compute the degree of membership depend on the definition or input of the distance measure. The calculation of the degree of membership (uij) from centroid i to compound j in the clusters is derived from the equation (Fung,
2001): 1 1 uij where 2
d ( X =
2
d ( X
(
j C i )
q-1)
1 1 (
j C k ) q -1 )
………… (3.2)
d2(Xj,Ci): any inner product metric or the distance measure q:
fuzziness index
k: number of cluster
The value of fuzziness index (q) is used mostly in the range of 1.0 to 2.0, however there are other studies that used fuzziness index values up to 5.0. The q value has a large impact on the cluster because when a q value is too low, it will not effectively handle noise in the data and if the value is too high, it will produced very poorly
separated clusters (Rodgers, 2004). For this experiment, the q value in range of 1.1 to 2.0 is tested.
From the membership matrix, we will derive the fuzzy centroid (Ĉi) from the
45
^
C j
where
M
∑ ( u ij ) q X j
j = 1 ………… (3.3)
= M
∑ ( u ij) q j = 1
uij: degree of membership q:
fuzziness index
Xj: the data point of the jth compound M:
number of data point
Then, the difference between the centroid matrixes will be calculated based on the distance between the centroids as in 3.4. This process is repeated until the difference reached the predetermined value (ε). This termination criterion (ε) is usually set to 0.01 (Rodgers, 2004).
∑ i
(C jcurrent - C jprevious ) < ε ………… (3.4)
^ ^
This will resulted in minimizing the cost-function. The cost-function (J) equation is as follows (Fung, 2001):
J q (U , C) =
∑
∑
(uij )q d 2( Xj,Ci ); K M ………… (3.5)
= M
j1 =
K
i 1
≤
where
U: a fuzzy K-partition of the data set C: a set o K prototypes (cluster center) M: number of data point
k: number of cluster
uij: degree of membership q:
46
Xj: the data point of the jth compo und Ci: the centroid of the ith cluster
d2(Xj,Ci): any inner product metric or the distance measure
The parameter q is the weighting exponent for uij and it controls the fuzziness of
the resulting data. It is always any number greater than 1 and from studies by Feher and Shmidt (2003) and Barkó et.al, (2003), the fuzziness index is always set to
2. However, for this project, the fuzziness index will be experim ented in the range of 1 .1 to 2.0. The algorithm for fuzzy c-means is as in Figure 3.2.
START
1- Select the parameters values: k: cluster number q: fuzziness index
ε: threshold value
1- Select randomly any value according to the k value as the initialized centroids for each cluster.
2- Initialize the centroid matrix with the cluster seed, where axis-x is the centroid value and axis-y is the number of cluster.
2.1- Calculate the Euclidean distance for the centroid matrix using Equation 3.2.
3- Calculate the membership degree using Equation 3.2 4- Calculate the cluster centroid by using Equation 3.3
4.1- The difference between the centroid matrix is calculated (Equation 3.4) if difference >ε
update the centroid for each cluster repeat from step 2
else
Stop iteration
5- Calculate the cost-function using Equation 3.5.
END
47
3.4.1 WARD’S ALGORITHM
Ward’s clustering method is implemented by reducing the number of clusters one at a time starting from one cluster per compound and ending which one cluster c
omprises all the compounds. At each cluster reduction, the method merges the two clusters and this will gives the result of the smallest increase in the total sum of squares of the distances of each point to its cluster centroid. T hus, the Ward’ s algorithm forms clusters by selecting a clusters that minimizes the within cluster sum
of squares or the error sum of the squares (ESS).
n n
ESSk =
∑
xik2 - 1(∑
xik)2 ………… (3.6)I=1 n i=1
where:
xik: the attribute value of molecule i in cluster k
n: size of cluster
The ESS values will be summed together as in:
K
E =
∑
ESSk ………… (3.7) k=1where:
K: the number of cluster