CLASSIFICATION OF SEAFLOOR HABITATS USING ACOUSTIC BACKSCATTERING OF MULTIBEAM ECHOSOUNDER SYSTEMS
Mohd Razali Mahmud and Mohamad Kelana Juwit
Hydrographic Research and Training Office Department of Geomatic Engineering Faculty of Geoinformation Science and Engineering
Universiti Teknologi Malaysia Skudai, Johor
MALAYSIA
E-mail: [email protected], [email protected]
Abstract
Recognition of the superior data and coverage from multibeam echosounder systems has been widespread and is increasing rapidly. These systems are currently the most advanced and efficient tool for remote observations and characterization of the seafloor. Modern, high resolution multibeam echosounder systems are capable of mapping acoustic backscattering strength coinciding with fine bathymetry, which improves substantially the capability of sonar to discriminate different types of seafloor habitats. Acoustic backscatter strength is highly dependent on incident angle due to different mechanisms of scattering within different angular domains. This study involves correction of the backscatter images to make them independent of incident angle using CMST MB Toolbox software to enable further segmentation and classification of the areas on the seafloor acoustically observed along multiple overlapping multibeam echosounder systems swath tracks. A set of bathymetry and acoustic backscattering data has been collected using 200 kHz RESON SeaBat 8124 multibeam echosounder. The ground truth data are also collected in a number of locations on the study area using grab samples of sediments to compare the unsupervised classification and statistical distribution of the backscattering energy attempts. The results were analyzed using error matrix statistical measures that provided a quantitative assessment of the classification results. Preliminary conclusions are made in this study with regard to the efficiency of seafloor classification using high resolution multibeam sonar systems.
Keywords : acoustic backscattering, seafloor classification
1.0 INTRODUCTION
2.0 MULTIBEAM SONAR SYSTEM BACKSCATTER
While designed primarily for bathymetric profiling, multibeam sonar systems have the potential to produce backscatter imagery of acceptable quality for seabed interpretation. Currently, there are three approaches to logging acoustic backscatter with a multibeam sonar systems (Hughes Clarke, 1998) :
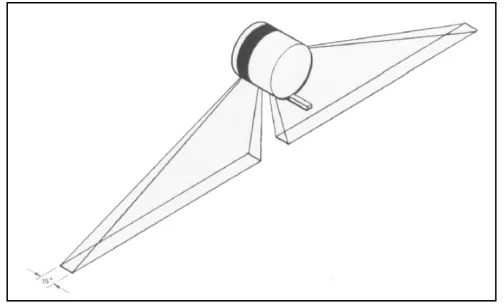
(1) Form two additional wide angle receive beams to port and starboard that log a sidescan-like time series of intensities (see Figure 1)
(2) Log a single backscatter value with each beam, either taken as the maximum intensity at bottom detect or an average intensity centred on the bottom detect in the time series
(3) Log a series of intensities with each beam again centred on the bottom detect
Figure 1: Sidescan Beam Geometry Form Two Additional Wide Angle Receive Beams (Beaudoin, J.D et al, 2002)
The first approach is limited since the backscatter information is divorced completely from the bathymetric profile provided by the same solutions. A flat seafloor assumption could be used to slant range correct the data, however, it is preferable to use the simultaneously collected bathymetric profile. This is the fairly robust method, yet it requires additional post-processing. The second method improves upon the first since the intensity is logged for each beam and can be directly geo-referenced using the positioned beam footprint. The drawback of this approach is that potentially useful spatial information is discarded in the process of reducing the backscatter time-series surrounding the bottom detect of each beam to a single value. The third technique overcomes the weaknesses of the first two methods in that:
(1) the individual time series are directly associated with a portion of the bathymetric profile and are therefore much easier to correct for slant-range
(2) it allows for across-track resolution of seafloor features with spatial frequencies higher than the beam spacing since a portion of the time series is preserved for each beam
(3) common slant-range is restricted to the dimension of a single beam
In general, the advantages of the backscatter information derive from:
(1) precise co-registration of the backscatter with the multibeam bathymetry data set (2) improved signal-to-noise compared to conventional imaging sonar
2.1 Multibeam Backscatter Sampling
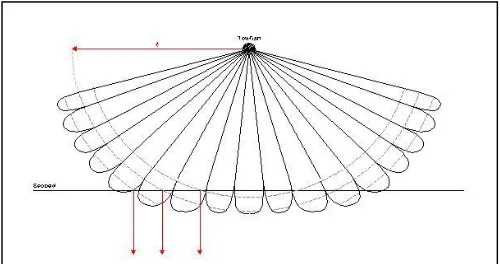
Side scan sonar data are acquired by forming a large beam on either side of the towfish. Time series data are sampled across these beams by summing all of the returns from any giving time into one pixel. Some multibeam systems have emulated this data through digital beam forming, referring to the resultant image as “pseudo side scan sonar”. An example of pseudo side scan imagery is presented in Figure 2. The diagram graphically illustrates the single fan-shaped beam pattern with the broad time-arcs that sum into each time sample. Pseudo side scan imagery is derived from sampling across the full width of the transmit beam at each time interval “t” indicated by the horizontal arrow. The vertical arrows indicate data output for each time interval to the waterfall display.
Figure 2: Derivation of Pseudo Side Scan Sonar Imagery (Doug Lockhart et al, 2001)
Multibeam backscatter is acquired by sampling an individual time series for each beam in the system. Sampling only occurs in the region of the bottom detect rather than throughout the water column (time-arc). An example of multibeam backscatter imagery is presented in Figure 3. Multiple beams may have samples acquired at the same time due to seafloor relief. However, those samples will be only assigned as backscatter returns for their respective individual beam footprint. As a result, the signal-to-noise ratio of the backscatter record is greatly improved. Multibeam backscatter imagery is derived from sampling across the narrow width of each received beam at each time interval “t” indicated by the horizontal arrow. The vertical arrows indicate data output for each time interval to the waterfall display.
2.2 Angular Dependence of Multibeam Backscatter
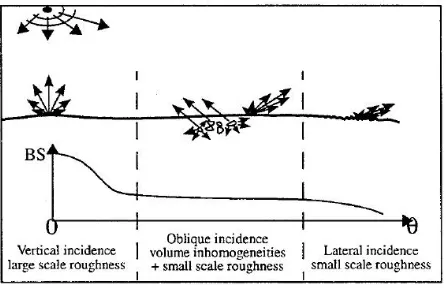
Acoustic backscatter strength is highly dependent on incident angle due to different mechanisms of scattering within different angular domains, which basically are near nadir (typically from 0 to 10), moderate (20 - 40) and oblique (>50) angles of incidence. At near-nadir angles, specular backscattering dominates the contribution of backscattering from the small-scale roughness of the seafloor surface and from volume inhomogeneities in the sediment.
At vertical incidence, a strong reflectivity due to backscattered and specularly reflected echoes by the interface roughness is usually observed. Then part of the incident energy is transmitted into the sediment and is scattered by inhomogeneities in the volume, while backscattered energy still prevails. Beyond a critical angle, no penetration is possible and only interface backscattering subsists. In addition to a stronger backscatter return at vertical incidence (near-nadir angles), the angular dependence of backscatter strength also appears in larger variations near the nadir, which makes the backscatter images much noisier in the inner part of swath track. It is to be noted that in order to compensate for a great differences in the backscattered levels between near vertical and lateral incidence, a decimal logarithm transformation is applied. We wish to exploit this dependence to remotely characterize seabed, but this sole information is insufficient in itself.
Figure 4: Reflected Energy
3.0 DATA ACQUISITION AND HANDLING
3.1 Survey Area
The survey area were approximately 68257 m2 covering the area of Straits of Johore near the Marine Department Jetty Base at Lido Beach, Johor Bahru. The survey area was determined by referring to published nautical chart from Royal Malaysian Navy (RMN) for which is suitable. Hydrographic survey was done from 1st March 2008 to 4th March 2008 using RESON SeaBat 8124 MBES System on board PG Marine 19 boat.
3.2 Instrumentation
RESON SeaBat 8124 is specially designed for harbour and river surveys, the SeaBat 8124 are ideal for condition and pay quantity surveys in support of dredging operations. Operating at 200 kHz, the MBES successfully penetrates the suspended material inherent in dredging operations to accuracy measure a profile of the bottom that is 3.5 times the measured water depth.
Table 1: RESON SeaBat 8124 MBES Specifications
Operating Frequency 200 kHz
Swath Coverage 120 (3.5 X Water Depth) Beam Width, Along Track 2.5 *
Beam Width, Across Track 3.0 * Number of Horizontals Beam 81
Range Resolution 1cm
Maximum Ping Rate 40 ping s-1
* Can be configured as a 1.5 x 1.5 system with Option 064
Table 2: RESON SeaBat 8124 Setting Used for Survey
Ping Rate 39 ping s-1 *
Transmit Power 14 *
Pulse Length 45 s
Receiver Gain 15
Gain Mode TVG
Auto Gain off
* Subject to change in depth
3.3 Ground Truth Data
The nature of the seafloor at the survey area is to be obtained in this study to provide ground truth and confirmation of seafloor classification models. In addition, the nature of the seafloor is to be obtained at regular intervals throughout the survey ground. The frequency of sampling will vary, depending on the depth and the extent to which it is homogeneous, with samples obtained at intervals of between 1.0 and 1.7 km in depth less than 200m. The correlation between samples and the texture derived from the sonar record is very important; it provides the only real confidence check on the interpretation. To fulfil these requirements, samples have been taken using grab sampler along the swath track at survey area with 500 m intervals. The position of the grab sample location has been taken by Trimble DGPS with the help of DGPS Radio Beacon Correction from base reference station at Singapore. This DGPS system is the same equipment for line control and sonar positioning purposes.
3.4 Processing of Multibeam Sonar Data
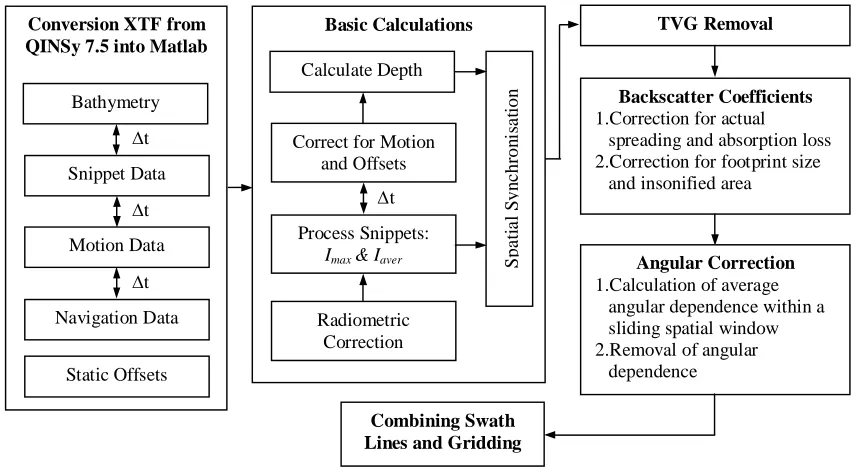
In this study, QINSy software was used for survey planning and data acquisition. While, for processing of MBES data are using computer programs that have been developed by the Centre for Marine Science and Technology, Curtin University of Technology called CMST MB Toolbox. The algorithms developed for MBES data processing were implemented in Matlab, which allowed us to create a platform-independent software package. The current version of the CMST MB Toolbox is universal with respect to processing of multibeam sonar data from all existing MBES that are capable of collecting snippet (backscatter waveform) data and exporting all data in the eXtended Triton Format (XTF) binary data files.
motion and navigation data, from XTF binary data files into Matlab data files. The second, major component contains the programs and functions that process multibeam sonar data to calculate bathymetry and the acoustic backscatter strength of the seafloor over the surveyed area. The programs in third part of the library implement known and enhanced algorithms for segmentation of seafloor properties by acoustic backscatter and bathymetry data. A set of Matlab functions that implement a graphic user interface for program control was also developed in CMST MB Toolbox to simplify operation of all Matlab programs for multibeam sonar data processing. For further processing like gridding, draping and rotating the data are used in another program such as ArcGIS.
Figure 5: Block Diagram of MBES Data Processing Algorithm Using in This Study
4.0 RESULTS
4.1 Angular Dependence Correction
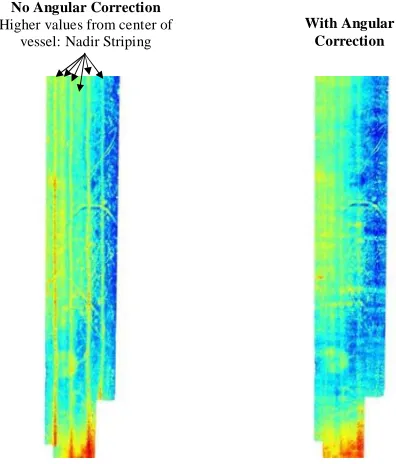
Angular dependence correction is used to perform angle correction for surface scattering coefficient (SSC). This angle dependent correction is needed because of the effect of incident angle variable caused by side lobe of multibeam beamforming. Multibeam backscatter data suffers from signal attenuation due to range, angle of incidence and transducer design. This radiometric correction can largely be removed by the application of Angular Varied Gain (AVG) to a ping data. This correction is needed to reduce the effect of backscatter irregularities especially that caused by nadir effect. The result of this correction will be in Theta-Corr and will be needed to correct surface scattering coefficient to generate compensated SSCE (SSCEcomp).
t
Conversion XTF from QINSy 7.5 into Matlab
Bathymetry Snippet Data Motion Data Navigation Data Static Offsets t t t TVG Removal Backscatter Coefficients
1.Correction for actual spreading and absorption loss 2.Correction for footprint size
and insonified area
Angular Correction
1.Calculation of average angular dependence within a sliding spatial window 2.Removal of angular
dependence
Basic Calculations
Calculate Depth
Correct for Motion and Offsets
Process Snippets:
Imax & Iaver
Figure 6: Backscatter Intensity Image of the Seafloor Build From Four Overlapping Swath Lines, Before Correction for the Angular Dependence (Left Panel) and After (Right Panel)
4.2 Backscatter Distribution Analysis
Backscatter distribution analysis is mainly to determine the linear distribution of certain intensity value for the area. “Probability Density Function” in CMST MB Process is to determine the linear distribution of the plotted data in example bathymetry and/or backscatter data distribution. As been stated in earlier, we have known that backscatter is the best tool to use for seabed classification studies. This is because the measured backscatter amplitude that hits and return from one material will have different intensity value with other material. Therefore we can say that the backscatter intensity value is unique for each type of material. This will enable comparison between the linear distribution of certain intensity value for the selected area and ground truth data to ensure that any correlation between samples and texture derived from the backscatter records.
Figure 7: Area Selected to Be Analyzed (Left Panel) and Histograms of the Selected Area within Black Dash Line (Right Panel)
No Angular Correction Higher values from center of
vessel: Nadir Striping
Figure 8: Selected Distribution of Backscatter Value between -30dB and -35dB Within Vertical Blue Dash Line (Left Panel) and Area with Backscatter Values Falling
Within the Selected Distribution (Right Panel)
4.3 Angular Dependence of Backscatter Strength
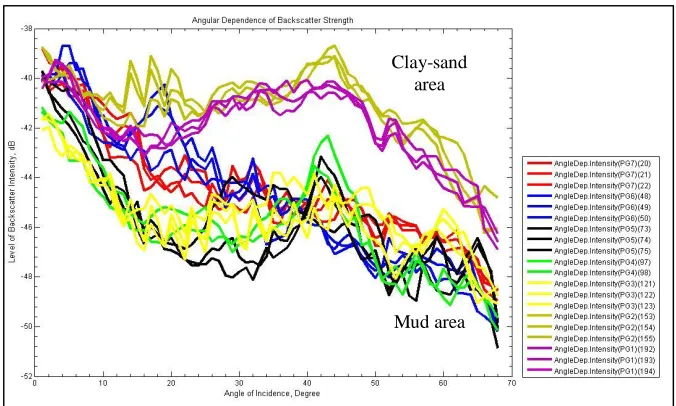
The angular dependence of backscattering strength is an important characteristic that distinguishes different types of the seafloor cover. A part of that, the location for every ground truth sampling was plotted over the backscatter intensity image of the seafloor build from four overlapping swath lines. The backscatter intensity image has been corrected for angular dependence by compensates average value of Surface Scattering Coefficient (SSCEcomp) earlier. The brown colour dots superimposed on the backscatter intensity image show the middle track of the average angular response within a spatial window of a programmed length that slides along the swath line with a 50 per cent overlap (along the track). The angular response was measured in one-degree bin angle of incidence (across the track).
Figure 9: Ground Truth Sampling Plotted Over the Backscatter Intensity Image (Red Colour Dots) and the Middle Track of the Average Angular Response (Brown Colour Dots)
Brekhovskhikh’s theoretical model. It is to be noted that not all of the angular dependence was plotted; only the angle that coincide partially or near the ground truth locations were selected.
Figure 10: Angular Dependence of Backscattering Strength from Clay-sand and Mud Area
4.4 Quantitative Quality Assessment through Error Matrices
Quantitative assessment of the accuracy of the classification by comparing one classification attempt to another was desired. For this reason the use of an error matrix was chosen in order to identify the accuracy of each method of seafloor classification. The error matrices can identify the accuracies of each individual class and a measure of the total accuracy based upon the comparison of the classified values to a reference data set. With the derivation of the error matrix, it is also possible to compute a KHAT value (an estimate of Kappa) for each error matrix, which provides a numerical estimate of the agreement of the classification attempt relative to the reference data.
The KHAT value ranges from -1 to 1, but since there should be a positive correlation between the classification and reference data set, a positive value is expected. Confidence intervals around the KHAT value can be computed and used to determine whether or not a single error matrix is significantly different from a random agreement. Knowing both the KHAT and variance values it is possible to compute a Z-statistic which can be used to compare two different error matrices for statistically significant differences from each other. Using this method it is possible to compare the two different classification methods to see which achieves a closer correspondence to the reference data. By the way, quantitative quality assessment for this study is not done yet.
5.0 CONCLUSIONS
Preliminary results are promising and suggest multibeam system can be effective for mapping seafloor characteristics, but more work needs to be done. It appeared that some of the approaches to MBES seafloor classification developed earlier for older system could not be utilised or should be substantially modified for modern system operating at very high frequencies. Although more work is required, the initial results confirm that MBES offers the greatest potential in characterising and mapping the seafloor. Through further understanding of the operation of the MBES and the physics of acoustic scattering from the seafloor at high frequencies this potential can be realised in much more efficient way.
Clay-sand area
REFERENCES
A. Gavrilov, A.J. Duncan, R.D McCauley, I. Parnum, J.D. Penrose, P.J.W. Siwabessy, A.J. Wood and Y.T. Tseng (2005). Characterisation of the Seafloor in Austalia’s Coastal Zone Using Acoustic Techniques. Proceeding of the Underwater Acoustic Measurement Conference, June 2005. Heraklion, Crete (Greece)
Beaudoin, J.D., Hughes Clarke, J.E., Van Den Ameele and Gardner, J.V. (2002). Geometric and Radiometric Correction of Multibeam Backscatter Derived From Reson 8101 Systems. Proceeding of Canadian Hydrographic Conference 2002. Toronto (Canada)
Doug Lockhart, Edward Saade and Jerry Wilson (2001). New Developments in Multibeam Backscatter Data Collection and Processing. Marine Technology Society Journal, Volume 35, No. 04, Winter 2001/2002. Columbia (USA). p. 46-50
Gerrit Blacquiere and Koos van Woerde (1998). Multibeam Echosounding: Beamforming versus Interferometry. Proceeding of Oceanology International, March 1998 Volume 2. Brighton (UK): 353-356
Hughes Clarke, J.E., Danforth, B.W. and Valentine, P. (1997). Areal Seabed Classification Using Backscatter Angular Response at 95kHz. Proceeding of High Frequency Acoustics in Shallow Water, NATA SACLANT Conference, 30 June – 04 July 1997, Lerici (Italy)
J.D. Penrose, P.J.W. Siwabessy, A. Gavrilov, I. Parnum, L.J. Hamilton, A. Bickers, B. Brooke, D.A. Ryan and P. Kennedy (2005). Acoustic Techniques for Seabed Classification. Cooperative Research Centre for Coastal Zone Estuary and Waterway Management, Technical Report 32, September 2005. Australia
Jerald W. Caruthers (1977). Fundamentals of Marine Acoustics. Elsevier Oceanography Series, 18. Elsevier Scientific Publishing Company,Amsterdam.
John E. Hughes Clarke, Larry A. Mayer and David E. Wells (1996). Shallow-Water Imaging Multibeam Sonars : A New Tool for Investigating Seafloor Processes in the Coastal Zone and on the Continental Shelf. Marine Geophysical Researches, Vol.(18), No.(6)/December 1996. (Netherlands). p. 607-629
Matlab Version 7.2.0.232(R2006a), The Language of Technical Computing, The Mathworks, Inc. (USA)
Parnum I.M., Siwabessy P.J.W and Gavrilov A. (2004). Identification of Seafloor Habitats in Coastal Shelf Waters Using a Multibeam Echosounder. Proceeding of ACOUSTIC 2004, 3-5 November 2004. Gold Coast (Australia)
Paul Kennedy (2005). Multibeam Backscatter Acquisition Processing and Digital Data Deliverables (aka Backscatter Bibles). Internal Technical Note, Fugro Pty. Ltd., July 2005. Osborne Park (Australia)
Reson Inc. (2006). Reson SeaBat 8124/QINSy/Terramodel Training Course. California (United States): UTM Training Course Handout
S.Dugelay, C.Graffigne and JM. Augustin (1996). Segmentation of Multibeam Acoustic Imagery in the Exploration of the Deep Sea-Bottom. 13th International Conference on Pattern Recognition 1996 (ICPR’96) – Volume 2. Vienna, Austria, p.437
The International Hydrographic Organization (2005). Seafloor Classification and Feature Detection. Manual on Hydrography 1st Edition, May 2005. IHO Publication M-13