ABSTRACT
SHETYE, TARA. Differences in Attitudes Towards Time at Work: Validation of the Time Preferences at Work Scale. (Under the direction of Frank J. Smith.)
DIFFERENCES IN ATTITUDES TOWARDS TIME AT WORK: VALIDATION OF THE TIME PREFERENCES AT WORK SCALE
by
TARA SHETYE
A thesis submitted to the Graduate Faculty of North Carolina State University
in partial fulfillment of the requirements for the Degree of
Master of Science
PSYCHOLOGY Raleigh April 2006 APPROVED BY
___________________________ ____________________________
BIOGRAPHY
Ms. Shetye was born on July 25th, 1981, in Buffalo, New York. Ms. Shetye is the daughter of Mohan Shetye, of Maharashtra, India, and Diane Shetye, of Buffalo, NY. Her parents currently reside in Buffalo, with her younger brother, Arun.
Ms. Shetye attended Williamsville North High School in Williamsville, NY. After graduating in 1999, she enrolled in the University of Pittsburgh, where she pursued a B.S. in Psychology. During this time, Ms. Shetye also worked at a local drugstore, which provided her the opportunity to begin exploring her interests in personality and culture in the
workplace. After graduating cum laude in 2003, Ms. Shetye moved to Raleigh, NC, where she is currently pursuing the PhD in Psychology at North Carolina State University.
Ms. Shetye is active in the university community. She is president of the Graduate Association of Students in Psychology, as well as Head of the Committee for Professional Development and Student Representative for the North Carolina I/O Psychologists Network. She is also an Advisor for the Center for Student Leadership, Ethics, and Public Service at NCSU.
Ms. Shetye has taught a variety of undergraduate courses, including Social
Psychology, Industrial/Organizational Psychology, and Research Methods. In 2005, she was recognized as an Outstanding TA by the University Graduate Student Association.
Ms. Shetye has worked on a number of applied research projects, including climate surveys, training evaluations, and leadership assessments. She is currently working as a member of Dr. Lori Foster Thompson’s Electronic Monitoring Lab.
Ms. Shetye was recently married to Daniel J. Behrend, a Teach for America Corps member and 6th grade teacher in Vance County, NC.
ACKNOWLEDGEMENTS
I would first like to thank my committee, Dr. Frank Smith, Dr. Adam Meade, and Dr. Lori Foster Thompson. Each of them was incredibly supportive and encouraging throughout the stages of this project. I am also grateful for their expert advice, whether technical or procedural (or punctuational!), and their patience, flexibility, and confidence in my work. Somewhere around the 37th draft, I imagine the novelty of this project wore thin, but I could always rely on my committee to show me how to move forward. Knowing that their doors were always open to me was very reassuring.
I am appreciative of my fellow graduate students—first, for serving as subject matter experts, a thankless and tedious task. Thanks are due to Aaron Watson, Christy Kroustalis, Jane Vignovic, Reanna Poncheri, Jenn Lindberg, Becca Baker, Emily Johnson, and Penny Koommoo-Welch for their service. I’d also like to thank my officemates and sage givers of advice, Becca Baker and Penny Koommoo-Welch. Their example was invaluable to me. Finally, Emily Johnson helped me to keep the big picture in mind, while keeping my sense of humor and sanity intact.
I am confident that I could not have completed this project without the help of my research assistants. I’d like to thank Tracie Gabelman and Kelly Taylor for their help in the beginning stages of this project. I am extremely grateful to have had the help of Andrew Fox during the data collection stages—without his willingness to handle the madness that is Experimetrix, I would be overwhelmed.
Finally, I’d like to thank my husband Dan. He has always been a source of support and encouragement to me, as well as a willing outlet for my stresses and frustrations. Thank you for celebrating my successes and helping me through the other times.
TABLE OF CONTENTS
LIST OF TABLES ……… vi
LIST OF FIGURES ……….. vii
1. INTRODUCTION ……… 1
a. Time Preferences ……….…… 4
b. Team Composition ……….……. 5
c. Measurement of Time Factors ……….… 8
d. Scale Structure ……… 11
e. Personality Correlates of Time Preferences ………...…… 12
2. METHOD ……….… 14
a. Procedure ……….... 14
b. Measures ……….… 16
c. Analysis ………..… 18
3. RESULTS ………. 20
a. Exploratory Factor Analysis ……….. 20
b. Confirmatory Factor Analysis ……… 21
c. Convergent and Discriminant Validity ……….. 22
d. Summary ……… 25
4. DISCUSSION………... 25
a. Limitations ………. 26
b. Future Research and Theoretical Implications …………...27
c. Practical Implications ……… 28
d. Conclusion ……….… 29
5. REFERENCES ……….…30
6. APPENDICES ………. 35
LIST OF TABLES
Table 1 Comparison of Time Preferences Measures ………. 43
Table 2 Ten Proposed Dimensions of Time Preferences (Brislin & Kim, 2003) ….. 44
Table 3 Proposed Multitrait Matrix ………...……….... 45
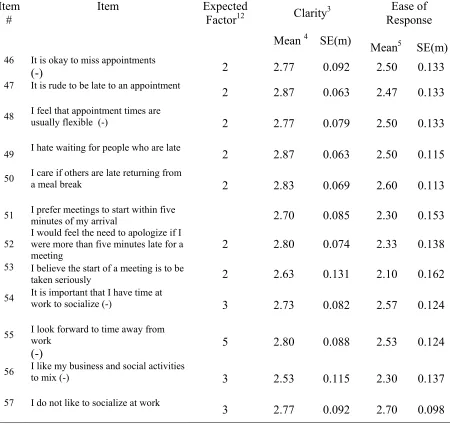
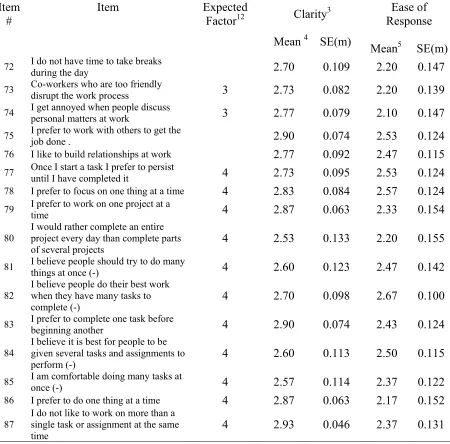
Table 4 Complete Item List with Content Validity Evidence and Clarity and Ease of Response Ratings ………...……….. 46
Table 5 Standardized Factor Loadings ……….. 60
Table 6 List of Discarded Items and Factors ………..…….. 65
Table 7 Fit Indices for Confirmatory Factor Analysis ……..……… 67
Table 8 Factor Correlation Matrix for Six-Factor Model ……….. 68
LIST OF FIGURES
1 Differences in Attitudes Towards Time at Work:
Validation of the Time Preferences at Work Scale
American workers are increasingly being expected to engage in interpersonal interactions with individuals from cultures other than their own. The U.S. Department of Labor predicts that between 1998 and 2008, the U.S. labor force will experience a 40% increase in Asian workers, and a 37% growth in Hispanic workers (U.S. Bureau of Labor Statistics, 2005). Brislin and Cushner (1996) offer several reasons for this phenomenon, including developments in the global marketplace, increases in international tourism, affirmative action policies, and the movements of international students and workers. Technology has also contributed, enabling instant communication with people anywhere on earth. While internationalization has many benefits, cross-cultural interactions can also result in miscommunications, misunderstandings, and frustrations, which hinder work processes (van der Zee, Atsma, & Brodbeck, 2004). The increasing number of workers who find themselves in a “foreign” environment has led to a large effort by industrial and organizational psychologists to alleviate their discomfort and aid in cross-cultural
adjustment, both to improve productivity and to increase employee well-being. The success of any such program, however, depends on a thorough understanding of cultural assumptions and differences.
2 workforce now is such that many employees in large organizations will be expected to have cross-cultural interactions. If training can be improved and enhanced, organizations will be able to offer training to a wider range of employees.
The aspects of culture that are responsible for miscommunication and conflict have gone largely unstudied. Existing training programs appear to be based primarily on a
collection of anecdotes, and attempts to describe cultural phenomena appear too general to be useful. As multicultural interactions among workers are increasing in frequency, creating effective training is becoming vital. To do so, we must first understand the ways in which culture affects workers. Triandis (2003) notes that humans can be diverse on any attribute - including social class, race, national heritage, age, lifestyle, religion, or even political affiliation. It can be said that these characteristics define groups that have a distinct cultures. With this definition, it is easy to see that the workforce is culturally diverse, whether the organization in question is a large multinational conglomerate or a local drugstore. Any organization will be comprised of workers with different values and assumptions, and therefore, any organization can benefit from a greater understanding of the way that culture influences workers. Training opportunities can no longer be exclusive to executives
traveling abroad, or those facilitating multinational mergers. Rather, we must understand cultural differences to include age, place of birth, socio-economic status (SES), ethnicity, and religion.
3 has the ability to know and understand all aspects of culture that may be present in the organization. Often, cultural differences become confused with differences in nationality, with trainers simply teaching trainees that Japanese people do things a certain way, while Americans do things another way. A sample piece of advice from a well-respected training curriculum states, “when dealing with Germans, practice conducting intense discussion… voices may become emotional!” (Brislin &Yoshida, 1994, p. 106). In reality, cultural differences are far more complex. This information does little except provide us with labels for people.
No training program can ever encompass all the ways in which people differ
culturally. Moreover, organizations are often hesitant to devote the weeks it would require to train employees on these skills. Therefore, it is essential to develop a more targeted training approach; one that focuses on the aspects of culture that contribute most to
miscommunications in the workplace.
4 these differences at an individual level. The purpose of this study is to generate an
instrument to measure one specific aspect of culture that is believed to influence work behavior. Subsequent studies can then explore the relationship between this dimension, time preference, and a variety of work outcomes.
Time preferences
The way people organize their time is central to their daily experience. Allen
Bluedorn, in his book The Human Organization of Time, asks, “What is a more fundamental process strategy than the choice of the pattern for one’s activities?”(p. 48) He notes that this choice of strategy is derived from a blend of culture and personality, and results in the storage of time preferences at very deep levels of consciousness. Peoples’ preferred pace of life can significantly affect their decisions regarding daily activities and lifestyle.
Time preferences can affect an employee’s behaviors at work. Frank Landy and his colleagues (Conte, Mathieu, & Landy, 1998; Landy, 1991) found strong relationships
between a person’s time urgency and health and performance outcomes. Polychronicity, or a person’s preference for doing many things at once, has been shown to be important in studies of person-organization fit (Slocombe & Bluedorn, 1999). Polychronicity is also believed to be related to productivity in small or young firms (Schein, 1992). Although these specific facets of time preferences have been examined to some extent, entire areas of this construct have been left unmeasured. Additionally, time variables have been considered only in a simple predictor-criterion model at the individual level of analysis, whereas the effects of such a trait need to be considered as part of a more complex framework.
5 assumption that ethnic or racial diversity (surface-level characteristics) will necessarily play a large role in a team’s ability to work together. A larger focus should be placed on
alleviating the effects of deep-level differences, or those that directly affect the team’s ability to work together. The organization and structure of psychological time is a deep-level
characteristic, and one that has been only minimally addressed in the literature.
Understanding the value of time preferences is expected to have important implications, especially for team composition.
Team Composition
Work teams have been touted as the solution to many work-related problems. The workforce is seeing a dramatic increase in the use of team-based organizational structures, as organizations realize that traditional structures are inadequate in meeting their increased communication needs (Mohrman, Cohen, & Mohrman, 1995). However, teams rarely meet their potential with regard to increased productivity, increased innovation, or higher
satisfaction. Rather, teams are often stricken with high degrees of conflict,
miscommunication, and discontent (Campion, Medsker, & Higgs, 1993; Guzzo & Dickson, 1996). The reasons behind these problems are still largely unknown, despite the efforts of numerous researchers in the areas of team performance.
6 preferences individuals hold influence their contribution to the team’s outcomes. An enormous amount of energy has been devoted to examining the effects of cultural diversity on the performance of work teams (Guzzo & Dickson, 1996; Paletz et al., 2004; Timmerman 2000). However, one conspicuous gap in this literature is that there is yet no credible
explanation for these effects. The bulk of team diversity research has focused on the effects of diversity (i.e., lower productivity, lower satisfaction), rather than the root causes of
conflict that lead to decreased performance (Kirkman, Tesluk, & Rosen, 2004). Kirkman and others have advocated for increased understanding of the aspects of culture that may cause problems in teams. One aspect of culture that may detract from a team’s ability to work together is differences with respect to the perception of time, such as differences in work pace and flexibility.
Many field studies have found that diverse teams suffer decreased performance. Polzer, Milton, and Swann (2002) note that diversity can serve as a “double-edged sword” to team effectiveness, increasing performance on some tasks and decreasing performance for others. Polzer et al. (2002) found that cultural diversity increased creative task performance, but only when interpersonal congruence was high, meaning that team members were only able to perform well when they viewed other team members as similar to themselves. Similarly, Thomas (1999) found that cultural diversity in work teams had a negative impact on effectiveness for several tasks. Cultural diversity also seems to decrease workers’
7 performance of complex tasks, due to groupthink. These studies demonstrate that teams often have more difficulties when cultural diversity creates conflict with those who are different.
While nationality is often an easy way to categorize people, it is not optimal for describing differences between people. It serves as a proxy for cultural traits, which may not be clearly defined by national boundaries. Cultural differences may be the result of
nationality, but could also be due to SES or other demographic differences. Researchers studying diverse teams have reported widely discrepant results, which may be due to the large amount of within-country variation. One example is the contrast between efficiency-centered individuals, who value speed, and effectiveness-efficiency-centered individuals, who value quality. This value differs even within “Western” cultures (which are generally regarded as efficiency seeking), and within national, regional, and local cultures as well. Jehn, Northcraft, and Neale (1999) found that value diversity decreased satisfaction with the group, intent to remain, and commitment to the group. In this study, value diversity was defined as
differences with respect to the way people think about the group’s target, mission or purpose, and included disagreements about effectiveness vs. efficiency. This study represented a shift from thinking about values purely as a cultural attribute. Instead, specific individual
differences that could be hypothesized to impact team effectiveness were chosen. While differences in values can be one possible source of conflict in culturally diverse teams, it is not the only source. Decreased or poor communication patterns also contribute to poor performance in culturally diverse teams. Hill (1982) found that the increased process loss suffered by diverse teams was due to differing communication
8 Jarvenpaa and Leidner (1999) found that in virtual teams, the inability to communicate impacted team members’ levels of trust for each other, which then affected their effectiveness. These studies highlight the importance of communication in teams. It is possible that poor communication patterns arise from differences in people’s understanding of time. A valid instrument is needed with which to test this possibility.
Time and change are fundamental aspects of small group processes (Arrow, Poole, Henry, Wheelan, & Moreland, 2004). Time serves both as a context and a resource for work groups. In fact, teams are often implemented precisely because of time-related issues (i.e., increased speed; Mohrman et al., 1995). While the understanding of time is certainly socially constructed, it is inaccurate to assume that members share a common construction. National culture does seem to influence a person’s understanding of time to a certain extent (Levine, 1997). Therefore, it follows that many negative effects of cultural diversity in teams may be the result of differences in time preferences.
Measurement of Time Factors
Existing measurement of time preferences covers a broad range of factors. These measures are presented in Table 1. At the most general level, Levine describes the pace of life as a national cultural variable (1997), or as a characteristic of cities (1999). Pace of life is defined as the speed with which individuals live their lives, operationalized as walking speed, clock accuracy, or service speed at a bank. While we can make intuitive comparisons
between the U.S. and Brazil, or New York City and Montana, this is not a precise method of evaluating differences in individual time factors.
9 and Boyd (1999) developed the Zimbardo Time Perspective Inventory, which measures one’s tendency to place a frame of reference in the future, past, or present. However, these scales address only one dimension of time preferences. Additionally, they are very general, and address all aspects of a person’s lifestyle choices. Therefore, a comprehensive work-specific measure is needed.
Schriber and Gutek (1987) described time dimensions of organizational culture, finding 13 reliable factors in a sample of United States organizations. This instrument did not attempt to measure individual preferences, but rather focused on norms. It is unclear whether these factors can be observed on an individual level. Additionally, the factors they found were limited, in that they were extracted from highly similar organizations. As a result, major omissions existed with regard to the domain of the instrument. Perhaps the most important omission was any assessment of polychronicity, a dimension that has been shown to be important for studies of person-organization fit (Slocombe & Bluedorn, 2001).
Another similar technique was employed by Ballard and Seibold (2004) in their Organizational Temporality Scale. The intent of this scale was to describe the ways in which temporality plays a role in workgroups. Respondents were asked to think about “the way work is done around here,” rather than describe their preferred style. While this information might be useful in determining some performance outcomes, it cannot be assumed that peoples’ responses reflect their preferred way of organizing their time.
10 urgency using a behaviorally-anchored rating scale. The dimensions, time awareness, scheduling, list making, eating behavior, and deadline control, were shown to influence job performance ratings (Conte et al., 1998). Time urgency in this sense is considered a
behavioral pattern, rather than a value or preference.
Additionally, the Inventory of Polychronic Values, while intended as an
organizational-level measure, was adapted to individual preferences as well (Bluedorn, Kalliath, Strube, & Martin, 1999). This instrument, while focusing on polychronicity (the tendency to have more than one project or event taking place at once), claims to assess the most “basic” dimension of time preferences, with the implication being that any other dimensions are subsumed. However, no empirical evidence exists to support this notion, as other dimensions of time preference were not assessed.
Alternative methods of assessing time perspective include direct observation, as Waller, Giambatista, and Zellmer-Bruhn (1998) chose to do. They measured the frequency of time-related behaviors, such as verbal announcements, clock-checking, etc. This method is more appropriate than self-report if the criterion of interest is actual behavior, as in
assessments of time urgency. However, behavior can be restricted by any number of
organizational or team norms and thus may not be indicative of individual time preferences or values. Additionally, clock-checking represents only one facet of time, while current instruments and theory support a multidimensional structure (Brislin & Kim, 2003; Schriber & Gutek, 1987).
11 (on organizational or national levels) are homogeneous in their preferences, or that norms fully dictate one’s preferences. Disagreements regarding the underlying structure of time preference exist and cannot be resolved if instruments are inadequate. The broad impetus for this research is to allow for the examination of the extent to which acculturation and
individual variation play a role in determining an individual’s preferred experience of time at work, as well as explore the possibility that substantial within-group differences exist. It is likely that the current measurement instruments omit substantial portions of the domain of interest, making accurate inferences impossible. Therefore, the current study proposes to devise an instrument that will evaluate work time preferences in a broad sense, while integrating prior work in this area.
Scale Structure
Items for the current instrument were created using anecdotal evidence from Bluedorn (2002) and Levine (1997), and existing theory of time preference dimensions (Brislin & Kim 2003; Levine 1997). Two primary factors (flexibility and pace), as described by Brislin and Kim, were addressed in the generation of items. The first is flexibility, or the tendency to follow one event to its natural conclusion before moving on versus the tendency to follow a strict timed schedule (i.e., do people control their schedule, or does their schedule control them?; Levine, 1997). The second is pace, or the importance placed on watches, deadline pressure, and achievement orientation.
Each factor is theorized (Brislin & Kim, 2003) to have five related subscales. For flexibility, these subscales are clock/event time, punctuality, task/social time at work,
12 efficiency/effectiveness. See Table 2 for a definition of each hypothesized subscale. If an existing instrument contains a scale that overlaps with one of the current proposed
dimensions, the items from the existing instrument will be modified as appropriate to reflect individual preferences at work. Based on this previous work, I propose the following:
Hypothesis 1: Individual time preferences will be expressed in ten dimensions. Personality Correlates of Time Preferences
Several subscales of Big Five personality traits are expected to show positive correlations with various dimensions of time preferences. The expected pattern of these relationships is presented in Table 3, and detailed below.
Extraversion. Two subscales of extraversion are expected to correlate with measures of time preferences. Activity level is defined as leading a busy life, moving quickly and energetically. Individuals low in activity prefer a more leisurely, relaxed pace. Activity level is hypothesized to correlate positively with pace. Friendliness is defined as genuinely liking other people and openly demonstrating positive feelings toward others (Goldberg, 1999). People high in friendliness value social relationships. Therefore, it is expected that people high in friendliness will score high in valuing social time at work (Task/Social Time) as well.
Neuroticism. Several facets of Neuroticism are expected to correlate with measures of time preferences. Immoderation is a facet of Neuroticism that describes individuals’
tendencies to be susceptible to cravings and urges. In other words, a high immoderation score indicates the inability to consider long-term goals. This facet should correlate strongly with Past/Future Perspective. Self-Consciousness is a facet that describes people’s ease of
13 also be prone to interpreting prolonged silence during interpersonal interaction as a negative sign, which is a characteristic of the proposed Silence subscale.
Conscientiousness. Facets of conscientiousness include orderliness, achievement striving, self-discipline, and cautiousness. Each of these facets has commonalities with aspects of time preference. Orderly individuals like deadlines, schedules, and routines. This facet is expected to correspond strongly with scores on the Clock/Event scale. High
Achievement-Striving individuals have a strong sense of direction and are hard-working. This facet is expected to relate to a person’s preferences with regard to Work/Leisure ratio
(portion of year spent at work rather than engaging in other activities), as well as Task/Social ratio (portion of work day spent “on task” rather than socializing). Self-Discipline is the ability to persist with difficult or unpleasant tasks until they are completed. This is expected to relate to a person’s preferences with regard to monochronic workloads. Cautious
individuals take their time when making decisions. Low cautiousness individuals often do the first thing that comes to mind without deliberating alternatives or consequences. This facet may be related to people’s preferences with regard to Efficiency/Effectiveness.
Cognitive Ability. Cognitive ability is not expected to relate to time preferences. This will serve as a discriminant measure.
14 Lastly, certain demographic variables that may influence time perception will be assessed. If national culture relates to time perception scores, evidence for environmental influence will be provided. Levine and Norenzayan (1999) demonstrated that individuals from cities in the Northeast were faster-paced compared to cities in the South, and overall, urban areas were faster-paced than rural areas. This potential relationship will be explored in the current study.
Socio-economic status (SES) is another background variable that may have a relationship with time preferences. For instance, Zimbardo and Boyd (1999) found that relatively more wealthy people were higher in future time perspective. Possible links exist between SES and other dimensions of time preferences, as well. For example, individuals with high-paying jobs may learn to equate time with money, which is a characteristic of Value of Time preferences. This relationship will be explored in the current study.
Research Question 1: How do time preferences relate to a variety of personality, value, and demographic variables?
Method Procedure
One hundred eighty-six items were written using theory from Brislin and Kim (2003). As existing theory provides a rich description of the expected dimensions, additional sources were used only to supplement existing material. Item generation was completed by the
researcher with the help of two research assistants. The research assistants were told to model the form and reading level of the items after existing measures, and draw content from
15 Stage 1: Content Validity Assessment. Eight subject matter experts (SMEs; graduate students contacted via email) were provided with a printed form containing each item and a definition of each dimension of time as described by Brislin and Kim (2003). Four SMEs were presented with items intended to describe the Pace facets, and four were presented with Flexibility items. The SMEs were asked to read each item and select the dimension with which it appeared to be most closely associated. A “none” option was also available for each item. They were also asked to indicate how strongly they felt about their choices (1 = “not sure,” 2 = “somewhat sure,” and 3 = “very sure”), to discourage guessing. If the SME was unsure about their rating, as indicated by a sureness value of 1, the category assignment for that item was disregarded. This information was used to assess the content appropriateness of the items. If an item had at least 75% agreement as to its appropriate factor, it was retained. Items that were judged by more than one expert to describe several dimensions, or no dimension, were eliminated from the pool. One hundred thirty items were retained after this stage of the study. A complete listing of retained items is presented in Table 4.
16 Stage 3: Construct Validity. Participants for this stage of the validation effort were undergraduate students who volunteered to participate in order to receive class credit, as well as other undergraduate and graduate students who were willing to volunteer. Announcements were sent to the presidents of international student groups in the fall of 2005 in order to solicit volunteers. For those participants who did not receive class credit, a $50 lottery was offered as a participation incentive. Only students who currently held a part-time or full-time job were eligible. A total of 601 employed students participated in this stage of the data collection. The mean age of the respondents was 18.9. Approximately 41% of the sample was male. With regard to ethnicity, 78.3% of the sample was Caucasian, 10.0% was African-American, 2.1% was Hispanic, 6.8% was Asian/Indian, 1% was Native African-American, and 1.2% selected “other.” An attempt was made to gain participation from as many international students as possible. However, only 4.6% of the sample most strongly identified with a country other than the U.S.
Participants were directed to a website, where they were asked to fill out a 236-item questionnaire containing the complete list of retained Time Preferences items, selected personality measures, and background questions. They were asked to indicate their
agreement or disagreement with each Time Preferences item on a 5-point Likert scale (with anchors “strongly disagree,” “disagree,” “neutral,” “agree,” and “strongly agree”) based on the way they usually feel with regard to the item. Background questions included age, gender, nationality, racial/ethnic background, parent’s education, major, and GPA. Measures
17 Personality. Big Five personality traits were measured with ten-item scales taken from the International Personality Item Pool (IPIP; Goldberg, 1999). Each of the facets used in the current study is a subset of either Extraversion (E), Neuroticism (N), or
Conscientiousness (C). Agreeableness and Openness to Experience, the fourth and fifth factors, were not included, as no clear theoretical link existed between these factors and time preferences. The included facets were Activity level (E), Friendliness (E), Immoderation (N), Self-Consciousness (N), Orderliness (N), Achievement-Striving (N), Self-Discipline (N), and Cautiousness (N). Each item was measured using a five point Likert-type response scale with anchors “strongly disagree,” “disagree,” “neither agree nor disagree,” “agree,” and “strongly agree.” A complete list of personality items is presented in Appendix A.
Collectivism (Wagner, 1995). Collectivism was assessed with an eight-item scale developed by Wagner (1995). Sample items include “I prefer to work with others in a group rather than working alone” and “Winning is everything.” These items were measured with a 5-point Likert-type (strongly disagree-strongly agree) response scale as well.
Cognitive Ability. Grade point average (GPA) was used as a proxy measure of cognitive ability. Respondents were asked to choose GPA-point range, in increments of .25, that corresponded to their cumulative GPA.
Socio-economic status (SES). SES was assessed with a two-item proxy measure: “What is the highest level of education you have attained or plan to attain?” and “What is the highest level of education attained by your parents?” These items are similar to items used on the U.S. Census, although they were modified slightly in order to ensure their
18 for these items were: High School, Two-Year Degree, Four-Year Degree,
Graduate/Professional Degree, or Other.
Background. Several demographic variables were assessed. Participants were asked to indicate their age, gender, ethnicity, and nationality. For participants who indicated that they were from the U.S., two follow-up questions were administered: “Please indicate the region in which you spent the greatest amount of time growing up,” with response options including Northeast, Southeast, South, Southwest, Pacific, Midwest, Rocky Mountains, or Other. The second question was “Did you grow up in a mostly urban, mostly suburban, or mostly rural setting?”
Analysis
Data analysis was conducted in three stages. Prior to data analysis, items were reverse-scored where appropriate. The data were also visually examined for suspect cases (based on illogical open-ended responses or inconsistent responses to Likert-type items— e.g., responding with “strongly agree” for every item) and completeness. After removing these 20 cases, 581 remained.
Two random samples, each consisting of approximately 50% of the cases, were then generated using SPSS. The first sample of 283 was used in an exploratory factor analysis, and the second sample was retained for a confirmatory factor analysis. This step was taken in order to ensure that the exploratory analysis did not capitalize on chance characteristics of the sample.
19 expected that the factors would correlate with one another, based on limited evidence that certain aspects of time preferences are related (Bond & Feather, 1988; Schriber & Gutek, 1987). Therefore, an oblique (Promax) rotation was used to determine the most suitable factor structure. Items that had standardized loadings above .4 on any single factor only were retained. Items that cross-loaded (i.e., had loadings above .4 on more than one factor), or failed to load on any factor, were discarded. The items making up each factor were then examined to determine the nature of the underlying construct. In cases when no theoretically meaningful construct could be determined, the factor was discarded.
The second stage of the analysis involved conducting confirmatory factor analysis (CFA) using the second sample (n = 298). The SAS system’s CALIS procedure was used for this step of the analysis. Several models were tested. In the first model, only items that loaded above .50 in the exploratory analysis were included. Further, highly redundant items in these factors were eliminated, so the factor would not be unduly overrepresented by these items. The second CFA model tested followed Brislin and Kim’s (2003) predicted structure (i.e., ten factors: see Table 2). Finally, a two factor model was tested, in which Pace and Flexibility were considered. This model was tested based on Brislin and Kim’s (2003) implication that Pace and Flexibility comprise two broad constructs, each consisting of five subcategories.
20 Results
Exploratory Factor Analysis
For the first stage of the analysis, the scree plot of the EFA was examined to determine the number of factors that should be extracted. The scree plot had a distinct curvature at the tenth factor (see Figure 1). Therefore, the number of factors was set at nine, and the analysis was re-run. The Promax rotation resulted in an uninterpretable solution such that the first several factors contained an extremely broad mixture of items from different categories. The analysis was re-run using an orthogonal (Varimax) rotation, which yielded a much better result. The factor loadings are presented in Table 5. The resulting solution explained 32.8% of the variance in the items. Due to the large number of items included in this analysis, and the diversity of constructs represented, the percentage of variance explained was fairly low when compared with more specific, smaller scales.
At this point, the factors were examined for meaningfulness. Factors 7, 8, and 9 were discarded based on the fact that they did not contribute significantly to the explained variance of the model. Further, the items that made up these factors did not have loadings above .5. Therefore, it was determined that these factors could be discarded without further
investigation.
21 Schedules & Punctuality ( 20 items, α = .89) reflects a person’s attitudes toward maintaining a strict clock-based schedule, including being in a place at the exact time specified. Monochronicity ( 6 items, α = .86) reflects a person’s preference for finishing one task before beginning another, and can also be conceptualized as a preference for linear time compared to cyclical time. Task/Social Time (10 items, α = .91) reflects a person’s preferred ratio of time spent socializing to time on task while at work. Value of Time (4 items, α = .85) reflects a person’s tendency to think of time as a tangible resource that can be wasted.
Work/Leisure Time (5 items, α = .87) reflects a person’s preferred ratio of time spent at work or doing work compared to time spent with family or friends, or engaged in other activities. Pace (5 items, α = .84) reflects a person’s preferred speed at work. The remaining three factors did not have any discernable meaning, and were discarded (see Table 6).
Confirmatory Factor Analysis
22 For the second model, forty-six items that were judged by the researcher to best describe each factor were selected to be included in this model. Table 5 indicates the items that were selected for Model 2. As in the first model, each of the ten factor variances was set at one. The factor covariances were freed for estimation in this model. The fit of this model was also poor, as determined by Hu and Bentler’s (1998) recommendations. The fit statistics for this model are presented in Table 7.
For the third model, sixteen items that were judged to represent Pace (8 items) and Flexibility ( 8 items) were selected. The items selected for this model are presented in Table 5. CFA demonstrated that the fit of this model was also poor (see Table 7).
Hypothesis 1 proposed that a ten-factor model would be the best representation of the Time Preferences constructs. This hypothesis was not supported. Based on the results of the EFA and CFA, it was determined that the six-factor model was the best representation of the data in this sample. MacCallum, Browne, and Sugawara (1996) note that in large models, the fit indices may falsely indicate poor fit in a model due to the large number of degrees of freedom. MacCallum et al. (1996) recommend that the RMSEA be used, as it compensates for model complexity (Hu & Bentler, 1999). Thus, the six-factor model (RMSEA = .055) had the best fit, and this structure was used to compute composite factor scores for each factor. Descriptive statistics for the composite scores are presented in Table 8. A final listing of the items used to compose these scales is presented in Appendix B.
Convergent and Discriminant Validity
23 the expected direction of this relationship. It was also expected that people high in
friendliness would score high in valuing social time at work (Task/Social Time). This
correlation was also significant (r = -.26, p = 001). This indicated that respondents who were high in Friendliness also preferred a smaller proportion of on-task time compared with social time at work, and was consistent with predictions.
Several facets of Neuroticism were expected to correlate with measures of
Perspective and Silence. However, neither a Perspective nor Silence scale emerged from the EFA or CFA analysis — therefore, these relationships could not be tested.
24 Cognitive ability was not expected to correlate with any facet of time preferences, and was included as a discriminant measure. This hypothesis was supported, with the exception of the Schedules scale (rschedules = .16, p = .001; rsocial = .01, rpace = .05, rleisure = -.06, rvalue
= -.02, rmonochron = -.01). Collectivism was expected to correlate with Task/Social Time. This
relationship was significant (r = -.24, p =.001), indicating that individuals high in collectivism are less likely to have a strong Task focus during the day.
Lastly, certain demographic variables that can influence time perception were assessed. Levine (1999) demonstrated that individuals from cities in the Northeast were faster-paced compared to cities in the South, and overall, urban areas were faster-paced than rural areas. In the current study, respondents from urban, rural, or suburban backgrounds were not significantly different from one another in pace (F(2,563) = 0.22, p = .81, R2 = 0.0).
With regard to geographic location, respondents did not differ in any of the facets of time preferences based on the area of the country they grew up in, with the exception of Value of Time (F(6, 574) = 2.30, p =.025; R2 = .028). Post-hoc analyses were conducted using
dummy-coded variables for each region. This revealed that participants from the Pacific region of the U.S. ( m = 3.46) were significantly less likely than participants from the northeast ( m = 3.61) to indicate that they valued time (β = -.15, p = .03). Participants from the southeast (β = -.03) and participants from the south (β = -.03) had slightly lower scores than participants from the northeast, but these differences were not significant. Overall, geographic region explained 2.8% of the variance for this dimension.
25
Summary
Of the eleven relationships predicted, three could not be tested, three were fully supported and one was partially supported. The remaining four were rejected. Several exploratory tests were conducted as well, which yielded mixed results. Overall, the
Task/Social factors appeared to be well-supported by convergent validity evidence, as did the Schedules/Punctuality factor. A complete bivariate correlation matrix describing the
relationships between all measured variables is presented in Table 9. Discussion
The goal of this study was to develop an instrument that measured the dimensions predicted by Brislin and Kim (2003). Initial analysis suggested that at least in a U.S. sample, six of the ten factors held: Schedules, Monochronicity, Pace, Work/Leisure Time,
Task/Social Time, and Value of Time. Efficiency, Perspective, and Silence factors did not emerge, and the Punctuality factor was incorporated into the Schedules factor. Further tests of the model using confirmatory factor analysis demonstrated that this six-factor model had an adequate fit, although problems certainly exist. Further work is needed to refine and respecify this model before it is used in organizations. For example, future analysis may examine the possibility that two second-order factors (i.e., pace and flexibility) exist.
26 study does yield valuable information as a first step toward creating a reliable and valid measure for individual time preferences.
Limitations
Sample. This study had several limitations. First, the sample was predominantly of U.S. origin. Although Brislin and Kim’s (2003) framework should have held for U.S. samples as well as international samples, the restriction of range for many variables most likely produced underestimates of the correlations, which would compromise the factor analyses. Further, a certain degree of social desirability was present in many of the items, further restricting the range of the responses.
Method. The method used to collect data for this study may have introduced several sources of error. Self-report items can be subject to social desirability bias, as well as fatigue or satisficing patterns. The operationalization of certain variables may have introduced error into the results. For example, cognitive ability was measured by the student’s GPA. While GPA is partially determined by cognitive ability, it is not a pure measure, and many other factors contribute to GPA. The correlation between GPA and Schedules that was found may be due to this overlap. It is probable that individuals who strongly value punctuality achieve higher GPAs, regardless of their cognitive ability.
Analysis. The six-factor model violated several of the recommendations for
27 given model. However, the number of parameters included was the minimum necessary to accurately represent the breadth of the constructs.
Other problems with the model were also present. The minimum number of observations recommended by Hatcher (1998) is the larger of 150 or 5 observations per estimated parameter. The six-factor model required 85 parameters to be estimated, which yields a minimum number of 425 recommended observations. This is well below the actual sample size of 298. However, MacCallum et al. (1999) demonstrated that rules of thumb for determining sample size are not valid, and that when communalities are high, population parameters can be accurately estimated with small sample sizes (i.e., 100-200). Adequate sample size is also determined by features of the model such as how well the factors are defined. In this study, the communalities were moderate, and the factors were fairly well defined. The sample size of 298 may have been adequate for accurate parameter estimation. Future Research and Theoretical Implications
Despite the limitations noted above, this study can serve as the first step to gathering important information about work teams. Initially, samples from different cultures can be compared to determine if the factor structure of time preferences is truly the same for non-U.S. and non-U.S. workers. If it is, further analysis can determine if invariance exists between cultural groups, whether international or within regions of the United States. If it is
determined that cultural groups in fact experience time in different ways that do not follow the same patterns as predicted, current theories will need to be adapted to include these differences.
28 satisfaction, or justice perceptions. Additionally, time perception may be important in
predicting person-organization fit. Slocombe and Bluedorn (1999) found that the congruence between a person’s preferred level of polychronicity and organizational-level polychronicity was predictive of their commitment and perceived level of performance in the organization. Put another way, when the level of organizational polychronicity matched the individual’s preferred level, individuals tended to be more committed to the organization. It may also be the case that organizational-level Scheduling norms or Work/Leisure norms can influence perceptions of person-organization fit in this way.
Finally, this scale can be used to gain a better understanding of the factors that contribute to a person’s time preferences. Time is a fundamental aspect of our daily experience, and our preferences related to time play a large role in how our work is
structured and organized. It may be the case that these preferences change over time, or are dependent on contextual factors. Workplaces do differ with regard to time-related
organizational norms (Schriber & Gutek, 1987)—understanding individual differences is key to fostering a healthy workforce.
Practical Implications
A global workforce is now the norm for many types of organizations. If stable individual differences can be measured with regard to time perspective, more effective international teams can be created by considering these differences. If a team is to be working closely together, establishing norms that take these differences into account can be highly beneficial to improving group processes.
29 intervention can benefit culturally homogeneous teams as well. Any team has members with differing personalities and backgrounds (van Vianen & De Dreu, 2001). It may be that these types of differences also contribute to differing time preferences. Preferences may develop as the result of cultural, situational, or biological influences. Gaining knowledge of these factors is essential in developing good strategies to cope with them.
Additionally, information regarding time preferences can benefit cultural diversity training programs. The first stage of this type of program typically attempts to provide workers with awareness regarding the ways other workers may have different values or attitudes. Time preferences information can be included in this process to provide workers with an understanding of how cultural differences may lead to differences in the structure and pace of the workday. Currently, this information is too general to be of much practical use— however, with further research in this area, the relationship between culture and time
preferences can be understood and disseminated to workers. Conclusion
This study demonstrated that individual time preferences can be reliably measured. While future research is needed to refine these scales, this is a first step towards
30 References
Ancona, D.G., & Caldwell, D.F (1992) Demography and design: Predictors of new product team performance. Organization Science, 3(3), 321-341.
Arrow, H., Poole, M.S., Henry, K.B., Wheelan, S., & Moreland, R. (2004). Time, change, and development: The temporal perspective on groups. Small Group Research, 35(1), 73-105.
Ballard, D.L., & Seibold, D.R. (2004). Organizational members’ communication and temporal experience: Scale development and validation. Communication Research, 31(2), 135-172.
Bluedorn, A., Kalliath, T., Strube, M., & Martin, G (1999). The development of an
instrument to measure a fundamental dimension of organizational culture. Journal of Managerial Psychology, 14(3/4), 205-230.
Bond, M.J., & Feather, N.T. (1988). Some correlates of structure and purpose in the use of time. Journal of Personality and Social Psychology, 55(2), 321-329.
Brislin, R.W., & Cushner, K. (1996). Intercultural interactions: A practical guide. Thousand Oaks, CA. Sage.
Brislin, R.W., & Kim, E.S. (2003). Cultural diversity in people’s understanding and use of time. Applied Psychology- An International Review, 52(3), 363-382.
Brislin, R.W., & Yoshida, T. (eds) (1994). Improving intercultural interactions: Modules for cross-cultural training programs. Thousand Oaks, CA. Sage.
31 Conte, J., Landy, F., & Mathieu, M. (1995). Time urgency: Conceptual and construct
development. Journal of Applied Psychology, 80(1), 178-185.
Costa, P.T., & McCrae, R.R. (1992). Normal personality assessment in clinical practice: The NEO Personality Inventory. Psychological Assessment, 4(1), 5-13.
Ely, R. J., & Thomas, D. A. (2001). Cultural diversity at work: the moderating effects of diversity perspectives on work group processes and outcomes. Administrative Science Quarterly, 46, 229-273.
Goldberg, L. R. (1999). A broad-bandwidth, public domain, personality inventory measuring the lower-level facets of several five-factor models. In I. Mervielde, I. Deary, F. De Fruyt, & F. Ostendorf (Eds.), Personality Psychology in Europe, Vol. 7 (pp. 7-28). Tilburg, The Netherlands: Tilburg University Press.
Guzzo, R.A., & Dickson, M.W. (1996). Teams in organizations: Recent research on performance and effectiveness. Annual Review of Psychology, 47, 307-338. Harrison, D. A., Price, K. H., Gavin, J.H., & Florey, A.T. (2002). Time, teams, and task
performance: Changing effects of surface- and deep-level diversity on group functioning. Academy of Management Journal, 45(5), 1029-1045.
Hatcher, L. (1998). A step-by-step approach to using SAS for factor analysis and structural equation modeling. Cary, NC: SAS Institute, Inc.
Hu, L. T., & Bentler, P. M. (1999). Cutoff criteria for fit indexes in covariance structure analysis. Structural Equation Modeling, 6, 1-55.
32 Jackson, S.E., Brett, J.F., Sessa, V.I., & Cooper, D.M. (1991). Some differences make a
difference: Individual dissimilarity and group heterogeneity as correlates of recruitment, promotions, and turnover. Journal of Applied Psychology, 76(5) 675-689.
Jackson, S.E., & Joshi, A. (2004). Diversity in social context: A multi-attribute, multilevel analysis of team diversity and sales performance. Journal of Organizational Behavior, 25(6), 675-702.
Jarvenpaa, S.L., & Leidner, D.K. (1999). Communication and trust in global work teams. Organization Science, 10(6), 791-815.
Jehn, K.A., Northcraft, G.B., & Neale, M.A. (1999). Why differences make a difference: A field study of diversity, conflict, and performance in workgroups. Administrative Science Quarterly, 44(4), 741-763.
Kirkman, B. L., Tesluk, P.E., & Rosen, B. (2004). The impact of demographic heterogeneity and team leader- team member demographic fit on team empowerment and
effectiveness. Group and Organization Management, 29(3) 334-368.
Landy, F.J., Rastegary, H., & Thayer, J. (1991). Time urgency: The construct and its measurement. Journal of Applied Psychology, 76(5), 644-657.
Levine, R. (1997). A geography of time. New York: Basic Books.
Levine, R. & Norenzayan, A. (1999). The pace of life in 31 countries. Journal of Cross-Cultural Psychology, 30(2), 178-205.
33 Mohrman, S.A., Cohen, S.G., and Mohrman, A.M. (1995). Designing team-based
organizations: New forms for knowledge work. Jossey-Bass, San Francisco. Paletz, S.B., Peng, K., Erez, M., & Maslach, C. (2004). Ethnic composition and its
differential impact on group processes in diverse teams. Small Group Research, 35(2), 128-157.
Pelled, L.H., Eisenhardt, K.M., & Xin, K.R. (1999). Exploring the black box: An analysis of work group diversity. Administrative Science Quarterly, 44(1), 1-28.
Polzer, Jeffrey T., Milton, Laurie P., & Swann, Jr. William B. (2002). Capitalizing on diversity: Interpersonal congruence in small work groups. Administrative Science Quarterly, 47, 296–324.
Schein, E.H. (1992). Organizational Culture and Leadership. Jossey-Bass: San Francisco, CA.
Schriber, J.B., & Gutek, B.A. (1987). Some time dimensions of work: Measurement of an underlying aspect of organizational culture. Journal of Applied Psychology, 72(4), 642-650.
Slocombe, T.E., & Bluedorn, A.C. (1999). Organizational behavior implications of the congruence between preferred polychronicity and experienced work-unit polychronicity. Journal of Organizational Behavior, 20(1), 75-99.
Thomas, D.C. (1999) Cultural diversity and work group effectiveness: an experimental study. Journal of Cross-Cultural Psychology, 30(2) 242-263.
34 Triandis, H.C. (2003). The future of workforce diversity in international organisations: A
commentary. Applied Psychology: An International Review, 52(3), 486-495. van der Zee, K., Atsma, N., & Brodbeck, F. (2004). The influence of social identity and
personality on outcomes of cultural diversity in teams. Journal of Cross-Cultural Psychology, 35(3), 283-303.
van Vianen, A.E.M., & De Dreu, C.K.W (2001). Personality in teams: Its relationship to social cohesion, task cohesion, and team performance. European Journal of work and Organizational Psychology, 10(2), 97-120.
Wagner, J. (1995). Studies of individualism-collectivism: Effects on cooperation in groups. Academy of Management Journal, 38(1), 152-172.
Waller, M.J., Giambatista, R.C., & Zellmer-Bruhn, M.E. (1998). The effects of individual time urgency on group polychronicity. Journal of Managerial Psychology, 14 (3), 244-256.
35
36 APPENDIX A
Personality Items
Achievement-Striving
I demand quality.
I plunge into tasks with all my heart. I go straight for the goal.
I put little time and effort into my work (R) I work hard.
I turn plans into action.
I set high standards for myself and others. I do more than what’s expected of me. I am not highly motivated to succeed (R) I do just enough work to get by (R)
Activity Level
I like to always be busy. I like to take it easy (R). I react slowly (R).
I can manage many things at a time. I let things proceed at their own pace (R). I am always on the go.
37 I like a leisurely lifestyle (R).
I do a lot in my spare time.
Cautiousness
I like to stick to my chosen path. I often make last minute plans (R). I act without thinking(R).
I avoid mistakes.
I choose my words with care.
I jump into things without thinking(R). I make rash decisions(R).
I like to act on a whim(R). I rush into things(R). I do crazy things(R).
Collectivism
Winning is everything (R)
I feel that winning is important in work and games (R) Success is the most important thing in life. (R)
It annoys me when other people perform better than /I do. (R) Doing your best isn’t enough – it is important to win. (R)
I prefer to work with others in a group rather than working alone
38 Working with a group is better than working alone
Friendliness
I like to keep others at a distance (R). I often feel uncomfortable(R).
I make friends easily. I cheer people up.
I warm up quickly to others. I act comfortably with others.
I am not really interested in others(R). I feel comfortable around people. I am hard to get to know(R). I avoid contact with others(R).
Immoderation
I easily resist temptation (R).
I tend to do things that I later regret. I never splurge (R).
I often eat too much. I love to eat.
I never spend more than I can afford (R). I am able to control my cravings (R). I rarely over indulge (R).
39 I don’t know why I do some of the things I do.
Orderliness
I love order and regularity. I do things according to a plan. I like to tidy up.
I am not bothered by messy people.
I often forget to put things back in their proper place. I leave my belongings around.
I like order.
I leave a mess in my room.
I want everything to be “just right.” I am bothered by disorder.
Self-Consciousness
I am afraid that I will do the wrong thing. I am comfortable with unfamiliar situations. I find it difficult to approach others.
I am easily intimidated. I stumble over my words.
40 I am not embarrassed easily.
I am not bothered by difficult social situations
Self-Discipline
I get chores done right away. I postpone decisions.
I get to work at once.
I have difficulty starting tasks. I need a push to get started.
I find it difficult to get down to work. I am always prepared.
41 APPENDIX B
Factors and Items
Factor 1: Schedules and Punctuality
It does not bother me to be late to appointments I do not mind being late
I get upset when others are late for work I do not pay much attention to schedules
I feel that appointment times are usually flexible I feel guilty when I am late to meet someone
I like to take each day as it is rather than trying to plan it out It is rude to be late to an appointment
Factor 2: Monochronicity
I prefer to do one thing at a time
I prefer to complete one task before beginning another
I would rather complete parts of several projects every day than complete an entire project I believe it is best for people to be given several tasks and assignments to perform
I believe people do their best work when they have many tasks to complete I can perform my tasks in any order and still get the job done
Factor 3: Pace
42 I rush to finish tasks so I can move on to the next one
I prefer people to “get to the point”
Factor 4: Task/Social Time
I like socializing to be a large part of my work day It is important that I have time at work to socialize I like my business and social activities to mix I believe talking with coworkers wastes time
I get annoyed when people discuss personal matters at work
Factor 5: Work/Leisure Time
I usually do work on my days off
When I go on vacation, I like for my boss to know how to reach me I look forward to time away from work
I prefer to work through lunch
I am eager to leave work to spend time with my family I like to stay late to finish my work
Factor 6: Value of Time
Time is a precious resource Time is valuable
43 Table 1
Comparison of Time Preference Measures
Surveys of Organizational Norms
Surveys of Individual Differences
Direct Assessments of Behavior Time at Work Scale
(Schriber & Gutek, 1987)
Stanford Time Perspective Inventory (Zimbardo & Boyd, 1999)
Time Urgency Scale (Landy 1991)
Organizational
Temporality Scale (Ballard & Seibold 2004)
Time Structure
Questionnaire (Bond & Feather 1988)
Pace of Life (Levine 1997)
Inventory of Polychronic Values (Bluedorn et al, 1999)
Clock-checking (Waller et
44 Table 2
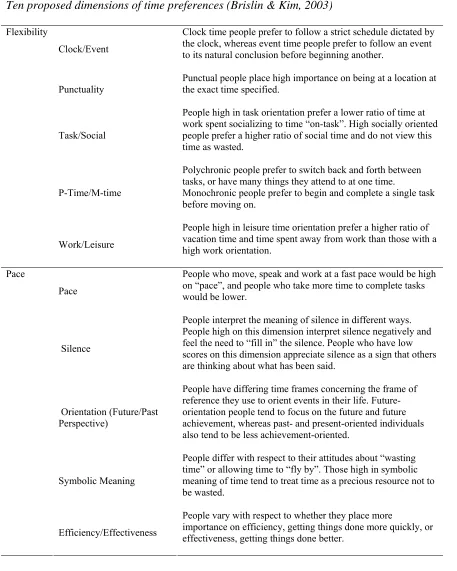
Ten proposed dimensions of time preferences (Brislin & Kim, 2003)
Clock/Event
Clock time people prefer to follow a strict schedule dictated by the clock, whereas event time people prefer to follow an event to its natural conclusion before beginning another.
Punctuality Punctual people place high importance on being at a location at the exact time specified.
Task/Social
People high in task orientation prefer a lower ratio of time at work spent socializing to time “on-task”. High socially oriented people prefer a higher ratio of social time and do not view this time as wasted.
P-Time/M-time
Polychronic people prefer to switch back and forth between tasks, or have many things they attend to at one time.
Monochronic people prefer to begin and complete a single task before moving on.
Flexibility
Work/Leisure
People high in leisure time orientation prefer a higher ratio of vacation time and time spent away from work than those with a high work orientation.
Pace
People who move, speak and work at a fast pace would be high on “pace”, and people who take more time to complete tasks would be lower.
Silence
People interpret the meaning of silence in different ways. People high on this dimension interpret silence negatively and feel the need to “fill in” the silence. People who have low scores on this dimension appreciate silence as a sign that others are thinking about what has been said.
Orientation (Future/Past Perspective)
People have differing time frames concerning the frame of reference they use to orient events in their life. Future-orientation people tend to focus on the future and future achievement, whereas past- and present-oriented individuals also tend to be less achievement-oriented.
Symbolic Meaning
People differ with respect to their attitudes about “wasting time” or allowing time to “fly by”. Those high in symbolic meaning of time tend to treat time as a precious resource not to be wasted.
Pace
Efficiency/Effectiveness
People vary with respect to whether they place more
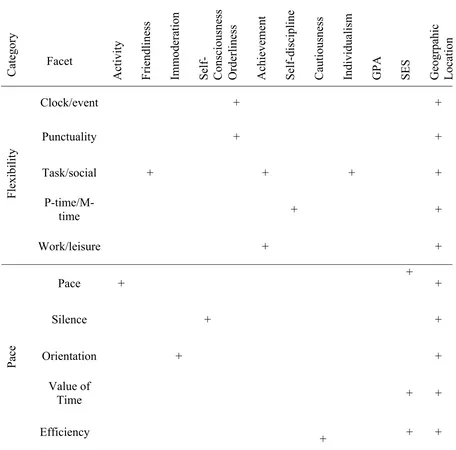
45 Table 3
Proposed Multitrait Matrix
+ indicates that a positive correlation is expected.
Category Facet Activity Friendliness Immod
era
tion
Self- Consciousness Orderlin
ess
Achievemen
t
Self-d
isc
ipline
Cautiousness Individualism GPA SES Geogrpahic Location
Clock/event + +
Punctuality + +
Task/social + + + +
P-time/M-time + +
Flexibility
Work/leisure + +
Pace + + +
Silence + +
Orientation + +
Value of
Time + +
Pace
Efficiency
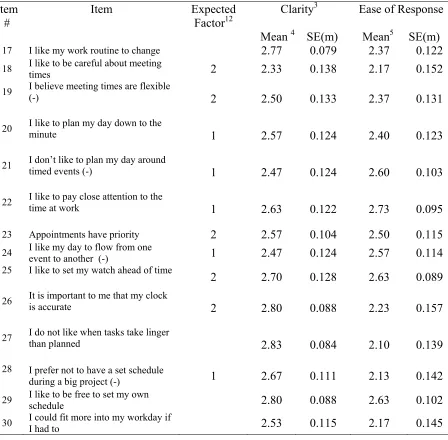
46 Table 4
Complete Item List with Content Validity Evidence and Clarity and Ease of Response Ratings Item
#
Item Expected Factor12
Clarity3
Mean 4 SE(m)
Ease of Response Mean5 SE(m)
1 I prefer to plan my activities so that they follow a particular pattern 2.63 0.102 2.43 0.114 2 I prefer to have a daily work routine
which I follow 2.80 0.088 2.73 0.095
3 I don’t like my schedule to be set in stone (-) 1 2.67 0.088 2.03 0.140 4 I prefer to do things when I am ready rather than on a schedule (-) 1 2.73 0.095 2.20 0.147 5 Staying on schedule is important to me
1 2.87 0.063 2.20 0.139
6 I do not pay much attention to
schedules (-) 1 2.80 0.088 2.10 0.147
7
I like to dawdle. 1 2.53 0.115 2.53 0.124
8 I like my day to follow a tight schedule
2.67 0.100 2.47 0.115
9 I like to take each day as it is rather
than trying to plan it out (-) 1 2.47 0.133 2.53 0.124 10 I like to make a list of things I need to
do in a day 2.83 0.069 2.57 0.124
11 I like my day to be planned around
events (-) 1 2.57 0.133 2.33 0.154
12 I can be flexible if people change
appointment times 2.63 0.102 2.20 0.155
13 I don’t like when my schedule is up n
the air 2.50 0.115 2.47 0.142
14 I prefer all my work to be tightly
scheduled 1 2.43 0.133 2.67 0.100
15 I like to plan my time carefully
1 2.77 0.079 2.43 0.124
16 It is easy for me to find time to plan something new, in addition to what I
already have planned 2.37 0.148 2.50 0.115
1 Based on Subject Matter Expert (SME) assignments with 75% agreement or more. When no number appears, item was not assigned to any factor.
2 Four SMEs rated the Pace items, and four rated the flexibility items. 3 31 students rated the Pace items and 32 students read the Flexibility items. 4 Measured on 3-point scale, with higher ratings indicating higher clarity.
47 Table 4 (continued)
Complete Item List with Content Validity Evidence and Clarity and Ease of Response Ratings Item
#
Item Expected Factor12
Clarity3 Mean 4 SE(m)
Ease of Response Mean5 SE(m)
17 I like my work routine to change 2.77 0.079 2.37 0.122 18 I like to be careful about meeting times 2 2.33 0.138 2.17 0.152 19 I believe meeting times are flexible (-)
2 2.50 0.133 2.37 0.131
20 I like to plan my day down to the minute
1 2.57 0.124 2.40 0.123
21 I don’t like to plan my day around timed events (-)
1 2.47 0.124 2.60 0.103
22 I like to pay close attention to the time at work
1 2.63 0.122 2.73 0.095
23 Appointments have priority 2 2.57 0.104 2.50 0.115
24 I like my day to flow from one event to another (-) 1 2.47 0.124 2.57 0.114 25 I like to set my watch ahead of time
2 2.70 0.128 2.63 0.089
26 It is important to me that my clock is accurate
2 2.80 0.088 2.23 0.157
27 I do not like when tasks take linger than planned
2.83 0.084 2.10 0.139
28 I prefer not to have a set schedule
during a big project (-) 1 2.67 0.111 2.13 0.142
29 I like to be free to set my own schedule 2.80 0.088 2.63 0.102 30 I could fit more into my workday if I had to 2.53 0.115 2.17 0.145
1 Based on Subject Matter Expert (SME) assignments with 75% agreement or more. When no number appears, item was not assigned to any factor.
2 Four SMEs rated the Pace items, and four rated the flexibility items. 3 31 students rated the Pace items and 32 students read the Flexibility items. 4 Measured on 3-point scale, with higher ratings indicating higher clarity.
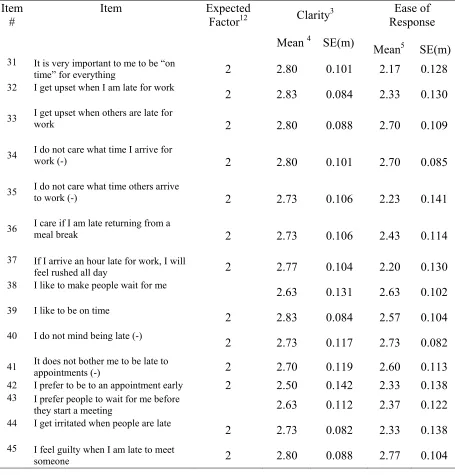
48 Table 4 (continued)
Complete Item List with Content Validity Evidence and Clarity and Ease of Response Ratings Item
#
Item Expected Factor12 Clarity
3
Mean 4 SE(m)
Ease of Response Mean5 SE(m) 31 It is very important to me to be “on
time” for everything 2 2.80 0.101 2.17 0.128
32 I get upset when I am late for work
2 2.83 0.084 2.33 0.130
33 I get upset when others are late for work
2 2.80 0.088 2.70 0.109
34 I do not care what time I arrive for work (-)
2 2.80 0.101 2.70 0.085
35 I do not care what time others arrive to work (-)
2 2.73 0.106 2.23 0.141
36 I care if I am late returning from a meal break
2 2.73 0.106 2.43 0.114
37 If I arrive an hour late for work, I will
feel rushed all day 2 2.77 0.104 2.20 0.130
38 I like to make people wait for me
2.63 0.131 2.63 0.102
39 I like to be on time
2 2.83 0.084 2.57 0.104
40 I do not mind being late (-)
2 2.73 0.117 2.73 0.082
41 It does not bother me to be late to appointments (-) 2 2.70 0.119 2.60 0.113 42 I prefer to be to an appointment early 2 2.50 0.142 2.33 0.138 43 I prefer people to wait for me before
they start a meeting 2.63 0.112 2.37 0.122
44 I get irritated when people are late
2 2.73 0.082 2.33 0.138
45 I feel guilty when I am late to meet
someone 2 2.80 0.088 2.77 0.104
1 Based on Subject Matter Expert (SME) assignments with 75% agreement or more. When no number appears, item was not assigned to any factor.
2 Four SMEs rated the Pace items, and four rated the flexibility items. 3 31 students rated the Pace items and 32 students read the Flexibility items. 4 Measured on 3-point scale, with higher ratings indicating higher clarity.