Are the MCVL tax data useful? Ideas for mining*
JOSé MARÍA ARRAnz** CARlOS GARCÍA-SERRAnO*** (Universidad de Alcalá)
Recibido: Marzo, 2011 Aceptado: Diciembre, 2011 Abstract
This article analyzes the tax data from the Spanish “Continuous Sample of Working life”, which con-tains an overview for each fiscal year of all income tax withholdings and prepayments on earned in-come, economic activities and income assignments of salaried workers, pensioners and recipients of unemployment benefits. To that end, we present the characteristics of these data; we provide a detailed statistical description for the years 2004-2009, linked to information from personal files and those of contributors to the Spanish social security system; and we highlight the opportunities for analysis of some issues related to the labour market and income distribution.
Keywords: tax data, MCVl, income, labour market, panel data
JEL Classification: C81, H0, H2, J3
1. Introduction
Since what was then called the Ministry of labour and Social Affairs began to make the Muestra Continua de Vidas Laboralesor Continuous Sample of Working life (hereinafter
*We would like to thank two anonymous referees of Hacienda Pública Española for their helpful comments and sug-gestions. We have also benefited from comments made by seminar participants at the Institute for Fiscal Studies (Madrid, June 2011), a Workshop organized by the International University Menéndez Pelayo (Seville, June 2011) and the XVIII Public Economics Congress (Malaga, February 2011). We are very grateful to the Spanish Institute for Fiscal Studies for financial support and Spanish Social Security for providing the data for this research. Only the authors are responsible for any errors.
**Correspondence author: José María Arranz. Departamento de Estadística, Estructura Económica y OEI, Facul-tad de Ciencias Económicas y Empresariales, Universidad de Alcalá, Plaza de la Victoria 2, 28802-Alcalá de Henares (Madrid). E-mail: [email protected]
***Carlos García-Serrano. Departamento de Fundamentos de Economía e Historia Económica, Facultad de Cien-cias Económicas y Empresariales, Universidad de Alcalá, Plaza de la Victoria 2, 28802-Alcalá de Henares (Madrid). E-mail: [email protected]
the CSWl), available to researchers in 2005, publications have included studies presenting their general characteristics and simple descriptions of their data, followed by an increasing number of studies examining various aspects of the Spanish labour market and welfare sys-tem (worker turnover, wages, pensions, unemployment benefits, etc.).
However, to date there have been no studies aiming to exploit the information from the data in the CSWl “tax module” in depth, which may be due mainly to the difficulties in-volved in processing it. In order to fill this gap in the literature, we aim to describe the CSWl tax data and to show the opportunities for analysis in areas related to the labour market and income distribution. To that end, this information is linked to personal files and those of con-tributors to the social security system and the difficulties involved in processing it and the management necessary to analyze the information appropriately is considered. In particular, we focus on ascertaining the usefulness of these data and suggesting research lines. The study period covers the editions from 2004 to 2009.
The study is organized as follows. Section 2 provides an overview of the CSWl and reviews the studies that have used this database. Section 3 describes the CSWl tax module, and examines where it comes from and who tax information is obtained from, and the characteristics and variables in the module and the type of income data available. In Section 4, the tax data for the period 2004-2009 is mined, while in Sections 5 and 6 they are linked to those of personal files and those of contributors to the Social Security system, showing their potential for economic research. A final section summarizes the findings of the study.
2. The CSWL: description and studies
2.1. Description
The CSWl provides information on the computerized records of the Spanish Social Security and the Continuous Municipal Register and, in some versions, on the tax data of the national Revenue Agency. Since 2004, this database has provided annual information on more than one million people who have had some kind of work relationship with the Social Security every year, regardless of the duration or the nature of the relationship. In order to prepare the samples, 4 percent of all those people were selected by means of a simple random sampling system. The CSWl is therefore only representative of the popu-lation related to the Social Security system in the year concerned, and is therefore not rep-resentative of the past: although it contains information on previous social security contri-butions by the individuals selected (dating back several years), it does not include past contributions by individuals who have died or who are no longer actively engaged in the labour market.
The reference population in the CSWl includes both workers who are registered with the Social Security as working, as well as recipients of contributory and non-contributory
pensions and unemployment benefits. Jobseekers not receiving benefits and the inactive population (as distinct from pensioners) are not included. The same applies to workers with a social welfare system other than the Social Security (civil servants receiving pensions) and those with none (such as those working in the informal or submerged economy or some mar-ginal activities). They are all included, at least in theory, in the Spanish labour Force Sur-vey (lFS)1.
Moreover, as the population and timeframe covers individuals who have had at least one relationship with Social Security at some time in the year of reference, the sample popula-tion is larger and has a slightly different composipopula-tion to the one that would be obtained on a fixed date (the usual criteria for the lFS). This means that there is a higher proportion of some groups (such as women or young people) who have a sporadic or unstable relationship with the labour market (for example, at least 3 million people who have worked at some time during the year are not registered on a given day)2.
The structure of the CSWl contains seven different files: personal details; details of co-habitants; partitioning criteria data; data on Social Security contributors; data on contribu-tion bases (for employees and the self-employed); data on benefits; and tax data. The latter is the main focus for analysis in this study.
2.2. Studies with the CSWL
As stated in the introduction, after the CSWl was established, studies began to appear which presented its general characteristics and provided a description of the information available (particularly about the first wave). The articles by Durán and Sevilla (2006), Argimón and González (2006), Durán (2007) and García-Segovia and Durán (2008) are ex-amples of this type of study, and provide a good introduction to how the sample is used, while lapuerta (2010) and Arranz et al. (2012) clearly set out the practical difficulties in-volved in handling the data.
Subsequently, after researchers had already begun to use the data, studies began on var-ious economic issues to take place and be published. An early example of this was the “CSWl User Seminar” organized by FEDEA and the General Treasury of the Social Secu-rity in Madrid in October 2007, where several papers were presented. Since then, the num-ber of articles using CSWl data has increased, covering the following areas related to the labour market and the social welfare system: worker turnover (García-Perez, 2008; Cebrián and Toharia, 2008; Toharia et al., 2008; Cebrián et al., 2009; García-Pérez and Rebollo, 2009; García-Pérez and Muñoz-Bullón, 2011; Arranz and García-Serrano, 2011); wages and wage differentials (Clemente et al., 2008); unemployment and unemployment benefits (Re-bollo, 2007; Toharia et al., 2009, 2010); pensions (Moral-Arce et al., 2008; Domínguez-Fabián and Encinas-Goenechea, 2008); and immigration (Izquierdo et al., 2009; Malo and Garrido, 2011). However, none of the works published to date have used the information contained in the tax module.
3. The CSWL tax module
33.1. Where does the tax information come from?
The tax data in the CSWl come from the information in Form 190, which contains the summary for each fiscal year of all the withholdings and prepayments of personal income tax on earned income, economic activities, prizes and income imputations for natural per-sons and legal entities. This declaration form is for information purposes and does not entail any exemption from the obligation to make a declaration. All natural and legal persons and other entities (including government bodies) paying salaries, unemployment benefits and pensions must therefore present this form. Each withholder or payer of income presents sum-marized information and a list of recipients with individualized information on the data in order to construct the remunerations paid and withholdings made.
Form 190 includes income from professional activities and a specific range of business ac-tivities (providing that the payer is required to make a withholding deduction in accordance with articles 93, 95 and 73 of the income tax regulations). Other income is also subject to with-holdings, prepayments or payments in instalments, which are included in forms other than Form 1904. This means that income from movable capital, part of the income from economic
activi-ties and some income (such as capital gains and income from real estate rentals, which are often not subject to any withholdings or prepayments) are not included in the information provided by the CSWl tax module, which means that there is a percentage of individual income other than those included in Form 190 that are not included in the tax data of the sample.
Is this lack of information relevant? The answer depends on the type of study that one wishes to undertake. If the aim is to investigate issues related to wages, there should be no problem, as this category of income is well represented by the reliability and the general scope of the tax data for earned income included in Form 1905. The same is true of
unem-ployment benefits and pensions. However, a general distributional analysis will be some-what limited due to lack of information regarding the sources of income mentioned above, which also tend to focus on high-income taxpayers (as stated by Picos et al., 2011, with the Sample of Personal Income Tax Declarants).
The population consists of salaried workers, pensioners and unemployment benefit re-cipients living in the Common Tax Regime Territory, except for residents of navarre and the Basque Country. The list of recipients produced by the payers includes everyone receiving income subject to income tax, regardless of their obligation or otherwise to declare it for the purposes of income tax, even the details concern payments below the legal exemption rate, payments with no withholdings, or exempt income.
3.2. What information is available?
For each recipient (worker, pensioner or recipient of unemployment benefits) identified in the sample, the CSWl tax module contains as many records as there are payers (or
with-holders) in each year (there may even be more than one record for the same payer). The in-formation related to the family situation, descendants, forebears, etc. of each individual in the sample is provided by the payer, after those data being provided by the recipient.
In any case, despite the fact that they are identified within the CSWl, there are some groups for which no information is available in the tax module. These groups are workers under the Special Home Regime and self-employed workers under any Social Security regime (who are not included because their payer is in many cases not required to carry out a withholding of their income –individuals not engaged in economic activities–, although those working for a company as an employee and because of the nature of their remunera-tion the company must make a withholding as regards the worker’s remuneraremunera-tion and those who are self-employed and included in codes G, H and I of Form 190 are included)6.
For all other groups, the tax module contains the following information: the recipient’s anonymous identification code, which links their information to the other files in the sam-ple; the fiscal identity code number of the payer and the identification code of the paying in-stitution, which also enables a link to the contributors’ file; the province of the recipient’s address; the payment key, which contains information about different types of income; the payment subkey, which breaks down some of the codes above by type of payment; the fam-ily status; disability information; and information on the type of contract or employment re-lationship (of a general nature, of less than a year, of a dependent nature, and of a sporadic nature typical of manual workers paid by shift or by the day).
In addition to the above information, the tax module also contains the entire sum re-ceived in cash and in kind, withholdings and prepayments made and charged, reduction due to extension of working life, reduction due to geographical mobility, other reductions, de-ductible expenses, compensatory pensions, annuities for food, minimum payments for chil-dren and other descendants, chilchil-dren younger than three years old, other descendants, mini-mum payments for disabled children and other descendants, offspring with disabilities and by level of disability, total number of descendants, forebears, forebears with disabilities and by level of disability, and the total number of forebears7.
For wage information, the tax module provides the key variable of total salary payments, including the entire payment in cash and in kind: the first is the full annual amount of cash payments received by the worker during the financial year, while the second are the valua-tions of the payments in kind made in the financial year, not including the prepayment8.
4. Descriptive analysis of the CSWL tax data in 2004-2009
4.1. Treatment of the expanded sample: the number of payers and payment key The first problem we found when reading the file containing the tax data for any year is that the data record contains as many records (rows) as there are payers or types of payments
for each individual. That means that there may be several rows of information for the same individual because he/she has had several payers (for various episodes of employment), for which he/she has received various types of payments (salaries, unemployment benefits, pen-sions, income from economic activities) during the fiscal year. This means that if a recipi-ent, for example, has worked for two employers with different payers in a year and has re-ceived unemployment benefit, he/she will have three records - two under the same heading (employee salaries) and one for the benefit. Obviously, unemployment benefits are aggregat-ed and always come from the same payer, despite being receivaggregat-ed sporadically within a year. The same applies to pensions. The other payment keys may be for different payers. This means that we have an expanded sample of payers and different payment keys for each re-cipient. This makes any a priori analysis difficult. It is therefore useful to work with the ex-panded sample of payers or types of payment in each recipient, quantifying the number of different records that each recipient has for each payer or payment key. This enables analy-sis of the data in terms of individuals rather than records or episodes of payment.
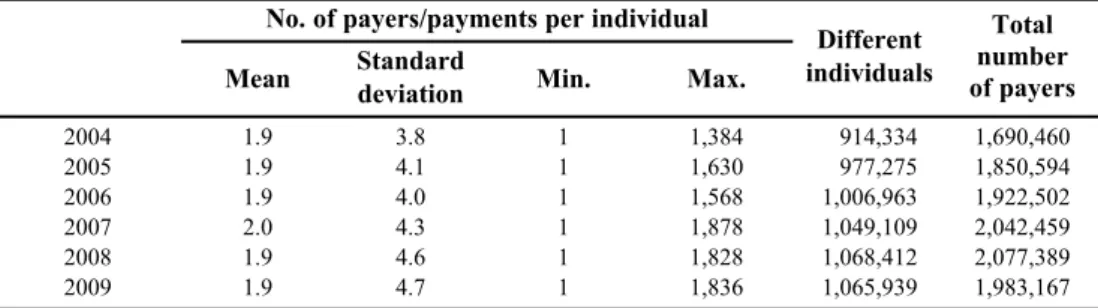
Table 1 presents the results of this method, showing basic descriptive data such as the mean, standard deviation, and the minimum and maximum values of the information con-tained in the tax data files for the period 2004-2009. This table does not initially appear to be very informative, but gives some idea of the problem mentioned above. In each year, the numbers of records and different recipients are such that the relationship between them is very similar: the mean is around 1.9 payers/payments per individual. This means that the re-cipients have a mean of almost two different payers or receive payments from the same payer but for two different reasons (although some individuals receive more than 1,800 payments for different reasons and/or from different payers - these are entrepreneurs). However, this average figure conceals quite an asymmetric distribution. When we extend the analysis of the number of records for each individual, the information (not shown) shows that 54-56 per-cent of individuals have just one payer, 25 perper-cent have two, 10-11 perper-cent have three and less than 1 percent have eight or more.
Table 1
BASIC DeSCrIpTIVeS of The nuMBer of pAyerS/pAyMenTS per InDIVIDuAL AnD ToTAL nuMBer of ToTAL pAyerS/pAyMenTS. CSWL (TAx fILe), 2004-2009
no. of payers/payments per individual Total
Standard Different number
Mean deviation Min. Max. individuals of payers
2004 1.9 3.8 1 1,384 914,334 1,690,460 2005 1.9 4.1 1 1,630 977,275 1,850,594 2006 1.9 4.0 1 1,568 1,006,963 1,922,502 2007 2.0 4.3 1 1,878 1,049,109 2,042,459 2008 1.9 4.6 1 1,828 1,068,412 2,077,389 2009 1.9 4.7 1 1,836 1,065,939 1,983,167
Moving forward, it may be appropriate to work with aggregated information on the in-come received by workers according to the payment key (and even the payment subkey).
Table 2A
BASIC DeSCrIpTIVeS (In euroS) of DIfferenT TypeS of pAyMenTS. CSWL (TAx fILe), 2004-2005
2004 2005
payment key Standard % Indiv. Standard % Indiv.
Means deviation /total Means deviation /total Income from paid employment (K-A) 15,634 18,235 65.7 15,992 19,146 67.5
Pensions (K-B) 8,481 10,662 29.8 8,938 9,301 28.7
Unemployment benefits (K-C) 2,814 2,309 13.2 2,924 2,363 12.9
Unemployment benefits in a lump sum
payment (K-D) 3,946 2,999 0.0 3,791 3,130 0.0
Earnings of directors and/or
administra-tors (K-E) 17,636 43,491 0.3 18,739 50,664 0.3
Courses, lectures, seminars, etc. (K-F) 1,430 3,146 0.9 1,484 3,464 0.9 Income from economic activities, article.
93.1-2 of the income tax regulations
(K-G) 12,981 34,393 3.7 13,824 40,720 3.6
Income from economic activities: agri-cultural, livestock farming and forestry
(K-H) 13,231 31,422 4.7 13,336 33,085 4.3
Income from economic activities (other)
(K-I) 3,229 19,553 0.1 2,592 9,946 0.1
Income from assignment of image rights
(K-J) 592 916 0.0 1,082 950 0.0
Prizes for participation in games, contests,
etc. (K-K) 1,524 3,157 0.1 1,981 4,681 0.1
Exempt income and expenses (K-l) 3,551 9,272 22.3 3,550 10,915 23.2 Other special incomes -American
Cup-(K-M) 5,845 8,127 0.0 19,886 22,625 0.0
Total income 15,195 20,400 100.0 15,773 21,650 100.0
Total income in cash 15,136 20,232 100.0 15,710 21,487 100.0
Total income in kind 868 2,624 6.8 910 2,364 6.9
Withholdings 2,330 6,315 72.9 2,419 6,858 75.1
prepayments made 185 1,034 6.2 196 888 6.3
prepayments charged 164 1,143 4.0 171 890 4.1
Different individuals (total) 914,334 977,275
note:“K” means payment key. Column “%Indiv./total” is the ratio between the number of individuals in each key (K) and the total of individuals each year.
Table 2B
BASIC DeSCrIpTIVeS (In euroS) of DIfferenT TypeS of pAyMenTS. CSWL (TAx fILe), 2006-2007
2006 2007
payment key Standard % Indiv. Standard % Indiv.
Means deviation /total Means deviation /total Income from paid employment (K-A) 16,842 21,868 68.3 17,635 21,986 68.5
Pensions (K-B) 9,502 9,400 28.3 9,638 10,594 28.3
Unemployment benefits (K-C) 3,044 2,400 13.1 3,088 2,420 13.8
Unemployment benefits in a lump sum
payment (K-D) – – – – – –
Earnings of directors and/or
administra-tors (K-E) – – – – – –
Courses, lectures, seminars, etc. (K-F) 1,575 3,652 1.0 1,653 5,463 1.1 Income from economic activities, article.
93.1-2 of the income tax regulations
(K-G) 14,562 40,749 3.6 15,906 42,320 3.8
Income from economic activities: agri-cultural, livestock farming and forestry
(K-H) 13,550 35,302 3.9 22,336 47,347 4.5
Income from economic activities (other)
(K-I) – – – – – –
Income from assignment of image rights
(K-J) – – – – – –
Prizes for participation in games, contests,
etc. (K-K) – – – – – –
Exempt income and expenses (K-l) 3,579 10,163 23.0 3,739 11,369 22.2 Other special incomes -American
Cup-(K-M) – – – – – –
Total income 16,552 23,284 100.0 17,759 25,329 100.0
Total income in cash 16,483 22,956 100.0 17,684 24,964 100.0
Total income in kind 999 5,355 7.0 1,012 5,887 7.4
Withholdings 2,573 7,764 76.5 2,699 7,776 76.0
prepayments made 228 2,348 6.4 238 2,511 6.6
prepayments charged 213 2,703 4.2 225 2,985 4.4
Different individuals (total) 1,006,963 1,049,109
Table 2C
BASIC DeSCrIpTIVeS (In euroS) of DIfferenT TypeS of pAyMenTS. CSWL (TAx fILe), 2008-2009
2008 2009
payment key Standard % Indiv. Standard % Indiv.
Means deviation /total Means deviation /total Income from paid employment (K-A) 18,312 22,406 68.0 18,249 23,467 65.2
Pensions (K-B) 10,288 11,909 28.7 10,606 11,707 29.2
Unemployment benefits (K-C) 3,317 2,521 17.0 4,004 2,936 21.6
Unemployment benefits in a lump sum
payment (K-D) – – – – – –
Earnings of directors and/or
administra-tors (K-E) – – – – – –
Courses, lectures, seminars, etc. (K-F) 1,717 3,909 1.2 1,717 3,831 1.2 Income from economic activities, article.
93.1-2 of the income tax regulations
(K-G) 15,698 40,127 3.7 15,146 40,454 3.5
Income from economic activities: agri-cultural, livestock farming and forestry
(K-H) 25,598 55,557 4.5 21,762 48,517 4.2
Income from economic activities (other)
(K-I) – – – – – –
Income from assignment of image rights
(K-J) – – – – – –
Prizes for participation in games, contests,
etc. (K-K) – – – – – –
Exempt income and expenses (K-l) 4,013 11,735 22.7 4,499 12,285 21.2 Other special incomes -American
Cup-(K-M) – – – – – –
Total income 18,717 26,293 100.0 18,353 25,692 100.0
Total income in cash 18,638 25,922 100.0 18,277 25,370 100.0
Total income in kind 1,055 5,735 7.5 1,043 5,294 7.3
Withholdings 2,713 7,634 74.4 2,834 8,033 69.6
prepayments made 244 2,352 6.7 231 1,931 6.5
prepayments charged 232 2,803 4.5 216 2,242 4.3
Different individuals (total) 1,068,412 1,065,939
This avoids the need to work with the expanded initial sample, which creates problems for analysis and it is not informative in terms of the variables of interest. The way to calcu-late the information in this case is to add the amounts received by each person according to the type of payment. For example, if an individual has three different payers with three pay-ments of income from employment, they are added together and considered the recipient’s earned salary income. When calculating the mean (and any other measure of the distribu-tion), doing so for different individuals is set as a condition. Table 2A-2C shows the basic descriptive statistics of the variables by key9, and the total full payments in cash and in kind
for the individuals in the sample from 2004 to 200910.
Focusing on the salary information, the data in this table11show that the percentage of
peo-ple receiving wages between 2005 and 2008 was similar, at about 68 percent, but was three per-centage points higher than in 2004 and 2009. The average salary income increased from 15,634 euros in 2004 to 18,312 euros in 2008 (in nominal terms), and fell back to 18,249 in 2009. In terms of total income, the total full payment received by individuals is very similar to the aver-age for payments received by salaried workers (most are cash payments and a small proportion are payments in kind, which were only received by about 7 percent of the people in the sample). We can attempt to compare these figures (salaried workers’ payments in particular) with those from other sources that provide information on income from work. The most useful are the Quarterly labour Cost Survey (QlCS) and the Annual labour Cost Survey (AlCS)12. In
both surveys, the labour cost is defined as the cost incurred by the employer for the use of labour and includes several items, including wage costs, which covers all remunerations, both in cash and in kind, paid to workers for the professional provision of their labour services to others, paid for actual work, whatever the form of remuneration, and rest periods calculable as work; it therefore includes the base salary, salary supplements, overtime payments, extraor-dinary payments and arrears. Figures are given on a gross basis, i.e. before withholdings or Social Security payments are made on the worker’s behalf.
Table 3 shows the comparable information related to annual salary payments gathered by the CSWl, QlCS and AlCS for the period 2004-2009. In the QlCS, the monthly wage cost for each quarter in each year is multiplied by three, and the costs of the four quarters are then added together to obtain the annual cost.
Table 3
AnnuAL SALAry pAyMenTS (In CurrenT euroS) gAThereD By CSWL (TAx DATA), QLCS AnD ALCS
years CSWL QLCS ALCS 2004 15,634 15,824 18,436 2005 15,992 16,232 18,893 2006 16,842 17,132 19,445 2007 17,635 17,853 20,246 2008 18,312 18,735 21,639 2009 18,249 19,334 22,329
According to the AlCS, the average annual wage in 2004 was 18,436 euros, while ac-cording to the QlCS the ordinary annual wage cost was 15,824 euros. As is apparent, this figure is very similar to the sum for payments received by employees based on the CSWl data for the same year. In fact, the differences between these latter two sources in the peri-od 2004-2009 are relatively small (less than 2 percent), although this difference increased in 2009 as a result of the QlCS (and the AlCS) including an increase in salary costs, while the CSWl showed a slight reduction in salary payments received.
4.2. Classification of individuals based on the combination of income in one year Using the information presented above, it is possible to classify individuals into four groups depending on the type of payment they receive at some point in the year: salaried workers (K-A), pensioners (K-B), unemployment benefit recipients (K-C) and the self-em-ployed (K-G + K-H + K-I).
Interestingly, in the same way that there will be individuals who only receive one type of payment during a year who can therefore easily be classified according to the categories above (e.g. a salaried worker who has been employed throughout the year), there will be individuals who receive two or more types of payments during a year which are also combined in differ-ent ways (e.g. a salaried worker who has become unemployed, has received unemploymdiffer-ent benefits and has subsequently started self-employed work, all in the same year). We therefore propose a classification that combines the above situations throughout the year, which enables us to relate the tax data to the individuals’ working lives and to make the database more in-formative and easier to mine. Table 4 shows the distribution of individuals in the sample ac-cording to this classification of possible combinations of payments for the period 2004-2009.
The data highlights the change in the economic situation and the labour market beginning in 2007. During the period of economic expansion in 2004-2007, the percentage of individu-als only receiving wages and of salaried workers at some point in the year increased (and peaked in 2007) and the proportion of those receiving salaries and unemployment benefits and those only receiving unemployment benefits remained stable. In 2008-2009, the percent-age of people only receiving wpercent-ages fell, while the proportion of individuals receiving salaries and unemployment benefits, of those receiving wages and pensions at some point in the year and of those only receiving unemployment benefits increased.
5. The link between the personal files and the tax module
5.1. Description
This section describes the link between the personal files for each year in the CSWl and the appropriate tax module. The two files are linked by means of the individual’s iden-tification code for each year. Personal files provide information on the individual’s
person-al identification code, gender, year of birth, nationperson-ality, province of birth, province of first registration, address, date of birth, country of birth and level of education. The tax module files contain the personal identification code and information on the income received by workers according to their payment key. Table 5 provides information on the number of linkable and non-linkable individuals in the files for individuals and the tax module for each year.
Table 4
DISTrIBuTIon of InDIVIDuALS By CoMBInATIon of pAyMenTS. CSWL (TAx fILe), 2004-2009
%
2004 2005 2006 2007 2008 2009
Salaried workers (total ) 65.7 67.5 68.3 68.4 68.0 65.2
Pensioners (total) 29.8 28.7 28.3 28.3 28.7 29.2
Unemployment benefit recipients (total) 13.2 12.9 13.1 13.8 17.0 21.6
Self-employed (total) 8.3 7.8 7.5 8.0 7.9 7.5
Salaried workers (only) 49.1 50.8 51.6 50.8 47.5 43.0
Salaried workers and unemployment
benefit recipients 8.7 8.7 8.8 9.1 11.6 13.7
Salaried workers and pensioners 3.3 3.5 3.5 4.0 4.3 4.0
Salaried workers and self-employed 3.2 3.0 2.9 2.9 2.8 2.4
Salaried workers, pensioners and
unem-ployment benefit recipients 0.7 0.7 0.8 0.8 1.0 1.1
Salaried workers, unemployment benefit
recipients and self-employed 0.5 0.5 0.5 0.5 0.6 0.6
Salaried workers, pensioners and
self-employed 0.2 0.2 0.2 0.3 0.3 0.3
Salaried workers, benefit recipients,
pen-sioners and self-employed 0.0 0.0 0.0 0.0 0.0 0.0
Unempl. benefit recipients (only) 2.6 2.4 2.5 2.6 3.1 5.3
Unemployment benefit recipients and
pensioners 0.4 0.4 0.4 0.4 0.5 0.6
Unemployment benefit recipients and
self-employed 0.2 0.1 0.2 0.2 0.1 0.2
Unemployment benefit recipients,
pen-sioners and self-employed 0.0 0.0 0.0 0.0 0.0 0.0
Pensioners (only) 23.3 22.1 21.8 21.0 21.0 21.5
Pensioners and self-employed 1.9 1.7 1.6 1.6 1.7 1.6
Self-employed (only) 2.3 2.2 2.1 2.4 2.5 2.3
Other type of incomes 3.7 3.6 3.3 3.1 3.2 3.2
Total (%) 100.0 100.0 100.0 100.0 100.0 100.0
Table 5
InforMATIon on The nuMBer of LInkABLe AnD non-LInkABLe InDIVIDuALS BeTWeen The perSonAL AnD The TAx fILeS.
CSWL, 2004-2009
2004 2005 2006 2007 2008 2009
Individuals from personal files 1,089,475 1,141,442 1,170,287 1,200,481 1,213,245 1,203,003
Individuals from tax files 914,334 977,275 1,006,963 1,049,109 1,068,412 1,065,939
non-linkable (%) 175,600 164,736 163,791 151,790 145,199 139,344
(16.12) (14.43) (14.00) (12.64) (11.97) (11.57) – from personal file (%) 175,141 164,167 163,324 151,372 144,833 138,204 (16.08) (14.38) (13.96) (12.61) (11.94) (11.48)
– from tax file (%) 459 569 467 418 366 1,140
(0.04) (0.05) (0.04) (0.03) (0.03) (0.09) linkable (%) 913,875 976,706 1,006,496 1,048,691 1,068,046 1,064,799 (83.88) (85.57) (86.00) (87.36) (88.03) (88.43) Deleted:
Residents in navarre and Basque
Country 9,483 10,403 10,330 10,836 12,489 16,286
Errors in gender variable 2 0 0 0 0 0
Individuals aged 15 years or less 549 602 714 786 1,049 1,182
Total individuals 903,841 965,701 995,452 1,037,069 1,054,508 1,047,331
The number of individuals in the personal file was higher than the number in the tax module in all the years. When the two files were linked, it was impossible to link a percent-age of individuals. For example, in 2004 16.12 percent are individuals not present in one of the two files: 16.08 percent were individuals with personal information but no tax informa-tion, and 0.04 percent individuals with tax information but no personal information. As men-tioned above (in Section 3), there is no information in the tax module for two groups, despite the fact that they are identified in the CSWl: these groups are residents of navarre and the Basque Country with incomes from payers declaring taxes in their territory, and workers in the Special Home Regime and self-employed workers in any Social Security regime. The percentage of cases with linkable information between the two files increased between 2004 and 2009, to 88.43 percent in the latter year, reflecting the proportion of those with person-al but no tax information fperson-alling from 16 percent to 11.6 percent during the period under analysis.
The table contains some refinements that are necessary to continue with the appropri-ate mining of these linked data: errors in the gender variable have been eliminappropri-ated, indi-viduals aged 16 years or older have been selected, and information for residents of navarre and the Basque Country with incomes from payers declaring taxes under the general com-mon regime in the territory has been removed13. However, these refinements only account
Table 6
pATTernS of The SAMpLe WITh TAx InforMATIon (enTIre SAMpLe: peopLe AgeD More ThAn 15).
CSWL (TAx DATA) 2004-2009
frequency percent Cumulative pattern
percent 754,022 61.21 61.21 111111 67,354 5.47 66.67 011111 47,574 3.86 70.54 000111 44,127 3.58 74.12 001111 42,073 3.42 77.53 000011 37,181 3.02 80.55 000001 24,503 1.99 82.54 111110 21,619 1.75 84.30 100000 21,444 1.74 86.04 111100 18,413 1.49 87.53 110000 17,841 1.45 88.98 111000 11,950 0.97 89.95 000010 8,800 0.71 90.66 000110 8,580 0.70 91.36 000100 7,710 0.63 91.99 101111 6,994 0.57 92.55 010000 6,417 0.52 93.07 110111 6,383 0.52 93.59 011110 6,318 0.51 94.11 011000 5,620 0.46 94.56 011100 5,353 0.43 95.00 001000 5,169 0.42 95.42 001110 4,594 0.37 95.79 111101 4,579 0.37 96.16 001100 4,239 0.34 96.50 111011 3,963 0.32 96.83 100111 3,245 0.26 97.09 010111 2,459 0.20 97.29 000101 2,329 0.19 97.48 110011 2,022 0.16 97.64 100011 1,965 0.16 97.80 001011 1,856 0.15 97.95 011011 1,848 0.15 98.10 111001 1,767 0.14 98.25 100001 1,505 0.12 98.37 001101 1,502 0.12 98.49 110001 1,465 0.12 98.61 011101 1,264 0.10 98.71 010011 1,128 0.09 98.80 001001 944 0.08 98.88 110110 918 0.07 98.95 010001 874 0.07 99.02 110100 12,012 0.98 100.00 Others 1,231,923 100.00
Furthermore, table 6 shows the changes in the presence in the sample of all individuals over 15 years old, with tax information on some of the six waves of the CSWl available. The number of people in any single wave is just over 1.2 million. The last column shows the his-tory of each individual, and has six positions - one for each year between 2004 and 2009: the value 1 indicates that the sample contains tax and personal information for that individual in that year, and 0 that it has no information and that the individual does not appear in the sam-ple that year.
The most common profile (61.21 percent of individuals, i.e. 754,000) is for individuals for whom tax information is available for the six waves (the first row of the table). In addi-tion, nearly 20 percent of the individuals (second to sixth rows) appear in a year other than 2004 and then continue to appear in the other years in the period. Around 8.5 percent of in-dividuals also have tax information in 2004, but disappear from the sample in subsequent years (seventh to eleventh rows). The remaining profiles (10 percent of individuals) are peo-ple who appear one year, disappear the next, and appear and disappear again in different years.
A further aspect worth considering is the degree of persistence in both the presence in the sample and in receiving different types of income. To examine this question, table 7 shows the distribution and persistence of individuals according to employment status and type of tax revenue for the years 2004-2009. While panel (a) is similar to table 4 (although not all the possible combinations are provided; only those that are related to receiving the same type of income for a year and some frequently used combinations of wages and other income), the other panels in the table provide some interesting information14.
Panel (b) in particular shows the conditional probabilities, i.e. the probability that an individual only has a certain type of income in a year (e.g. salaries) if he/she only re-ceived the same kind of payment in the previous year. These conditional probabilities give some idea of the levels of persistence in reception of different types of income. In this regard, the highest level of persistence is found among pensioners (at around 92 per-cent) and full-time salaried workers (at around 83 percent in 2004-2006, albeit with a sig-nificant reduction in 2008 and 2009 as a result of the impact of the employment crisis). The persistence of the self-employed situation is also relatively high (at around 74 per-cent, although it decreased in 2008 and 2009), while reception of unemployment benefits is not very high (at just over 40 percent, although with a tendency to increase, especially in 2008-2009).
5.2. Income-related analysis
What type of income-related analysis can be carried out using the available aggregated tax data? Two obvious ideas are first, to investigate how the distribution of various types of payments changed compared to total income during the study period and second, to analyze changes in the income received by individuals grouped by deciles of income.
Table 7
DISTrIBuTIon AnD perSISTenCe of InDIVIDuALS on eMpLoyMenT STATuS By Type of pAyMenT. CSWL (TAx DATA) 2004-2009
%
2004 2005 2006 2007 2008 2009
(a) Distribution
Salaried workers (only) 49.4 51.1 51.9 51.1 47.9 43.5
Salaried workers and unemployment benefit
recipients 8.8 8.7 8.8 9.2 11.7 13.9
Salaried workers and pensioners 3.3 3.5 3.6 4.1 4.3 4.1
Salaried workers and self-employed 3.2 3.1 2.9 2.9 2.8 2.5
Unemployment benefit recipients (only) 2.1 1.9 2.0 2.2 2.5 4.4
Pensioners (only) 23.4 22.2 21.9 21.2 21.1 21.8
Self-employed (only) 2.2 2.1 2.0 2.4 2.4 2.3
(b) Conditional probabilities
Persistence in salaried employment (only)
Prob (yt=salaried worker/yt-1=salaried worker) 83.3 83.0 81.4 76.4 73.4 Persistence in unemployment benefits (only)
Prob (yt=benefit recip./yt-1=benefit recip.) 41.0 42.8 45.2 46.5 52.2 Persistence in pensions (only)
Prob (yt=pensioner/yt-1=pensioner) 91.6 92.1 92.0 92.1 92.7
Persistence in self-employment (only)
Prob (yt=self-employed/yt-1=self-employed) 74.2 74.0 74.1 72.8 70.7
(c) entry in the sample
Prob (yt=salaried worker /yt-1=missing value) 22.9 21.2 25.2 25.4 20.2 Prob (yt=benefit recipient /yt-1=missing value) 0.4 0.3 1.2 1.4 1.8
Prob (yt=pensioner /yt-1=missing value) 3.1 3.2 3.5 4.2 4.6
Prob (yt=self-employed /yt-1=missing value) 0.7 0.7 2.5 1.2 1.0 Prob (yt=missing value /yt-1=missing value) 68.0 71.5 63.3 63.0 68.0
(d) exit from the sample
Prob (yt=missing value /yt-1=salaried worker) 3.9 4.1 4.1 4.9 6.3 Prob (yt=missing value /yt-1=benefit recipient) 18.8 17.5 15.8 19.7 18.3
Prob (yt=missing value /yt-1=pensioner) 5.8 5.4 5.2 5.6 5.3
Prob (yt=missing value /yt-1=self-employed) 7.5 7.7 7.0 7.8 9.3
First, figure 1 shows the distribution of the various sources of income compared to the total for each year in the period 2004-2009. While the proportion of salary incomes com-pared to the total increased during the period 2004-2006 at the same time as that of pensions and non-salary incomes fell, the reverse was true in the period 2007-2009 (although there was also a reduction in the importance of non-salary income in 2009), while the differential element in this period (especially in 2009) is the increase in the proportion of unemployment benefits.
Second, looking at wages, figure 2 shows the distribution of wage earnings by deciles for the period 2004-2009. The data suggest some mobility in their distribution: while it is true that the first five deciles received about 20 percent of the total wage income during the period, this proportion (and especially that of the first three deciles) increased during the years of economic expansion, while it declined in 2007-2009, at the same time as the pro-portion of the last two deciles in this sub-period increased.
figure 1. Distribution of total income by type of payment. CSWL (tax file), 2004-2009
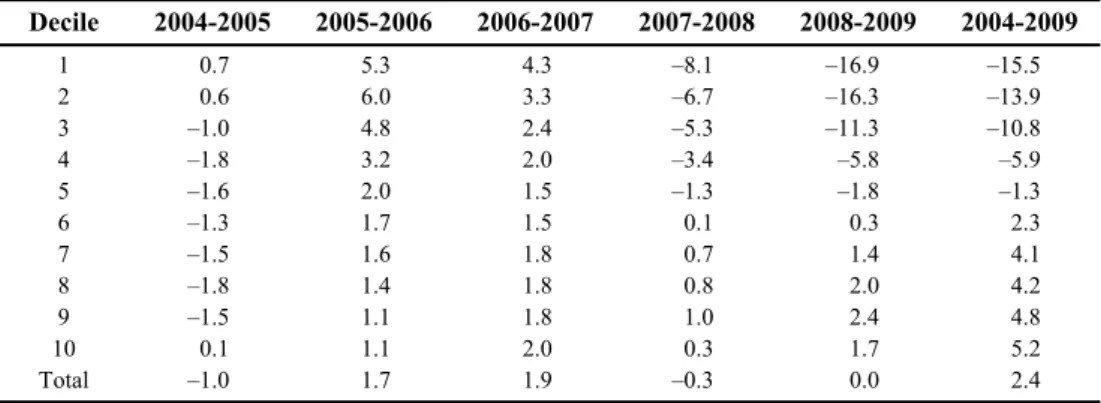
Table 8 provides a more in-depth analysis with the year-on-year rates of change in salary incomes in real terms by decile (in euros in 2006, deflated by the average annual CPI) for the period 2004-2009. The data show a positive correlation between this income and the economic cycle, except for 2004. As a result, salary incomes increased in the years of expansion of 2006 and 2007, while they decreased or did not increase in the re-cession years 2008 and 2009. This trend is more marked in the first deciles, while it is less strong in the last decile. The size of the growth or reductions in salary incomes is greater in the former, and diminishes as we move towards higher wage deciles. This re-sult is due above all to the highly intense fluctuations in employment in the Spanish labour market, with large increases in the economic boom, and sharp reductions in the re-cession. As a result, salary incomes rose by over 2 percent per year in the years of expan-sion and fell by over 3 percent annually in the years of recesexpan-sion in the four first deciles, with reductions of around 16 percent in the first two in the period 2008-2009, at the peak of net job destruction.
Table 8
yeArLy rATeS of ChAnge In SALAry InCoMeS In reAL TerMS By DeCILe. CSWL (TAx fILe), 2004-2009 Decile 2004-2005 2005-2006 2006-2007 2007-2008 2008-2009 2004-2009 1 0.7 5.3 4.3 –8.1 –16.9 –15.5 2 0.6 6.0 3.3 –6.7 –16.3 –13.9 3 –1.0 4.8 2.4 –5.3 –11.3 –10.8 4 –1.8 3.2 2.0 –3.4 –5.8 –5.9 5 –1.6 2.0 1.5 –1.3 –1.8 –1.3 6 –1.3 1.7 1.5 0.1 0.3 2.3 7 –1.5 1.6 1.8 0.7 1.4 4.1 8 –1.8 1.4 1.8 0.8 2.0 4.2 9 –1.5 1.1 1.8 1.0 2.4 4.8 10 0.1 1.1 2.0 0.3 1.7 5.2 Total –1.0 1.7 1.9 –0.3 0.0 2.4
Finally, figure 3 shows the distribution of individuals’ salary incomes in real terms for three groups: for all the individuals receiving salary incomes, for those only receiving wages and for those receiving salaries combined with other income (unemployment bene-fits and pensions). The distribution referred to in the total shows two modes, one for salary incomes of 1,000 euros or less (5-6 percent of the total) and one for salary incomes of be-tween 13,000 and 14,000 euros (4-5 percent of the total). This distribution is a reflection of the distribution among workers who only receive salaries (in which the two modes are 4-5 percent, and the latter has even shifted over time to the range of 14,000-15,000 euros), while the distribution among workers receiving wages and other income shows a concen-tration on low wage incomes, with the proportions of the ranges less than 7,000 euros of 6-8 percent, such that about half the individuals in this group receive wage incomes below that level.
figure 3A. Distribution of individuals’ salary incomes in real terms. CSWL (tax file), 2004-2009
a) All the individuals
figure 3B. Distribution of individuals’ salary incomes in real terms. CSWL (tax file), 2004-2009
6. The link between contributors’ and personal files
and the tax module
This section presents the method for linking personal and contributors’ files in the CSWl with the tax module for the period 2004-2009, and performs a dynamic analysis with the longitudinal information obtained. First, it explains how to add the information from the contributor file; it then describes the link to the personal file; it then performs the link with the tax module information; and it finally performs an application with the data obtained re-lated to wage differentials in the Spanish labour market.
6.1. The contributor file
The contributor file contains information on the employment situation of the worker and the employer. As regards the worker, the variables in this file are the personal identification code, the contribution regime, the contribution group, the type of contract, the start and end date of the employment relationship, the reason for the end of the relationship, the type of employment relationship, the type of employer and institution, among others. As regards the employer’s contribution account, it contains the identification code, the industry affiliation, the number of workers and the registered office, as well as many others.
c) Individuals receiving wages combined with unemployment benefits and/or pensions
figure 3C. Distribution of individuals’ salary incomes in real terms. CSWL (tax file), 2004-2009
The contributors’ file contains as many records (rows) as the number of employment registrations and cancellations that each worker has every year. This means that one indi-vidual may have several rows, relating to several episodes of paid employment, self-em-ployment or receipt of unemself-em-ployment benefits each year. For example, if an individual loses a job as an employee and receives unemployment benefit, and subsequently find an-other job as an employee, he/she will have three records: one for the cancellation of the first job, another due to receiving benefit, and another for starting the new job. This there-fore gives us an expanded sample of episodes of employment and benefits for each indi-vidual.
As our ultimate goal is to link this contributor file with the personal and tax files (which are already linked to each other), we process the expanded sample of contributors by quan-tifying the number of different episodes that each worker has in the year and adding the in-formation about their jobs and their episodes receiving benefits. In this case, this informa-tion is calculated by adding the informainforma-tion from the episodes in several variables for each individual. If an individual has two different episodes of paid employment and one of unem-ployment benefits as in the example above, we will be able to find out their duration and cre-ate two variables showing the total durations of these relationships: one for employment as an employee and one for reception of the benefit, respectively.
Obviously, we are not only interested in quantifying the durations of episodes, but also in aspects related to other possible variables: for example, the number of (different) episodes each contributor has had each year; the number of episodes as a salaried worker, self-employed worker and recipient of unemployment benefits per year; the type (and num-ber) of episodes of benefits (unemployment insurance, unemployment assistance, etc.). These calculations enable the data to be analyzed in terms of people rather than records or episodes.
Table 9A-9B provides basic descriptive statistics for some aggregated variables based on the file information for contributors for each year during the period 2004-2009. The constructed variables are the number of episodes for each individual; the number of episodes of each type of relationship; the total duration of episodes (and by type of relationship); and a proportional measurement (as a proportion of one) in each year for the contribution group, the industry affiliation, company size and the workers’ type of contract.
In order to understand the data, it is necessary to discuss how some of these variables have been developed. As mentioned above, the duration of episodes variable is broken down into two types of durations, called “stable” and “unstable”. The “stable durations” are for in-dividuals whose situation does not change between January and December each year (they have durations of 365 days), while “unstable durations” are for individuals whose situation changes during the year (durations of less than 365 days, with this being the total duration of all discontinuous episodes in the year). The duration of episodes of salaried employment, self-employment and receipt of benefits has been calculated using the same procedure for each type of labour relationship.
Table 9A
DeSCrIpTIVe STATISTICS In The ConTrIBuTorS fILe. CSWL 2004-2006
2004 2005 2006
Mean Std. dev. % Mean Std. dev. % Mean Std. dev. %
number of episodes Total 2.0 3.4 2.0 3.5 2.1 3.6 Salaried workers 2.0 3.5 81.5 2.0 3.5 81.9 2.0 3.6 82.3 Recipients 1.5 1.3 16.6 1.5 1.3 16.0 1.5 1.4 15.8 Self-employed 1.0 0.2 18.0 1.0 0.2 17.7 1.0 0.2 17.6 Duration (days) Total 319 95 100.0 316 96 100.0 319 94 100.0 Unstable 248 120 39.5 245 119 40.6 251 119 40.0 Stable 365 0 60.5 365 0 59.4 365 0 60.0 Salaried workers 296 110 100.0 294 111 100.0 297 109 100.0 Unstable 214 119 45.7 213 118 46.9 219 119 46.3 Stable 365 0 54.3 365 0 53.1 365 0 53.7 Benefit recipients 157 115 100.0 156 115 100.0 155 115 100.0 Unstable 138 101 91.4 137 101 91.4 135 100 91.6 Stable 365 0 8.6 365 0 8.6 365 0 8.4 Self-employed 331 83 100.0 330 84 100.0 330 84 100.0 Unstable 200 109 20.6 198 108 21.0 199 109 21.0 Stable 365 0 79.4 365 0 79.0 365 0 79.0
Salaried workers (proportions)
Job category Missing values 0.007 0.054 0.009 0.060 0.009 0.059 Group 1 0.059 0.231 0.059 0.231 0.060 0.234 Group 2 0.052 0.217 0.052 0.216 0.053 0.217 Group 3 0.038 0.186 0.038 0.185 0.038 0.187 Group 4 0.031 0.167 0.031 0.166 0.031 0.166 Group 5 0.105 0.297 0.105 0.296 0.107 0.298 Group 6 0.042 0.192 0.041 0.190 0.041 0.188 Group 7 0.130 0.322 0.130 0.321 0.130 0.321 Group 8 0.194 0.380 0.194 0.380 0.196 0.380 Group 9 0.125 0.311 0.123 0.309 0.121 0.305 Group 10 0.213 0.386 0.215 0.386 0.209 0.380 Group 11 0.005 0.069 0.005 0.065 0.005 0.065 Industry Missing value 0.023 0.108 0.022 0.105 0.020 0.102 Agriculture 0.033 0.144 0.034 0.147 0.032 0.145 Fishing 0.002 0.049 0.002 0.047 0.002 0.045 Extractive industry 0.003 0.054 0.003 0.052 0.003 0.049 Manufacturing industry 0.152 0.349 0.144 0.341 0.142 0.338 Energy 0.005 0.068 0.005 0.067 0.004 0.064 Construction 0.121 0.314 0.128 0.321 0.131 0.324
Wholesale & retail 0.165 0.358 0.164 0.356 0.161 0.352
Hotel & restaurants 0.069 0.243 0.071 0.246 0.072 0.246
Transport 0.073 0.253 0.072 0.251 0.072 0.250
Financial intermediation 0.015 0.114 0.016 0.118 0.016 0.118
Business activities and renting 0.125 0.312 0.130 0.315 0.132 0.316
Public administration 0.073 0.253 0.071 0.250 0.066 0.240
Education 0.032 0.168 0.031 0.167 0.036 0.178
Health 0.059 0.230 0.058 0.229 0.064 0.239
Other services & personal services 0.047 0.201 0.047 0.201 0.046 0.198
Housing 0.002 0.048 0.002 0.046 0.002 0.048 Firm size 0 0.097 0.255 0.093 0.248 0.079 0.225 1-9 workers 0.231 0.391 0.234 0.392 0.235 0.392 10-19 workers 0.105 0.285 0.105 0.285 0.107 0.285 20-49 workers 0.146 0.328 0.145 0.328 0.148 0.328 50-249 workers 0.194 0.370 0.194 0.369 0.201 0.373 250+ workers 0.227 0.402 0.229 0.402 0.229 0.401 Type of contract Open ended 0.534 0.481 0.528 0.481 0.542 0.478
Permanent per task 0.191 0.363 0.194 0.365 0.189 0.358
Casual 0.138 0.305 0.146 0.312 0.142 0.305
Other fixed term 0.085 0.260 0.081 0.253 0.080 0.251
Agricultural contracts 0.051 0.211 0.051 0.212 0.048 0.204
Individuals 796,559 837,304 861,193
note:‘Job category’ is classified as follows: Group 1: 1 ‘Managers and workers with university degree’; Group 2 ‘Technical engineers and qualified assistants’; Group 3 ‘Clerical and workshop heads’; Group 4 ‘Assistants’; Group 5 ‘Administrative officials’; Group 6 ‘Subordinates’; Group 7 ‘Other clerical workers’; Group 8 ‘1stand 2ndclass officials’; Group 9 ‘3rdclass officials and specialists’; Group 10 ‘labourers and related trades’; Group 11 ‘Workers aged less than 18’.
Table 9B
DeSCrIpTIVe STATISTICS In The ConTrIBuTorS fILe. CSWL 2007-2009
2007 2008 2009
Mean Std. dev. % Mean Std. dev. % Mean Std. dev. %
number of episodes Total 2.1 3.6 2.1 3.6 2.2 3.6 Salaried workers 2.0 3.6 82.2 1.9 3.5 81.4 1.8 3.2 78.9 Recipients 1.5 1.7 16.5 1.6 1.7 20.9 2.0 2.9 26.4 Self-employed 1.0 0.2 17.5 1.0 0.2 17.6 1.0 0.2 17.5 Duration (days) Total 320 93 100.0 322 92 100.0 324 90 100.0 Unstable 254 118 41.0 258 118 40.5 257 119 38.2 Stable 365 0 59.0 365 0 59.5 365 0 61.8 Salaried workers 298 109 100.0 295 111 100.0 289 116 100.0 Unstable 219 119 46.2 210 118 45.4 191 119 43.5 Stable 365 0 53.8 365 0 54.6 365 0 56.5 Benefit recipients 152 114 100.0 152 110 100.0 181 117 100.0 Unstable 134 100 92.3 138 98 93.6 164 108 91.5 Stable 365 0 7.7 365 0 6.4 365 0 8.5 Self-employed 329 85 100.0 329 84 100.0 327 88 100.0 Unstable 234 117 27.4 237 116 28.1 196 110 22.5 Stable 365 0 72.6 365 0 71.9 365 0 77.5
Salaried workers (proportions)
Job category Missing values 0.009 0.062 0.011 0.067 0.016 0.084 Group 1 0.062 0.237 0.065 0.243 0.070 0.251 Group 2 0.054 0.221 0.056 0.225 0.060 0.233 Group 3 0.039 0.188 0.040 0.191 0.042 0.195 Group 4 0.031 0.167 0.032 0.169 0.033 0.173 Group 5 0.109 0.299 0.112 0.305 0.116 0.312 Group 6 0.041 0.188 0.042 0.191 0.044 0.197 Group 7 0.130 0.320 0.129 0.321 0.125 0.320 Group 8 0.197 0.381 0.195 0.382 0.189 0.379 Group 9 0.120 0.303 0.118 0.305 0.115 0.305 Group 10 0.203 0.376 0.196 0.372 0.189 0.368 Group 11 0.004 0.063 0.003 0.056 0.002 0.044 Industry Missing value 0.000 0.000 0.000 0.007 0.000 0.000 Agriculture 0.051 0.210 0.055 0.217 0.058 0.224 Fishing 0.002 0.043 0.002 0.043 0.002 0.044 Extractive industry 0.002 0.048 0.002 0.047 0.002 0.046 Manufacturing industry 0.138 0.334 0.135 0.333 0.134 0.334 Energy 0.004 0.064 0.004 0.064 0.005 0.067 Construction 0.130 0.324 0.120 0.314 0.057 0.222
Wholesale & retail 0.160 0.351 0.159 0.354 0.158 0.357
Hotel & restaurants 0.072 0.247 0.074 0.251 0.077 0.259
Transport 0.073 0.252 0.074 0.256 0.088 0.277
Financial intermediation 0.016 0.117 0.014 0.113 0.067 0.241
Business activities and renting 0.134 0.318 0.134 0.322 0.115 0.304
Public administration 0.063 0.236 0.065 0.239 0.072 0.252
Education 0.037 0.181 0.039 0.186 0.042 0.193
Health 0.069 0.247 0.072 0.253 0.078 0.264
Other services & personal services 0.046 0.198 0.047 0.201 0.042 0.192
Housing 0.002 0.047 0.002 0.048 0.003 0.051 Firm size 0 0.080 0.228 0.093 0.250 0.096 0.257 1-9 workers 0.236 0.393 0.243 0.400 0.239 0.402 10-19 workers 0.107 0.285 0.104 0.284 0.101 0.284 20-49 workers 0.146 0.326 0.139 0.323 0.134 0.323 50-249 workers 0.200 0.372 0.195 0.373 0.197 0.380 250+ workers 0.230 0.401 0.227 0.403 0.233 0.411 Type of contract Open ended 0.551 0.477 0.561 0.479 0.578 0.480
Permanent per task 0.186 0.356 0.177 0.353 0.168 0.350
Casual 0.136 0.300 0.128 0.297 0.111 0.284
Other fixed term 0.081 0.252 0.084 0.258 0.087 0.266
Agricultural contracts 0.047 0.202 0.050 0.209 0.057 0.223
Individuals 891,333 902,275 888,350
The variables containing information on workers in their jobs are qualitative and not continuous, and as such require a treatment that is different to the one applied to the dura-tion variables. As there are as many records or rows of these variables available as jobs the worker has, a proportional measurement of them will be calculated. To that end, the cate-gories of each variable for each individual are added together, and divided by the number of different records or salaried employment episodes that each individual has in each year. This will provide a proportional measure (as a proportion of one) in each year for contribution group, industry affiliation, company size and type of contract.
The table shows that the number of individuals increased from 2004 to 2008, and then fell slightly in 200915. The percentage of individuals with episodes of salaried employment
remains similar between 2004 and 2008 (at around 81-82 percent) and falls 2-3 points in 2009, while the percentage of individuals with episodes of receiving benefits is stable at around 16 percent between 2004 and 2007, but the proportion increases with the crisis in 2008 and 2009. The average duration of all episodes of employment of salaried workers was almost 300 days in 2004-2008. It fell slightly in 2009, while episodes of receiving unem-ployment benefits exceeded 150 days in 2004-2008, and increased in 2009.
As regards the variables available for salaried workers, the largest proportion (20 per-cent) belong to group 8 (1st and 2nd class official) and group 10 (manual labourers and re-lated trades) each year; 16 percent of salaried workers work in the trade area, 14-15 percent do so in the manufacturing industry and 12-13 percent in construction and real estate rental and business services. In addition, 53-58 percent of salaried workers have permanent con-tracts, 36-42 percent have temporary contracts and 5 percent work in agriculture.
6.2. Contributor and personal files
The link between the files with personal variables for each year and the contributor file for each year is performed by means of the individual identification code. Table 10A-10B contains information on the number of linkable and non-linkable individuals in contributor and personal files for each year.
The number of individuals in the personal file exceeds the number in the contributor file in all the years. The link means that there is a percentage of individuals who are non-link-able. For example, in 2009 26.19 percent are individuals not present in one of the two files: 26.17 percent are individuals with personal information but no Social Security registration information, and 0.02 percent with Social Security registration information but no personal information. These percentages are similar for the other years, with slightly higher figures in 2004 and 2005.
The table also shows some refinements of the linked database that are necessary in order that the link between the contributor (and personal) file and the tax module (and personal) file is more accurate (as mentioned in subsection 5.1).
Table 10A
InforMATIon of The nuMBer of LInkABLe AnD non-LInkABLe InDIVIDuALS BeTWeen The ConTrIBuTorS AnD perSonAL fILeS.
CSWL, 2004-2006
2004 2005 2006
observ. % observ. % observ. %
Individuals from personal files 1,089,016 1,140,873 1,169,820
Individuals from contributors file 796,559 837,304 861,193
personal and contributor file (total) 1,089,441 100.0 1,141,371 100.0 1,170,229 100.0
non-linkable 293,307 26.92 304,565 26.68 309,445 26.44
– from personal file 292,882 26.88 304,067 26.64 309,036 26.41
– from contributor file* 425 0.04 498 0.04 409 0.03
linkable 796,134 73.08 836,806 73.32 860,784 73.56
Deleted:
Residents in navarre and Basque Country 48,178 53,168 54,380
Individuals aged 15 year or less 37 69 78
Total individuals 747,919 783,569 806,326
* We have deleted information of workers from the Special Home regime in the contributor file because we do not have their income in the tax file.
Table 10B
InforMATIon of The nuMBer of LInkABLe AnD non-LInkABLe InDIVIDuALS BeTWeen The ConTrIBuTorS AnD perSonAL fILeS.
CSWL, 2007-2009
2007 2008 2009
observ. % observ. % observ. %
Individuals from personal files 1,200,063 1,212,879 1,203,003
Individuals from contributors file 891,333 902,275 888,350
personal and contributor file (total) 1,200,429 100.0 1,213,205 100.0 1,203,282 100.0
non-linkable 309,462 25.78 311,256 25.66 315,211 26.19
– from personal file 309,096 25.75 310,930 25.63 314,932 26.17
– from contributor file* 366 0.03 326 0.03 279 0.02
linkable 890,967 74.22 901,949 74.34 888,071 73.80
Deleted:
Residents in navarre and Basque Country 55,236 56,226 55,397
Individuals aged 15 year or less 106 93 123
Total individuals 835,625 845,630 832,551
* We have deleted information of workers from the Special Home regime in the contributor file because we do not have their income in the tax file.
6.3. The link between the personal, contributor and tax files
let us now consider the description of the link between the personal, contributor and tax files16. As in the links described above, the key variable used is each individual’s
iden-tification number. Table 11A-11B contains information on the number of linkable and non-linkable individuals in the personal, contributor and tax files for each year. The percentage of cases with linkable information in these files increased during the period of analysis, from 64.6 percent in 2004 to over 70 percent in 2008 and 2009.
Some refinements were made once the link was performed (shown in the table) which are necessary to be able to perform an empirical analysis of the wage and unemployment benefit data in daily terms. According to the descriptive statistics for the period 2004-2009 after making these refinements (not shown), about 55 percent of the individuals are male and the distribution of the proportion of the various age groups is bell-shaped. By distinguishing between recipients of salary incomes and unemployment benefits, it becomes clear that approximately half of the
Table 11A
InforMATIon of The nuMBer of LInkABLe AnD non-LInkABLe InDIVIDuALS BeTWeen The perSonAL, TAx AnD ConTrIBuTorS fILe.
CSWL, 2004-2006
year 2004 year 2005 year 2006
Cases % Cases % Cases %
(1) Linkable personal and tax file
(See Table 5) 903,841 965,701 995,452
(2) Linkable personal and contributor file
(See Table 10) 747,919 783,569 806,326
Total files (1) and (2) 1,003,407 100 1,043,374 100 1,071,595 100
non-linkable 355,054 35.38 337,478 32.34 341,412 31.86
– from personal and tax file 255,488 25.46 259,805 24.90 265,269 24.75 – from personal and contributor files 99,566 9.92 77,673 7.44 76,143 7.11 linkable personal, tax and contributor files 648,353 64.62 705,896 67.66 730,183 68.14 Deleted: (a) 3,571 4,205 2,492 (b) 51,563 56,775 57,164 (c) 1,800 2,246 2,295 (d) 47,003 49,547 52,139 (e) 41,720 47,313 49,412
Total personal-tax-contributor files 502,696 545,810 566,681
note:(a) Individuals receiving “other incomes” only.
(b) Individuals with pensions (combined with incomes from other relationships). (c) Individuals aged 65 years or more.
(d) Individuals receiving income as self-employed only.
individuals who receive salary incomes are employed in jobs for which the contribution group is manual occupations (skilled and unskilled), and this proportion increases to two thirds among those receiving unemployment benefits. Around 45 percent of salaried workers work in compa-nies with 50 workers or more, while this percentage is somewhat lower (37 percent) among those receiving benefits. In addition, 41 percent of wage earners have temporary contracts, the propor-tion of these contracts being much higher (71 percent) among recipients of benefits.
As we know the duration of episodes of employment and benefits, it is possible to cal-culate the average daily amounts received from these items. The average daily income from wages amounts to 61 euros and the average daily unemployment benefit to slightly over 25 euros, both in real 2006 euros17. However, these averages conceal a great deal of diversity.
To illustrate this diversity, Figures 4 and 5 show the distribution of daily wage earnings among salaried workers and the daily benefit amounts of the unemployed. In order to enable a comparison between years, the amounts are expressed in real terms (2006 euros).
The distributions of the daily wage incomes in real terms show the usual bell shape with a long tail to the right, with the mode at around 40 euros per day in 2004-2007 and 45 euros per day in 2008-2009: approximately 10-12 percent of salaried workers receive this income
Table 11B
InforMATIon of The nuMBer of LInkABLe AnD non-LInkABLe InDIVIDuALS BeTWeen The perSonAL, TAx AnD ConTrIBuTorS fILe.
CSWL, 2007-2009
year 2007 year 2008 year 2009
Cases % Cases % Cases %
(1) Linkable personal and tax file
(See Table 5) 1,037,069 1,054,508 1,047,331
(2) Linkable personal and contributor file
(See Table 10) 835,625 845,630 832,551
Total files (1) and (2) 1,103,768 100 1,115,354 100 1,105,710 100
non-linkable 334,842 30.34 330,570 29.64 331,538 29.98
– from personal and tax file 268,143 24.29 269,724 24.18 273,159 24.70 – from personal and contributor files 66,699 6.04 60,846 5.46 58,379 5.28 linkable personal, tax and contributor files 768,926 69.66 784,784 70.36 774,172 70.02 Deleted: (a) 1,995 2,102 1,970 (b) 66,702 74,745 75,540 (c) 2,646 2,959 2,927 (d) 58,660 57,309 54,301 (e) 50,782 53,346 54,786
Total personal-tax-contributor files 588,141 594,323 584,648
and about 40 percent receive between 35 and 50 euros a day. The distributions for the years 2008 and 2009 are somewhat displaced to the right and have a lower mode peak than 2004-2007, which suggests that the impact of the crisis hit employment relatively harder among workers in jobs with lower wage levels18.
figure 4. Distribution of daily wages (all individuals) in real terms. CSWL (tax file), 2004-2009
figure 5. Distribution of daily unemployment benefit amounts in real terms. CSWL (tax file), 2004-2009
6.4. An application with the tax data
The personal, contributor and tax files for all the years can be merged to build a panel of data enabling longitudinal tracking of individuals. In order to illustrate the potential of this type of information for the analysis of issues related to the labour market and social welfare system, in this section we present an application covering wage differentials between workers.
In specific terms, we estimated a wage equation in which the dependent variable is the daily salary in real terms (2006 euros) and the explanatory variables are a vector of person-al characteristics (gender, nationperson-ality/place of origin and work experience), job specifica-tions (professional category, type of contract, length of service and working hours) and the firm attributes (region, size, sector of economic activity and type of employer). The wage equation was estimated for fixed effects separately for males and females, using salaried em-ployment episodes of individuals in the CSWl in the period 2004-2009. The results are shown in Table 12.
Table 12
pAneL DATA eSTIMATIonS (fIxeD effeCTS). CSWL, 2004-2009
Males females
Citizenship/place of birth
Spanish born in Spain (&) – – – – – –
Spanish not born in Spain and double citizenship 0.002 0.001 ** 0.001 0.001
UE and developed countries –0.047 0.182 0.065 0.086
Developing countries –0.013 0.043 0.010 0.076 Job category WCHS (&) – – – – – – WCMS –0.081 0.005 *** –0.145 0.005 *** WClS –0.192 0.005 *** –0.226 0.005 *** BCHS –0.171 0.005 *** –0.223 0.006 *** BCMS –0.184 0.005 *** –0.253 0.005 *** BClS –0.230 0.005 *** –0.292 0.005 *** firm size 0 0.014 0.002 *** 0.039 0.002 *** 1-4 workers (&) – – – – – – 5-9 workers 0.024 0.002 *** 0.019 0.002 *** 10-19 workers 0.041 0.002 *** 0.035 0.002 *** 20-49 workers 0.058 0.002 *** 0.055 0.002 *** 50-99 workers 0.080 0.002 *** 0.078 0.003 *** 100-499 workers 0.101 0.002 *** 0.104 0.003 *** +500 workers 0.125 0.003 *** 0.140 0.003 *** Type of contract Open-ended (&) – – – – – –
Temporary per task / Others 0.015 0.002 *** 0.016 0.002 ***
Table 12 (continued)
pAneL DATA eSTIMATIonS (fIxeD effeCTS). CSWL, 2004-2009
Males females
ownership
natural person (&) – – – – – –
Corporation 0.114 0.002 *** 0.111 0.003 ***
Other types of company 0.034 0.002 *** 0.053 0.002 ***
Workers’ cooperatives and similar 0.032 0.004 *** 0.056 0.004 ***
Public sector 0.051 0.003 *** 0.144 0.004 ***
Job tenure
< 6 months (&) – – – – – –
≥6 months and <1 year 0.033 0.001 *** 0.037 0.001 ***
≥1 year and <3 year 0.047 0.001 *** 0.049 0.001 ***
≥3 years and <6 years 0.048 0.001 *** 0.054 0.001 ***
≥6 years 0.042 0.001 *** 0.051 0.002 ***
Labour market experience
<3= years (&) – – – – – – 4-10 years 0.075 0.002 *** 0.056 0.002 *** +10 years 0.092 0.002 *** 0.057 0.002 *** Constant 3.898 0.009 *** 3.715 0.010 *** number of observations 1,793,174 1,390,796 number of groups 418,373 344,542 notes:
– ´Job category´ is classified as (see Table 9): WCHS -White-collar high-skilled (Group 1 and 2); WCMS -White-col-lar medium-skilled (Groups 3, 4 and 5); WClS -White-col-White-col-lar low-skilled (Groups 6 and 7) ; BCHS -Blue-col-White-col-lar high-skilled (Group 8); BCMS -Blue-collar medium-high-skilled (Group 9); BClS -Blue-collar low-high-skilled (Group 10). – ´&´ indicates the characteristics of reference.
– All models include information about working type, regions, industry and year dummies. – *** means that covariates are statistically significant at 1 percent.
** significant at 5 percent.
For space reasons, we will not discuss the results for each variable in detail. They shows the existence of substantial wage differentials between groups of workers, even after taking a wide range of characteristics into account: individuals working in skilled non-manual oc-cupations (requiring a higher level of education and/or qualifications), those with more work experience and longer service in their job and people working in large firms, in limited com-panies or in the public sector (more so in the case of women) receive higher wages than workers who are similar in terms of the other characteristics. The effects of the variables are similar for men and women, but they show that working in more skilled occupations or in the public sector has a greater impact on women’s wages, while longer work experience leads to higher pay for men. In general, the wage differentials obtained are more closely as-sociated with attributes of jobs and workplaces, and as such personal characteristics play a less influential role. This result is consistent with previous evidence for several European countries including Spain (Simón, 2010).