http://siba-ese.unisalento.it/index.php/ejasa/index e-ISSN: 2070-5948
DOI: 10.1285/i20705948v8n3p272
A Bayesian multidimensional IRT approach for the analysis of residents’ perceptions toward tourism
By Bernini, Matteucci, Mignani
Published: 20 December 2015
This work is copyrighted by Universit`a del Salento, and is licensed un-der aCreative Commons Attribuzione - Non commerciale - Non opere derivate 3.0 Italia License.
For more information see:
DOI: 10.1285/i20705948v8n3p272
A Bayesian multidimensional IRT
approach for the analysis of residents’
perceptions toward tourism
Cristina Bernini, Mariagiulia Matteucci
∗, and Stefania Mignani
Department of Statistical Sciences, University of Bologna via Belle Arti 41, 40126 Bologna, Italy
Published: 20 December 2015
In this study, a Bayesian multidimensonal item response theory (IRT) model assuming the presence of correlated general and specific latent traits is proposed for the investigation of residents’ perceptions toward the tourism industry. Data collected in 2012 in the Italian Romagna area were used to study the perceived benefits and costs related to tourism. By using posterior predictive model checks and Bayesian deviance, the additive IRT model was found to fit the data well. More importantly, the results could be interpreted meaningfully, showing the most and least important perceived advantages and disadvantages of tourism for the local community. Finally, thanks to the compensatory structure of the model, the different influence of the overall attitude and the specific perceptions of the respondents could be investigated for each aspect included in the questionnaire.
keywords: Item response theory, Bayesian multidimensional models, tourism attitudes, residents’ perceptions.
1 Introduction
In the last decades, the analysis of the perception and attitude of residents toward tourism development has become crucial for local governments, policymakers, and busi-nesses because the success and sustainability of any development depends on the active support of the local populations. The investigation of the factors that influence the
∗
Corresponding author: [email protected].
c
Universit`a del Salento ISSN: 2070-5948
perceived impact and subsequent support for development has received an increasing attention among academics and practitioners (Deery and Jago, 2012).
In this context, the most popular theoretical framework is the social exchange theory (SET). If locals perceive that the benefits are larger than the costs, then they are inclined to be involved in the exchange and, thus, endorse future development in their community. Several empirical analyses have identified many factors influencing the reactions toward tourism: economic/social/cultural benefits, economic/social/cultural costs, the state of the local economy, the level of community concern, and the community’s attachment, among others (Gursoy and Rutherford, 2004; Gursoy et al., 2009; Vargas-S´anchez et al., 2009).
As emphasized by Deery and Jago (2012), recent quantitative research in this area has not provided in-depth insight into the residents’ perceptions. In particular, the need of understanding how heterogeneous are the perceptions of tourism among individuals within the same community has started to represent a major policy goal, supporting management strategies that can be put in place. In this study, we try to fill this gap using a new methodological framework based on item response theory (IRT), an approach that was originally developed in the educational field (Hambleton et al., 1991; Lord and Novick, 1968) and recently applied to the analysis of residents’ support to tourism (Bernini et al., 2015). IRT moves the focus from the covariance structure analysis that is typical of structural equation models (SEM) to person-level analysis by assigning a score measuring the latent traits of each subject. In particular, following Bernini et al. (2015), we suggest using the SET approach where the perceptions of benefits and costs should be considered as latent constructs. Additionally, a general attitude toward tourism should be considered to explain the variability due to the contrast between benefit and cost perceptions.
In this paper, given the complex structure of the analyzed phenomenon, we propose the use of a multidimensional approach. The attention has only recently been devoted to models that include more than one latent trait, the so-called multidimensional IRT (MIRT) models (see, e.g., Reckase, 2009). These models perform better than separate unidimensional models in fitting the sub-groups of items regarding benefits and costs because they are able to describe the data complexity, taking into account correlated latent traits and also the hierarchical structure of the data. In particular, we introduce an additive model for dealing with items that assess several related domains that are hypothesized to comprise a general structure. Additive models are potentially applicable when there are a general factor and multiple domain specific factors, each of which is hypothesized to account for the unique influence of the specific domain over the general factor (Chen et al., 2006). In this paper, in addition to two specific traits measuring perceptions on benefits and costs of tourism, we introduce a general trait measuring an overall attitude toward tourism. Moreover, we allow all the latent variables to be corre-lated (Sheng and Wikle, 2007, 2009). The estimated model involves a new interpretation of item parameters and individual scores in an unusual setting, different from the most common educational one (Matteucci and Mignani, 2015). A further innovative and im-portant aspect of our proposal deals with the estimation procedure. We applied Markov chain Monte Carlo (MCMC) methods, in a fully Bayesian framework. This approach
has the advantage of estimating item parameters and individual latent traits jointly and it is proved to be more accurate and efficient in parameter estimation compared with the usual marginal maximum likelihood (MML) method (Albert, 1992). Another possible estimation method is conditional maximum likelihood (CML) which relies on the suffi-ciency property and can be used for IRT models in the Rasch family (for an interesting comparison among MML and CML for multidimensional versus unidimensional models see Bartolucci (2007)).
MCMC is powerful for complicated models where the probabilities or expectations are intractable by analytical methods or other numerical approximation. Furthermore, at the end of the analysis, the user has access to the entire posterior distribution of every parameter, not just to a point estimate and standard error. Another important advantage concerns the model comparison that can be carried out using Bayes factors, Bayesian deviance and a Bayesian predictive approach, i.e. posterior predictive model checks. These model comparison techniques provide an alternative method of checking model assumptions (Sinharay et al., 2006). Among the MCMC methods, the Gibbs sampler (Geman and Geman, 1984) has been successfully applied to estimation of IRT models (see, e.g., Albert, 1992; B´eguin and Glas, 2001; Edwards, 2010). The method is straightforward to implement when each full conditional distribution is a known distri-bution that is easy to sample from.
In this paper we refer to the estimation procedure developed by Sheng and Wikle (2008, 2009). We should provide useful insights to encourage a diffuse use of a) multidi-mensional models with complex latent trait structures, and b) Bayesian estimation via MCMC, among practitioners. In fact, MCMC offers the many above mentioned advan-tages including, from a practical point of view, a relative ease of implementation and the availability of free software. Unfortunately, the method is not largely used, probably due to the computational intensiveness that limited its use in the past.
For the case study, we consider a novel sample of residents in the Romagna area and in the nearby State of S. Marino, a developed territory that is homogeneous in terms of economic and social standards, it has cultural heritage and is highly devoted to tourism. We analyzed the data collected in 2012 from a questionnaire with several blocks of items referring to the residents’ evaluations on benefits and costs of the tourism industry. The present paper improves the study of Bernini et al. (2015) in several ways. First, the analysis is carried out on a new data set related to residents’ perceptions in 2012 in order to verify the robustness of results over time. Second, the IRT approach uses a different data dichotomization to better explain the results. Last, a novel procedure based on posterior predictive model checks is implemented for verifying the model fit.
The remainder of this paper is organized as follows. In Section 2 we illustrate the data and we review multidimensional IRT models, as well as model estimation and some issues on the goodness of fit. The results for the additive IRT model are presented, interpreted and discussed in Section 3. Last, in Section 4 conclusions are addressed.
2 Materials and Methods
In this section, we first describe the data used for the analysis in terms of sample and questionnaire. Some descriptive statistics on item responses are given. Secondly, multi-dimensional IRT models are introduced starting from a confirmatory approach. Finally, the estimation method is shortly described and Bayesian methods for assessing model fit are discussed.
2.1 Data and questionnaire
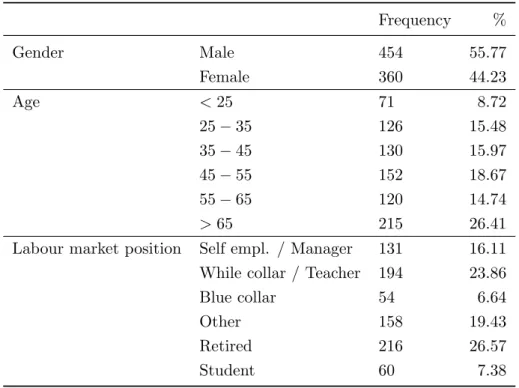
In the analysis, we used data collected from residents in the Romagna area in 2012. The sampling design was based on a stratification of the provinces (Rimini, Forl`ı and Ce-sena, Ravenna, San Marino) and the demographic characteristics of the population (age and gender). A total of 814 questionnaires were obtained via telephone survey mainly. Personal interviews allow to complete the survey by guaranteeing the sample represen-tativeness and reducing missing data (see Table 1 for some descriptives on respondents).
Table 1: Profile of respondents
Frequency % Gender Male 454 55.77 Female 360 44.23 Age <25 71 8.72 25−35 126 15.48 35−45 130 15.97 45−55 152 18.67 55−65 120 14.74 >65 215 26.41
Labour market position Self empl. / Manager 131 16.11 While collar / Teacher 194 23.86
Blue collar 54 6.64
Other 158 19.43
Retired 216 26.57
Student 60 7.38
Following the literature on residents perception of tourism (Gursoy and Kendall, 2006; Gursoy and Rutherford, 2004; Vargas-S´anchez et al., 2009), the questionnaire aimed at capturing residents’ evaluations with respect to the cost and benefit of the tourism in-dustry, the degree of involvement in the tourism inin-dustry, their quality of life, and the
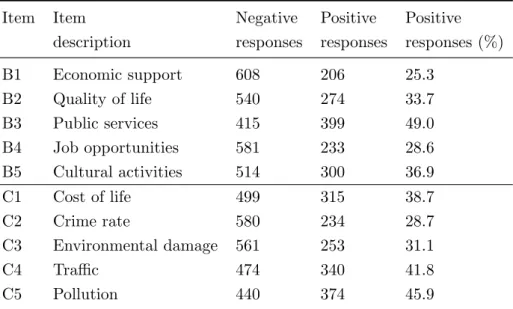
degree of support for future development of the tourism industry, among others. A similar survey was conducted in 2010 (Bernini et al., 2015). In the survey, five items were used to measure the perceived benefits of tourism, that are local economic and employment prospects, opportunities for cultural activities, public services and quality of life improvement. As for tourism costs, items on costs included in the questionnaire deal with the perceived impact of tourism on cost of living, crime, traffic congestion, environment damage and noise. Respondents were asked to indicate whether the as-pects included in the items on benefits/costs would improve/worsen their community on a 7-point anchor scale (the scale of the items with respect to costs was inverted to eliminate reverse scoring). Data are transformed to a binary scale by using the median value as a threshold. The conversion from polytomous to binary data was motivated by the fact that several response categories were not chosen by an adequate number of respondents, and as a consequence, several item-category parameters could not be esti-mated accurately. Working with binary data led to a meaningful interpretation of the results. Table 2 reports the response frequencies for the items B1-B5 about the perceived benefits and items C1-C5 about the perceived costs. A positive response is defined as a response higher than the median value while a negative response is defined as a response lower or equal to the median value, meaning that positive responses overcome the me-dian judgment for each issue, while negative responses do not. Specifically, in our data, the median value is at least 3 on a scale from 1 to 7. Because the central category 4 is interpreted as a sufficiency value and the dichotomization is done taking values higher than the median, responses recoded as 1 will always be equal or above the sufficiency judgments. Then, the probability that a good response falls among insufficient scores is negligible.
Table 2: Response frequencies for the items on benefits and costs
Item Item Negative Positive Positive
description responses responses responses (%)
B1 Economic support 608 206 25.3 B2 Quality of life 540 274 33.7 B3 Public services 415 399 49.0 B4 Job opportunities 581 233 28.6 B5 Cultural activities 514 300 36.9 C1 Cost of life 499 315 38.7 C2 Crime rate 580 234 28.7 C3 Environmental damage 561 253 31.1 C4 Traffic 474 340 41.8 C5 Pollution 440 374 45.9
These descriptive statistics simply show that there is a difference in the perception of the investigated aspects for both benefits and costs.
Lastly, the Cronbach’s Alpha was computed for the two subtests separately, obtaining α1 = 0.79 andα2= 0.59 for the first and second subtest, respectively. While the subtest consisting of the items on benefits shows a pretty good internal consistency, the reliability for the items on costs is only moderate. However, we believe that, due to the short test length, the value for the Cronbach’s Alpha is more than acceptable, and the need for a multidimensional analysis is confirmed.
2.2 Multidimensional confirmatory IRT models
In the framework of latent variable modeling, IRT models are used to express the prob-ability of a given response to a categorical test item as a function of both the latent variable(s) and a set of item parameters. These models were developed under the as-sumption of unidimensionality, i.e. the existence of a single or at least predominant latent trait underlying the response process. However, this assumption is likely to be violated in practice because most questionnaires are explicitly designed to measure multiple as-pects of a given phenomenon, or because different traits such as speediness capability are accidentally involved in the measurement process.
To allow for the presence of multiple traits, multidimensional IRT models were pro-posed (see, e.g., Reckase (2009)), which can be distinguished into exploratory and con-firmatory models mainly. In the former case, all item responses are allowed to be related to all traits, while in the latter case each single trait is characterized through a specific item subset to represent the a priori known different test subscales. Because the test in our case study was explicitly designed to measure different latent traits, we focus here on confirmatory models only.
The presence or absence of a general trait, besides the specific traits, characterizes different types of confirmatory models. Let consider a test with kbinary items divided into m subtests each containing kv items, with v = 1, . . . , m, submitted to a sample of
nsubjects and let Yij be the response variable withi= 1, . . . , nand j= 1, . . . , k.
Within the IRT framework, one of the simplest multidimensional approaches is for-malized by the so called multi-unidimensional model
P(Yvij = 1|θvi, αvj, δvj) = Φ(αvjθvi−δvj), (1)
where the probability of a positive response to a given binary item is expressed as the cumulative normal distribution function Φ depending on the item parametersαvjandδvj
and the specificv-th traitθvi. In particular,αvjrepresents the item discriminating power,
i.e. the capability of the item to differentiate among individuals with different trait levels, andδvj is the threshold or difficulty parameter where an high value means that the item
is likely to be answered negatively and viceversa. Given that each item is characterized by two parameters, the model is also called two-parameter multi-unidimensional model. Estimation of model (1) via Gibbs sampler was proposed by Sheng and Wikle (2007) by allowing for correlated traits also. A logistic function could be used instead of the normal one as well. In this case, a new estimation method in the classical setting based on an
approximate maximum likelihood estimator was proposed by Bartolucci and Pennoni (2007).
While model (1) admits the presence of specific traits only, the additive model (2) assumes the concurrent presence of general and specific latent traits with a compensatory structure
P(Yvij = 1|θ0vi, θvi, α0vj, αvj, δvj) = Φ(α0vjθ0vi+αvjθvi−δvj), (2)
where θ0vi is the overall trait and α0vj represents the discrimination parameter linking
the response on item j of subtest v to the θ0vi. The structure of the linear predictor
is compensatory, in fact a lack in the general trait can be compensated by the specific trait and viceversa in determining the probability of a positive response. The underlying structure of model (2) comes from the traditional bi-factor model, with continuous re-sponse variables and orthogonal traits (Holzinger and Swineford, 1937). Here, the model is for categorical variables and, by following the approach of Sheng and Wikle (2009), the traits are allowed to be correlated. The additive model involves the estimation of a generalα0vj and a specificαvj discrimination parameter and a threshold parameter δvj
for each item j of subtest v. Additionally, an overall trait θ0vi and m specific traits θvi
are estimated for each subject i.
The general structure associated to the additive model usually produces a better fit to data with respect to other multidimensional models. In fact, it is possible to directly examine the strength of the relationship between the domain specific constructs and their associated items, as the relationship is reflected in the general discrimination parameters. Moreover, the presence of correlations among the traits allows for the investigation of the relationships among the different dimensions. The study of correlations among the traits is crucial especially for model fit assessment. Particularly, when the correlation among the dimensions is high, the underlying latent structure can be thought as unidimensional, while if the correlation is almost zero, separate unidimensional models may perform better than a multidimensional one. A particular attention should be placed in the interpretation of the results, in fact indistinguishable traits from a statistical point of view due to very high correlations does not mean that the traits cannot be interpreted separately from a cognitive point of view.
2.3 Bayesian estimation and goodness of fit
Estimation of multidimensional IRT models may be conducted by using classical MML or by simulation through MCMC within a fully Bayesian framework. The latter approach is adopted here as it was recognized as more feasible than MML estimation. The estimation procedure via Gibbs sampler (Geman and Geman, 1984) is described shortly for model (2) which can be viewed as a generalization of model (1).
The Gibbs sampler works by sampling iteratively from the conditional distribution of each variable until convergence. The first step is to treat the binary response vari-able Yvij by introducing an independent continuous normal underlying variable Zvij ∼
and to the right when the response is negative. In this way, the Yvij can be viewed as
indicator of values ofZvij.
Then, informative normal priors are used for the item parameters: ξvj ∼Nm+2(µξv;Σξv),
whereµξv= (µα0v, µαv, µδv)0 andΣξv =diag(σα0v2 , σ2αv, σδv2 ). Normal priors are assumed
for the latent traits: θi ∼Nm+1(0;R), where θi is the vector of the overall and specific
traits for individual i, 0 is a m + 1 vector of zeros and R is the variance-covariance matrix for the traits. It should be noted that, for model identification purposes, trait variances are constrained to 1, soR is a constrained variance-covariance matrix, where correlations are equal to the corresponding covariances.
Given the unconstrained variance-covariance matrix for the traits Σ, the final joint posterior distribution of interest is given by
P(Z,θ,ξ,Σ|Y)∝f(Y|Z)P(Z|θ,ξ)P(ξ)P(θ|R)P(Σ). (3) Because distribution (3) is intractable, the Gibbs sampler is used to sample iteratively until convergence from the treatable conditional distributions ofZ,θ,ξ, andΣ, given the response dataY. Finally, the last step consists in transforming the variance-covariance matrix Σ into the correlation matrix R. All details on the method can be found in Sheng and Wikle (2009) and Sheng (2010).
A great advantage of being in a Bayesian framework is the possibility to use Bayesian model fit techniques. In fact, while the research on goodness of fit in a frequentist approach suffers from the problem of sparse data and several computational issues, Bayesian methods allow the use of posterior predictive model checking (PPMC) which does not rely on distributional assumptions and is relatively easy to implement, given that the entire posterior distribution of all parameters of interest is obtained through MCMC. The method was firstly developed by Rubin (1984) and was later extended to include general discrepancies by Gelman et al. (1996).
The underlying idea of PPMC is to compare the observed data with replicated data generated or predicted by the model by using a number of diagnostic measures that are sensitive to model misfit. The following description of the method is general and does not refer to IRT models specifically. LetP(y|ω) be the likelihood for a particular model applied to data y depending on a set of parameters ω, P(ω) the prior distribution of the parameters and P(ω|y) the corresponding posterior distribution. In PPMC, the distribution of interest is the posterior predictive distribution (PPD) of replicated data yrep, given by
P(yrep|y) = Z
P(yrep|ω)P(ω|y)dω. (4) Once chosen a discrepancy measure D, the method works by comparing the posterior distribution ofD(y,ω) to the posterior predictive distribution ofD(yrep,ω), where any systematic difference means a failure of the model to explain the particular aspects of the data under investigation. Of course, the selection of an appropriate discrepancy measure is fundamental for the success of the method. Discrepancy measures should take into
account the main aspects of the model to be detected, the data features that the model is not able to consider, and the scientific purposes of the research.
In the IRT framework, it is important to check for unidimensionality or multidimen-sionality. In the literature, the odds ratio was proposed by Sinharay et al. (2006) as an effective measure of fit, by examining the associations between the responses to pairs of items j, j0 = 1, ..., k
ORjj0 = n11n00
n10n01, (5)
wherenkk0 is the number of individuals scoringk on the first item andk0 on the second item, withk, k0 = 0,1.
The results of the chosen discrepancy measure can be investigated by a graphical approach. However, it is possible to define a tail-area probability, also known as a posterior predictivep-value (PPP-value) as
P P P −value=P(D(yrep,ω)≥D(y,ω)|y). (6) Given a number Rof replications computed by the MCMC algorithm, the PPP-value can be estimated by simply using the proportion of replications for whichD(yrep,r,ωr)> D(y,ωr), withr = 1, . . . , R. The PPP-values provide a measure of the degree to which observed data would be expected under the model, so values around 0.5 mean adequate fit while values close to 0 or 1 mean poor fit.
The approach of PPMC has several advantages. First of all, the method is very flexible and can be applied to all situations in which one is interested in goodness of fit. Secondly, the method does not rely on regularity conditions or asymptotic distributions, so there are no restrictions in the choice of the function for model checking. Lastly, the uncertainty is directly incorporated in the estimation by using the full posterior distribution rather than a point estimate, thanks to the Bayesian approach. However, we should be aware that the PPMC is not carrying out a classical hypothesis test so the method should be treated as a diagnostic measure to assess model strengths and weaknesses (Sinharay et al., 2006; Levy, 2011).
Finally, among methods for comparing the fit of different models, Bayes factors (Gel-man et al., 2003) and the deviance information criterion (DIC), based on the posterior distribution of the deviance (Spiegelhalter et al., 1998) could be used.
3 Results
The binary response data on the 5 items on benefits (B1-B5) and the 5 items on costs (C1-C5) were used to estimate the parameters for the multi-unidimensional model and the additive model via Gibbs sampler by using the MATLAB packages IRTmu2no (Sheng, 2008) and IRTm2noHA (Sheng, 2010), respectively, with a total of 20,000 iterations and 10,000 as burn-in iterations. Conjugate normal priors were specified for the item parameters and the identity matrix was chosen as prior for the trait correlation matrix.
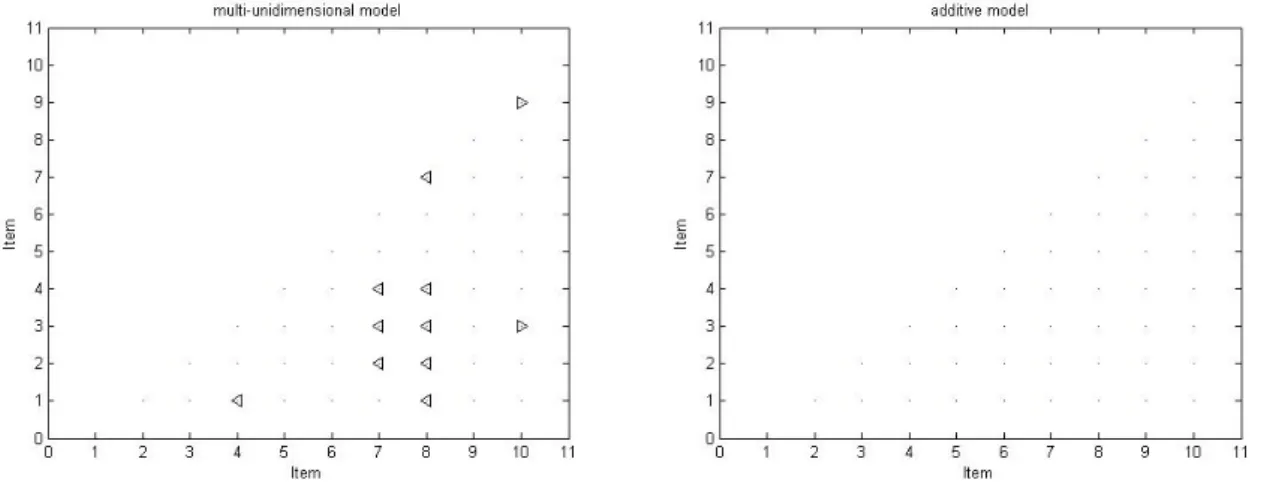
According to the Bayesian DIC, the additive model (DIC=7,833.62) should be pre-ferred in comparison to the multi-unidimensional model (DIC=8,301.31). Moreover, an analysis of goodness of fit was conducted through posterior predictive model checking, in particular using the odds ratio as discrepancy measure with the number of replications equal to the effective number of MCMC iterations R = 10,000. Figure 1 shows, for each item pair, a graphical representation of extreme PPP-values (if any) for the multi-unidimensional model (on the left) and the additive model (on the right). In particular, the PPP-values are represented in the right lower triangle of a 10×10 matrix where the right triangle sign means a PPP-value greater than 0.995 while the left triangle sign means a PPP-value lower than 0.005.
Figure 1: Graphical representation of extreme PPP-values for each item pair.
As can be clearly seen, the number of extreme PPP-values is equal to 11 for the multi-unidimensional model. Because the number of different item pairs is equal to 45, it means that about the 24.4% of the item associations shows poor fit. This percentage is not particularly high, so we cannot say the multi-unidimensional does not fit the data at all. However, as can be seen from the same plot associated to the additive model, no extreme PPP-values are observed showing good fit. Therefore, it can be concluded that the presence of an overall latent variable, besides the specific ones, assumed in the additive model is well supported by data.
Under a confirmatory approach, the additive model assumes that the item responses on benefits are related to a first traitθ1, the item responses on costs are related to a second traitθ2, and all items are directly related to a general trait. Moreover, the three traits are allowed to be correlated. According to an analogous interpretation for the traits given by Bernini et al. (2015), the specific traits can be interpreted here as specific perceptions, i.e. perception of tourism benefits and perception of tourism costs. Because the items on costs were reverse scored, high individual scores for both traits are associated with positive perceptions of the effect of the tourism industry. In particular, as the score on the first dimension increases, as the positive perception of the effect of tourism on the
local environment increases. Analogously, the higher the score on the second dimension is, the lower the perception of a negative impact of tourism on the social and natural environment. Finally, the overall traitθ0 can be interpreted as a general attitude toward tourism, where attitude is defined as an “enduring predisposition toward places, people and behaviours” (Gu and Ryan, 2008; Deery and Jago, 2012). Our general trait can be used as a good measure of the overall attitude that is expressed by the residents toward tourism. Highest scores in the attitude are associated with individuals who perceive the highest advantages and the lowest negative impacts of tourism.
The additive model requires the estimation of a general discrimination parameter (α0v), a specific discrimination parameter (αv) and a threshold parameter (δv) for each
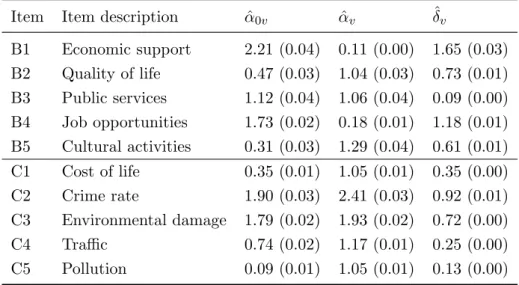
item. Table 3 shows the estimates for the item parameters.
Table 3: Estimates of the item parameters for the additive model (Monte Carlo standard errors in brackets)
Item Item description αˆ0v αˆv ˆδv
B1 Economic support 2.21 (0.04) 0.11 (0.00) 1.65 (0.03) B2 Quality of life 0.47 (0.03) 1.04 (0.03) 0.73 (0.01) B3 Public services 1.12 (0.04) 1.06 (0.04) 0.09 (0.00) B4 Job opportunities 1.73 (0.02) 0.18 (0.01) 1.18 (0.01) B5 Cultural activities 0.31 (0.03) 1.29 (0.04) 0.61 (0.01) C1 Cost of life 0.35 (0.01) 1.05 (0.01) 0.35 (0.00) C2 Crime rate 1.90 (0.03) 2.41 (0.03) 0.92 (0.01) C3 Environmental damage 1.79 (0.02) 1.93 (0.02) 0.72 (0.00) C4 Traffic 0.74 (0.02) 1.17 (0.01) 0.25 (0.00) C5 Pollution 0.09 (0.01) 1.05 (0.01) 0.13 (0.00) Note: v= 1 for the items on benefits,v = 2 for the items on costs
In this particular context of application, discrimination parameters represent the capa-bility of the items to differentiate respondents with different levels of specific perceptions or attitudes, while the threshold parameters can be interpreted as the criticity of the corresponding item (Bernini et al., 2015). Under the additive model, it is not possible to order the items on the basis of their degree of criticity or response probability uni-vocally. However, the items can be compared by fixing either the response probability or the latent traits to specific values. By fixing the overall and the specific score at zero θ0 =θ1 = 0 for the items on benefits, item B1 on economic support and item B4 on job opportunities show the lowest probabilities of a positive response, because they are associated to the highest thresholds, meaning that these two aspects are the most critical. Average respondents are expected to recognize the economic support and job
opportunities as the least important advantages of the tourism industry, while the im-provement in the public services (item B3) is considered the most important advantage. While economic support and job opportunities are usually perceived as great advantages of tourism, the results could have been influenced by the economic crisis of these years that affected also the touristic activities. By fixing the overall and the specific score at zero θ0 = θ2 = 0 for the items on costs, the crime rate (item C2) and the environ-mental damage (item C3) are characterized by the highest threshold parameters and, consequently, represent the most critical aspects. On the contrary, pollution (item C5) appears to have the least important impact of the tourism industry for a typical respon-dent. We should note that all item threshold parameters are positive while, usually, they can be both positive and negative. This means that respondents have rather severe opinions about both perceived advantages and disadvantages of tourism.
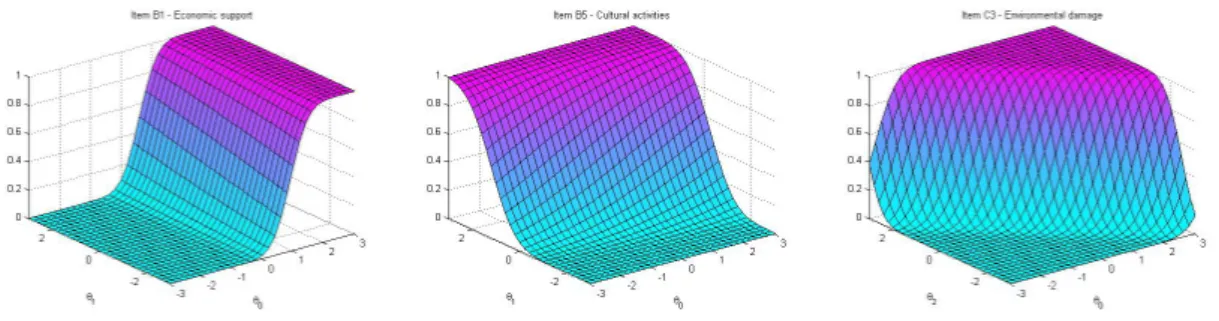
In the additive model, each dimension is weighted by the corresponding discrimina-tion parameters in determining the probability of a positive response for each item. The compensatory structure means that a low score on the general dimension can be com-pensated by a high score on the specific dimension, and vice versa. According to this feature, the items can be classified into three main groups: items where the effect of the overall attitude is prevalent with respect to the specific perception (B1, B4), items where the specific perception is prevalent on the general one (B2, B5, C1, C2, C4, C5) and items where both traits show similar weights (B3, C3). Graphically, the item response surfaces can be used to represent the probability of a positive response for each item given the general and the specific trait, as shown in Figure 2.
Figure 2: Item response surfaces for item B1 - Economic support, item B5 - Cultural activities, and item C3 - Environmental damage (from the left to the right)
In Figure 2, three typical items are considered. For the economic support, the proba-bility of a positive response is almost totally influenced by the overall attitude, while the specific perception of benefits plays a marginal role. This is also true for the perceived job opportunities. Differently, responses on cultural activities are strongly determined by the specific perception instead than the general one. The same feature is observed for the quality and the cost of life, the crime rate, traffic and pollution. Finally, en-vironmental damage is characterized by similar discrimination parameters for the two dimensions, meaning that the overall attitude and the specific perception contribute equally. A similar behavior is observed for the item on public services.
The estimates for the correlations among the trait are: r01 = 0.61(0.02), r02 =
−0.84(0.00), and r12 = −0.65(0.02). The correlation between the overall attitude and the perception of benefits is positive and moderate, meaning that the perception of high advantages of tourism is associated with a high and positive overall tourism attitude. On the contrary, the correlation among the overall attitude and the perception of costs is rather high and negative: high scores on the general trait are associated to low scores on the specific perception on costs, i.e. high disadvantages of tourism. The correlation among the two specific perceptions is then moderate and negative, meaning that people who perceive high advantages of tourism are also very critical about the related costs. These results confirm the findings of several studies on the support of community to tourism (see, among others, Gursoy and Kendall, 2006; Gursoy and Rutherford, 2004).
4 Concluding remarks
In this work, the additive IRT model was proposed to investigate residents’ perceptions toward the tourism industry. This new approach was found to be effective in evaluating both a general attitude and the specific perceptions of the community toward tourism and showed good fit according to Bayesian DIC and PPMC. The results showed that the respondents perceived differently the proposed aspects dealing with benefits and costs related to tourism. Surprisingly, a typical respondent does not consider economic support and job opportunities as immediate advantages of tourism, while an increase in the public services is recognized as the strongest benefit. The most critical aspects are then identified in the crime rate and environmental damage. The compensatory structure of the model allowed to investigate which latent dimension was more involved in explaining the item responses. In fact, while responses on economic support and job opportunities are strongly influenced by the general attitude toward tourism and the responses on public services and environmental damage are equally influenced by both traits, most aspects proposed in the items have found to be affected by the specific perception on benefits or costs mainly. For this reason, we believe that it is very important to include in the model both kinds of latent variables and to allow them to correlate.
Future research should investigate more in detail the heterogeneity of the residents with respect to the latent dimensions identified by the model. In fact, if relevant differ-ences are observed with respect to individual characteristics, targeted policy strategies could be suggested. The study of the differences in the scores obtained by the respon-dents can be done ex-post by analyzing the trait scores with respect to the individual characteristics or by including the individual covariates directly in the model. For the latter approach, multi-group IRT models (see,e.g., Azevedo et al., 2012) or IRT-MIMIC models (see,e.g., Bertaccini et al., 2013) can be used. From the methodological point of view, the sensitiveness of the results to the choice of different prior distributions should be investigated. Finally, models with different structures such as higher-order models could be studied.
Fundings
This research has been partially funded by the Italian Ministry of Education with the FIRB (Futuro in ricerca) 2012 project on Mixture and latent variable models for causal-inference and analysis of socio-economic data.
References
Albert, J. H. (1992). Bayesian estimation of normal ogive item response curves using Gibbs sampling. Journal of Educational Statistics, 17:251–269.
Azevedo, C. L. N., Andrade, D. F., and Fox, J. P. (2012). A Bayesian generalized multiple group IRT model with model-fit assessment tools. Computational Statistics and Data Analysis, 56:4399–4412.
Bartolucci, F. (2007). A class of multidimensional IRT models for testing unidimension-ality and clustering items. Psychometrika, 72:141–157.
Bartolucci, F. and Pennoni, F. (2007). On the approximation of the quadratic exponen-tial distribution in a latent variable context. Biometrika, 93:745–754.
B´eguin, A. A. and Glas, C. A. W. (2001). MCMC estimation and some model-fit analysis of multidimensional IRT models. Psychometrika, 66:541–562.
Bernini, C., Matteucci, M., and Mignani, S. (2015). Investigating heterogeneity in res-idents’ attitudes toward tourism with an IRT multidimensional approach. Quality & Quantity, 49(2):805–826.
Bertaccini, B., Grilli, L., and Rampichini, C. (2013). An IRT-MIMIC model for the analysis of university student careers. QdS - Journal of Methodological and Applied Statistics, 15:95–110.
Chen, F. F., West, S. G., and Sousa, K. H. (2006). A comparison of bifactor and second-order models of quality of life. Multivariate Behavioral Research, 41(2):189–225. Deery, M. and Jago, L. (2012). Rethinking social impacts of tourism research: a new
research agenda. Tourism Management, 33:64–73.
Edwards, M. C. (2010). A Markov chain Monte Carlo approach to confirmatory item factor analysis. Psychometrika, 75:474–497.
Gelman, A., Carlin, J. B., Stern, H. S., and Rubin, D. B. (2003).Bayesian data analysis. Chapman & Hall/CRC.
Gelman, A., Meng, X. L., and Stern, H. S. (1996). Posterior predictive assessment of model fitness via realized discrepancies. Statistica Sinica, 6:733–759.
Geman, S. and Geman, D. (1984). Stochastic relaxation, Gibbs distributions and the Bayesian restoration of images. IEEE Transactions on Pattern Analysis and Machine Intelligence, 6:721–741.
Gu, H. and Ryan, C. (2008). Place attachment, identity and community impacts of tourism - the case of a Beijing Hutong. Tourism Management, 29:637–647.
Gursoy, D., Chi, C. G., and Dyer, P. (2009). An examination of locals’ attitudes. Annals of Tourism Research, 36:723–726.
Gursoy, D. and Kendall, K. W. (2006). Hosting mega events: modeling locals’ support.
Annals of Tourism Research, 33(3):603–623.
Gursoy, D. and Rutherford, D. (2004). Host attitudes toward tourism: an improved structural model. Annals of Tourism Research, 31:495–516.
Hambleton, R. K., Swaminathan, H., and Rogers, H. J. (1991). Fundamentals of item response theory. Sage Publications.
Holzinger, K. J. and Swineford, F. (1937). The bi-factor method. Psychometrika, 2:41– 54.
Levy, R. (2011). Posterior predictive model checking for conjunctive multidimensionality in item response theory. Journal of Educational and Behavioral Statistics, 36(5):672– 694.
Lord, F. M. and Novick, M. R. (1968).Statistical theories of mental test scores. Addison-Wesley.
Matteucci, M. and Mignani, S. (2015). Multidimensional IRT models to analyze learning outcomes of Italian students at the end of lower secondary school. In Millsap, R. E., Bolt, D. M., van der Ark, L. A., and Wang, W. C., editors, Quantitative Psychology Research, Springer Proceedings in Mathematics & Statistics, volume 89, pages 91–111. Springer International Publishing Switzerland.
Reckase, M. (2009). Multidimensional item response theory. Springer-Verlag.
Rubin, D. B. (1984). Bayesianly justifiable and relevant frequency calculations for the applies statistician. Annals of Statistics, 12:1151–1172.
Sheng, Y. (2008). A MATLAB package for Markov chain Monte Carlo with a multi-unidimensional IRT model. Journal of Statistical Software, 28:1–20.
Sheng, Y. (2010). Bayesian estimation of MIRT models with general and specific traits in MATLAB. Journal of Statistical Software, 34:1–27.
Sheng, Y. and Wikle, C. K. (2007). Comparing multiunidimensional and unidimensional item response theory models. Educational and Psychological Measurement, 67:899– 919.
Sheng, Y. and Wikle, C. K. (2008). Bayesian multidimensional IRT models with an hierarchical structure. Educational and Psychological Measurement, 68:413–430. Sheng, Y. and Wikle, C. K. (2009). Bayesian IRT models incorporating general and
specific abilities. Behaviormetrika, 36:27–48.
Sinharay, S., Johnson, M. S., and Stern, H. S. (2006). Posterior predictive assessment of item response theory models. Applied Psychological Measurement, 30:298–321. Spiegelhalter, D. J., Best, N., and Carlin, B. P. (1998). Bayesian deviance, the effective
number of parameters, and the comparison of arbitrarily complex models. Research Report 98-009, University of Minnesota.
Vargas-S´anchez, A., de los ´Angeles Plaza-Mej´ıa, M., and Porras-Bueno, N. (2009). Un-derstanding residents’ attitudes toward the development of industrial tourism in a