© 2017 WIT Press, www.witpress.com
ISSN: 1743-7601 (paper format), ISSN: 1743-761X (online), http://www.witpress.com/journals DOI: 10.2495/SDP-V12-N6-1085-1095
VALUE-BASED APPROACH TO MANAGING THE RISKS
OF INVESTING IN OIL AND GAS BUSINESS
A. DOMNIKOV, P. KHOMENKO & M. KHODOROVSKY
Academic Department of banking and investment management, Ural Federal University named after the first President of Russia B.N. Yeltsin, Russia.
ABSTRACT
Development of the oil and gas business is inextricably linked to large-scale investment programs. Large-scale flow of capital funds, long duration of projects, as well as the external environment’s high uncertainty for oil and gas businesses bring about the high-risk investing; and therefore, it becomes urgent to develop methodological tools for risk management issues. The authors’ approach to risk man-agement of capital investments allows an individual to estimate the risk level of an investment project on the basis of a ratings model, and to evaluate the need for capital to cover potential losses on the basis of the target level of financial stability and long-term strategy of the company. The authors’ technique of RAROC (risk adjusted return on capital) analysis of investment projects allows to calculate the risk-adjusted return on investment and to carry out the selection of projects that contribute most to the creation of value and screen out those projects that destroy the company value. The results can be used by management of oil companies, investors, and analysts in financial decision-making.,
Keywords: economic capital, investment project, investment risks, oil and gascompany, probability of default, value management.
1 INTRODUCTION
The oil and gas businesses occupy leading positions in the world economy and serve as a foundation for the international economic integration and generation of investment potential. Oil and gas projects related to exploration, production, transportation of oil, or such facilities as oil refineries, petrochemical works, and major pipelines, are costly and have long payback periods (exceeding 10 years). The adequacy of capital investment, ranging from preparation of a raw materials base to creation of new facilities or repairs and renovations of existing ones, serves as the basis for normal reproduction processes in the industry. This brings the issue of capital investment decision-making to the fore. Proper capital investment decisions ensure sustainable development of a business, strengthening of its competitive position and growth of its business value. Incorrect decisions result in lost market share, loss of capital, and destruction of value. The most important element of the mechanism of capital investment decision-making is its set of methodological tools for risk assessment, risk taking and mitigation.
In addition to identifying the scope and application of capital investment, the issue of capital investment decision-making has a flip side pertaining to raising capitals and finding sources of financing for the oil and gas industry. The need to ensure long-term flow of funds increases the importance of managing the strategic stability of an oil and gas company, which is determined based on targeted credit ratings, targeted cost of funds, ROIC margin, EVA and other related indicators. In this regard, a mechanism to assess and manage the investment risks must focus on achieving a long-term sustainability and promote the long-term value creation.
2 THE VALUE OF BUSINESS, INVESTMENT RISK AND FINANCIAL DECISIONS The worth of business in the contemporary management practices is a key integrated indica-tor of the efficiency of a business. In general, EVA is defined as (1):
EVA=(ROIC WACC− )×IC (1)
where EVA = economic value added, WACC = weighted average cost of capital, and IC = amount of capital invested.
A positive EVA value characterizes the use of capital as efficient. An EVA value of zero could be an achievement, as well, since investors actually have a rate of return, which com-pensates for their risk-taking, while a negative EVA value characterizes the use of capital as inefficient.
The company value is driven by the efficiency spread, corresponding to the difference between ROIC and WACC. This spread is a key indicator for ranking business units or imple-mented investment projects according to the value they create.
In the 1990s a risk-oriented approach to managing the value of business gained accept-ance. Under this approach, RAROC – a risk-adjusted system for analyzing and managing the financial performance through use of economic capital model – is most popular [2]. This system allows evaluating and comparing the profitability both at the overall bank level and at the level of specific transactions or business units with varying levels of risk. This is not the case when using other indicators, such as profitability, ROA/ROE, because the results (e.g. the rate of return) do not reflect the transaction’s or business unit’s measure of risk involved in achieving the results. RAROC is calculated according to the following formula (2): RAROC NI EL ECAP = − (2) where RAROC = risk-adjusted return on capital, NI = net income, EL = expected losses (determined according to amounts of regulatory reserves), and ECAP = economic capital.
Within this approach, the measure of business value is transformed based on profitability adjusted for the level of risk taken (3):
EP=(RAROC HR− )×ECAP (3)
where EP = economic profit, which characterizes the value added of a business, and HR = hurdle rate, which characterizes the required return on equity, estimated according to CAPM.
Issues of risk assessment of investment projects and of estimating the RAROC compo-nents are discussed below.
3 BASIC COMPONENTS OF THE ECONOMIC CAPITAL MODEL
The main parameters that characterize the investment project, in order to assess economic capital are [1, 3, 4, 5]: PD (probability of default), LGD (loss given default), EAD (exposure at default), M (maturity).
The PD assessment model, being an element of estimating the risk capital, was described above. Economic capital is calculated taking into account the probability of an investment project’s default.
Evaluation of the LGD parameter is done in 4 steps: 1. Preparation of data for simulation.
2. Classification of investment projects based on the criterion of significance of variation of the LGD value [5]. Final arrangement is performed on the basis of the criterion of significance of differences in the sample’s average values, which can be estimated on the basis of Student’s t-test, Fisher’s F-test, Kolmogorov–Smirnov test, Mann–Whitney U-test [8]
3. Plotting LGD distributions for selected groups. Distributions for each classification group are plotted on the basis of the LGD statistics data.
4. Evaluation of the form of LGD distribution and determination of the main parameters. At this stage, an evaluation of the form of distribution is performed and parameters are defined for LGD modeling corresponding to each classification group. Evaluation of the form of distribution can be carried out using the chi-square test, Anderson–Darling test, Kolmogorov–Smirnov test [8].
Subsequently, numerical values of LGD will be used in modeling the economic capital for the Merton–Vasicek model, however in calculating the risk capital according to the simulation method the LGD can be used in form of a random variable with predefined parameters deter-mined in item 4.
The effective period represents a penalty for long durations of the investment phase. Addi-tional adjustment of risk capital for projects lasting more than 1 year is done according to the following formula (3) [4]: M T b PD b PD = + − × − × 1 2 5 1 1 5 . ( ) . ( ) (3)
where M = effective maturity, T = capital investment project’s risk horizon, b(PD) = 0.00852–0.05489*ln(PD)).
4 RATING-BASED MODEL FOR ASSESSMENT OF INVESTMENT PROJECTS The authors presented in a number of previous studies the general methodology of assess-ment of long-term sustainability of investassess-ment projects based on the calculation of a company’s economic capital [1].
Modeling of risks associated with investing is done based on the logit-model’s equation. This method is widely used in theoretical research and in practical forecasting of defaults [16]. The logit-model implies a logistic conversion of predicting data based on the maximum like-lihood procedure [4].
Logit-model’s general view is shown in the formula (4) [4]:
PD e z b Xj ij = + = 1 1 ( ) (4)
where PD = probability of investment project’s default; z parameter = linear combination of regression model’s factors; Xij = value of the jth parameter in the ith investment project;
bj = regression parameter of the jth factor.
The data characterizing the financial performance of an investment project serve as the logit-model’s basis [5]. These include financial variables that characterize the cash flow model of an investment project, as well as a number of non-financial criteria that allow to
Table 1: Main risk factors of investment projects.
Factor Description
Financial factors
DSCR* (Fin1) The average DSCR factor for the investment project’s planning period.
Project’s own equity ratio (Fin2)
This defines the share of investment budget financed by the owners. IRR* (Fin3) Internal rate of return, it designates the discount rate at which
NPV = 0
DPP* (Fin4) Discounted payback period of the investment project (in years). FS* (Fin5) Resistance of project to stressful price changes in. In response to
the high volatility of price in the oil market. The percentage of reduction of an oil price defined in the project is estimated at which the NPV equals zero. 1 is assigned for a rate of over 15%, 0 – for less than 15%.
Institutional factors Project type (Inst1,
Inst2, Inst 3, Inst4)
It characterizes the type of investment project being implemented in terms of its reproduction type. It is implemented by means of dummy variables: Inst1 – repairs, Inst2 – modernization, Inst 3 – renovation, Inst4 – new construction
Market risk level (Inst5, Inst6, Inst7)
Associated with the risk of failure of the project to achieve its targets due to unfavorable selling market conditions. The factor is determined by expertise and is point-based:
Inst5 = 1 – low risk, it is characterized by an expected demand increase in the target market, low level competition, viability of reorienting towards other markets
Inst6 = 1 – medium risk, stable demand, presence of several large competitors, likely difficulties in commercializing the products Inst7 = 1 – high risk, reduction in demand, concentrated market leaders presence, inability to sell products to third-party markets/ barriers to entry being present
Experience in implementing similar projects (Inst 8, Inst9, Ins10)
Inst8 = 1 – implemented more than 3 similar projects Inst9 = 1 – implemented from 1 to 3 such projects Inst10 = 1 – no such projects were implemented
* DSCR – Debt-Service Coverage Ratio, ER – equity ratio, IRR – internal rate of return, DPP – discounted payback period, FS – financial sustainability
assess the type of project, its marketing component, company’s and project team’s experience in the implementation of similar capital investments.
Using the logit-model results in a final ranking of investment projects according to their probability of default.
5 SELECTION OF DESCRIPTIVE RISK-PREDICTIVE FACTORS FOR A RATING-BASED MODEL
A set of factors defining the degree of exposure of project investments was identified on the basis of analyzing the research in the field of modeling an investment project’s risk of default.
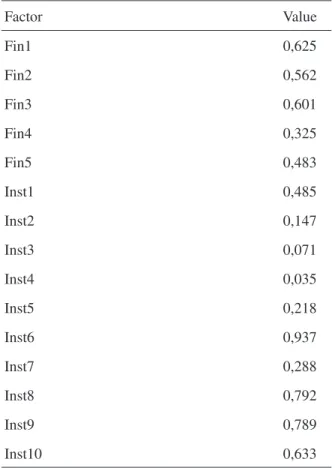
Due to the complexity of obtaining statistical data related to defaults (defaults cemetery) within the scope of this study the analysis was done based on the expert evaluation method. A survey in the form of a questionnaire was carried out asking heads of departments and units of a Russian oil and gas company to grade the specified risks according to a given scale [6]. The values obtained as a result of the study are summarized in the Table 2 below:
6 MODELING OF EXPOSURE AT DEFAULT
One of the main indicators, involved in the assessment of economic capital is the position at risk (EAD – exposure at default). The reliability of calculation of this index directly
Table 2: Estimation of parameters of the model of investment projects default probability.
Factor Value Fin1 0,625 Fin2 0,562 Fin3 0,601 Fin4 0,325 Fin5 0,483 Inst1 0,485 Inst2 0,147 Inst3 0,071 Inst4 0,035 Inst5 0,218 Inst6 0,937 Inst7 0,288 Inst8 0,792 Inst9 0,789 Inst10 0,633
determines the quality of the assessment of economic capital, which necessitates the develop-ment of EAD estimation methodology. Author’s model EAD estimates and of investdevelop-ment project takes into consideration the amount of unselected limit through a continuous random variable with the following formula (5)
EAD S S= C⋅ ⋅ϕT (5) where SC = current amount of implemented budget of investment project, ST – aggregate of investment project budget, ϕ – continuous random variable, ϕ∈[0,1].
In order to use the ϕ random variable in evaluating the EAD values it is necessary to carry
out a study of the law of distribution of empirical values of ϕ (6).
ϕi Ci Ci Fi S S S = + (6)
where ϕi = part of the amount of investment project, selected under the i project at the time
of default, SCi = amount of implemented investment budget under the i project at the time of default, SFi = balance of the amount of financing of the investment project under the i project at the time of default.
In order to study the distribution of the ϕi value, information on the amounts of investment
budget at the time of default and on balance of the amount of investment budget financing at 25 project companies was reviewed.
During this analysis a distribution of values of ϕi was plotted (Fig. 1). The horizontal axis
designates the proportion of investment project’s cost utilized for the i project at the time of default, while the vertical axis designates the proportion of measured values of ϕi attributable
to each interval. Our analysis of the graph shows that the distribution of values of ϕi has a
significant right-sided asymmetry, which manifests itself in the form of a long right-side branch, while the value of the average is less than the median or the mode. The right asymmetry indicates that the small values data is prevalent, while substantial portions of the investment project’s budget sample are much rarer, but they are significant in size.
Figure 1: Approximation of the ϕi values distribution by means of a lognormal distribution
This pattern of data distribution could be provided with an economic substantiation consisting in the fact that most of the risk is realized in the initial stages of an investment project’s implementation. In the case of an investment project achieving a considerable degree of com-pletion in relation to its budget development, the project is likely to receive additional financing within the scope of strategy of investment of owners’ equity, allowing it to reach full capacity and achieve its business plan’s targets.
Testing the distribution hypothesis for statistical significance with the Kolmogorov– Smirnov, Anderson–Darling and Chi-square tests did not produce any unambiguous results. Taking into account the differences of patterns of distribution and the error due to the small volume of observation samples, the lognormal distribution model was chosen based on an assessment of the empirical validity and accuracy of approximation for the distribution of values of ϕi. This distribution is widely used for modeling of attributes strongly affected by
high values and with a strong asymmetry in the direction of large low-frequency values. A lognormal distribution with the following parameters was obtained for the distribution of ϕi values: s = 0.72241; m = –1.8102.
Thus, the distribution of values of ϕi can be approximated by a lognormal distribution.
When estimating the EAD with the help of the formula 3.1, the ϕi can be assumed to be a
random variable distributed according to a lognormal law: ϕ~fX (1.8102; 0.72241).
The obtained results allow to apply the formula 3.1 practically in assessing the value of economic capital of an oil and gas company by means of a simulation method (Monte Carlo method) [16]. The algorithm of this EAD estimation method is shown in Fig. 2.
The first step of the algorithm is to estimate the parameters of distribution of ϕ values based
on the historical data. At this stage, the necessary σ and μ distribution parameters are
esti-mated. These parameters are used to generate random numbers at the algorithm’s next step. On the basis of these random numbers, a vector of EAD values is generated for each i investment project. On the basis of the generated random EAD values an assessment of the risk capital of oil and gas companies according to the Monte Carlo simulations method is carried out [12].
7 EVALUATION OF ECONOMIC CAPITAL, RAROC AND INVESTMENT DECISIONS
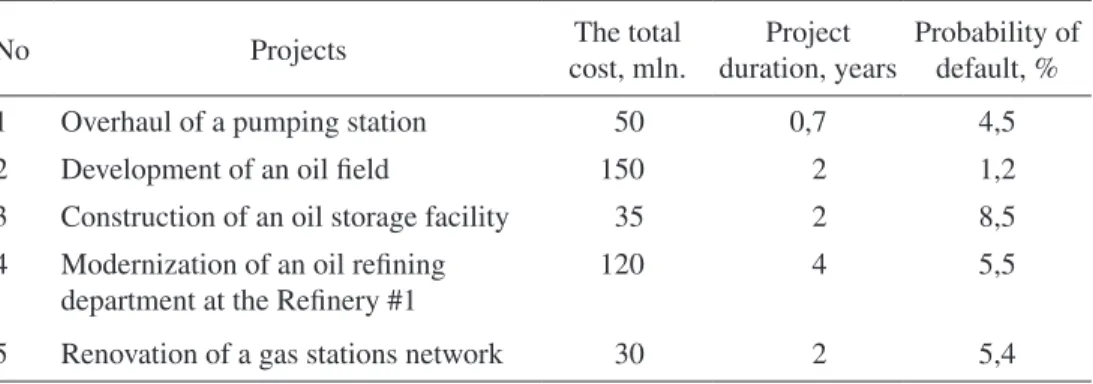
Let us assume an oil company’s investment program comprises 5 investment projects with their initial parameters as per Table 3.
The risk-adjusted managing of the value of business involves determining the target level of financial stability, which allows to maximize the value for a given level of risk exposure. This level of financial stability may be determined by the target long-term credit rating sought by the company. At this, value of the company and its development strategy become an important factor in the risk evaluation and risk management. Each credit rating can be assigned a certain level of probability of default, depending on the forecasting time-frame. One of the variants of correspondence between the rating and the probability of default is presented in Table 4 [10, 11].
The probability of default determines the confidence level necessary for estimating the amount of contingent losses and economic capital of an oil and gas company, which is calcu-lated according to the formula (7):
γ =1 PD− (7)
where γ = confidence level, which determines the likelihood of not defaulting, PD = level of
Figure 2: EAD estimation algorithm according to the simulation method (Monte Carlo method). Table 3: Main parameters of investment projects being implemented.
No Projects cost, mln.The total duration, yearsProject Probability of default, %
1 Overhaul of a pumping station 50 0,7 4,5
2 Development of an oil field 150 2 1,2
3 Construction of an oil storage facility 35 2 8,5
4 Modernization of an oil refining department at the Refinery #1
120 4 5,5
On the basis of distributions received LGD estimate is statistically different LGD basic parameters for each type of investment projects. The estimates are shown in Table 5.
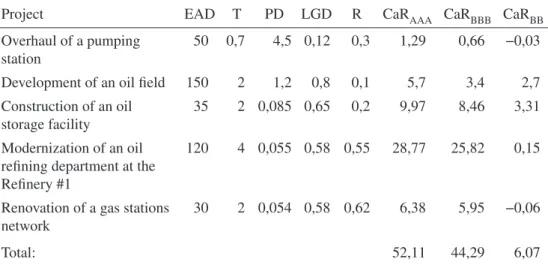
As a methodology for assessing the economic capital model is selected Merton–Vasicek [3, 4]. The main results of the model are presented in Table 6.
Table 4: Correspondence between the probability of default and the credit rating.
Rating 1-Y PD (%) 3-Y PD (%) 5-Y PD (%)
AAA 0.008 0.03 0.1 AA 0.04 0.16 0.28 A 0.16 0.4 0.58 BBB 0.3 1.4 3 BB 1.15 8.6 15 B 5.8 15.4 32.6
Table 5: Estimates of LGD for the main types of investment projects. Duration of the project/
Project type Overhaul (%) Modernization (%) New construction (%)
Short-term 12 45 65
Long-term 30 58 80
Table 6: Calculation of economic capital for different levels of financial stability.
Project EAD T PD LGD R CaRAAA CaRBBB CaRBB
Overhaul of a pumping station
50 0,7 4,5 0,12 0,3 1,29 0,66 −0,03
Development of an oil field 150 2 1,2 0,8 0,1 5,7 3,4 2,7 Construction of an oil
storage facility
35 2 0,085 0,65 0,2 9,97 8,46 3,31
Modernization of an oil refining department at the Refinery #1
120 4 0,055 0,58 0,55 28,77 25,82 0,15
Renovation of a gas stations network
30 2 0,054 0,58 0,62 6,38 5,95 −0,06
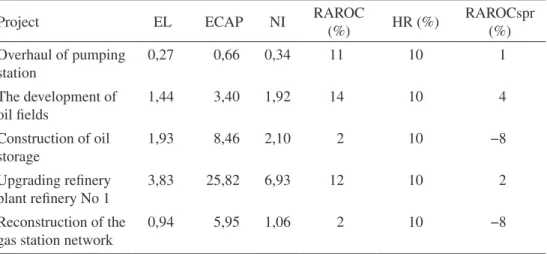
Let us estimate the RAROC for the purposes of taking decisions on the implementation of investment projects. Suppose that the target level of financial stability is determined by a BBB rating. RAROC estimation for each project is presented in Table 7.
Allocating of RAROC values to each investment project allows to determine those projects that create business value and those that destroy it. Thus, projects suitable for implementation comprise the pumping station overhaul, oil field development, oil refining department at refinery #1 modernization, while the oil storage facility’s construction and the renovation of a gas station network projects destroy business value, their implementation implies a high risk exposure and is impractical. Certainly, there is a number of projects of complex nature that are integrated into production processes, where the RAROC estimation can be made on a portfolio of investment projects, while the decision would be made on multiple portfolios of investment projects.
8 CONCLUSION
The concepts of value of business and of investment risk are closely related. Evaluating the effectiveness of investment projects in the modern economy is based not only on economic benefits, but also on the risks carried by this or that project. Thus, a class of problems related to the risk assessment of investment projects and evaluation of the risk of investing remains in the foreground. Author’s technique solves this problem based on the RAROC methodol-ogy, allowing to sift out the projects that do not lead to the creation of value. The data surveys are forward looking, and suggest areas for development. Therefore, it is advisable to deepen the investment segmentation in terms of models of PD and of development of a risk assess-ment models library project. An important area is the developassess-ment of RAROC status effectiveness zones. Moreover, the need to develop an approach to the assessment of invest-ment projects correlation with the general state of the economy, which involves the construction of a multifactor indicator, reveals the macroeconomic trends and their impact on investment activity.
Table 7: Estimation of RAROC for a portfolio of investment projects.
Project EL ECAP NI RAROC (%) HR (%) RAROCspr (%)
Overhaul of pumping station 0,27 0,66 0,34 11 10 1 The development of oil fields 1,44 3,40 1,92 14 10 4 Construction of oil storage 1,93 8,46 2,10 2 10 −8 Upgrading refinery plant refinery No 1 3,83 25,82 6,93 12 10 2 Reconstruction of the gas station network
REFERENCES
[1] Schroeck, G. & Marc, W., Calculation of risk-adjusted performance measures in credit markets. In Elektronische Dienstleistungswirtschaft und Financial Engineering—2, Internationale FAN-Tagung, Munster: Schuling Verlag, pp. 139–151, 1999.
[2] Schroeck, G., Risk Management and Value Creation in Financial Institutions, John Wiley & Sons - Business & Economics, p. 332, 2002.
[3] Merton, R.C., On the pricing of corporate debt: the risk structure of interest rates. Journal of Finance, 29, pp. 449–470, 1974.
http://dx.doi.org/10.1111/j.1540-6261.1974.tb03058.x
[4] Vasicek, O., Loan portfolio value. Credit Portfolio Models, 15, pp. 160–162, 2002. [5] Gorby, M.B., A risk-factor model foundation for rating-based bank capital rules.
Journal of Financial Intermediation, 25, pp. 199–232, 2003.
[6] Gmurman, V., Probability theory and mathematical statistics. High School, 1, p. 479, 1997.
[7] Domnikov, A., Khomenko, P. & Chebotareva, G., A risk-oriented approach to capital management at a power generation company in Russia. WIT Transactions on Ecology and the Environment, 1, pp. 13–24, 2014.
http://dx.doi.org/10.2495/ESUS140021
[8] Scannella, E., Bank lending in project finance: the new regulatory capital framework. International Journal of Economics and Finance, 5(1), pp. 218–229, 2013.
[9] Ohlson, J.A., Financial ratios and the probabilistic prediction of bankruptcy. Journal of Accounting Research, 18(1), pp. 109–131, 2012.
http://dx.doi.org/10.2307/2490395
[10] IAS 39 Financial Instruments: recognition and measurement.
[11] Basel II: International Convergence of Capital Measurement and Capital Standards: a Revised Framework (BCBS).
[12] Domnikov, A., Khodorovsky, M. & Khomenko, P., Optimization of finances into regional energy. Economy of Region, 2, pp. 248–253, 2014.
http://dx.doi.org/10.17059/2014-2-24
[13] Gurtler, M. & Heithecker, D., Multi-Period defaults and maturity effects oneconomic capital in a ratings-based default-mode model. Finanz Wirtschaft, 5, pp. 123–134, 2005. [14] Khodorovsky, M., Domnikov, A. & Khomenko, P., Optimization of financing
investments in a power-generation company. WIT Transactions on Ecology and the Environment, 190, pp. 45–54, 2014.
http://dx.doi.org/10.2495/EQ140061
[15] Peter, C., Estimating loss given default – experiences from banking practise. Springerlink, 2, pp. 143–175, 2006.
[16] Bellovary, J.L., Giacomino, D.E. & Akers, M.D., A review of bankruptcy prediction studies: 1930 to Present. Journal of Financial Education, 33, pp. 1–43, 2007.