Minnesota State Teacher Development,
Evaluation and Peer Support Model
Pilot: Initial Evaluation Report
February 2014
Evaluation Team:
Beverly Dretzke, PhD
Debra Ingram, PhD
Melissa Kwon, PhD
Kristin Peterson, MA
Timothy Sheldon, PhD
Kyla Wahlstrom, PhD
Research Assistants:
Anne Crampton
Shannon Dahmes
Kaitlyn Larabee
Alicia Lim
Center for Applied Research and Educational Improvement ii University of Minnesota
Contact Information
Center for Applied Research and Educational Improvement
College of Education and Human Development
University of Minnesota
1954 Buford Ave., Suite 425
St. Paul, MN 55108
Telephone: (612) 624-0300
Email: [email protected]
Please cite as:
Dretzke, B., Ingram, D., Kwon, M., Peterson, K., Sheldon, T., Wahlstrom, K., Crampton, A.,
Dahmes, S., Laribee, K., & Lim, A. College of Education and Human Development, Center for
Applied Research and Educational Improvement. (2014).
Minnesota state teacher development,
evaluation and peer support model pilot: Initial evaluation report
. Retrieved from University of
Minnesota website: http://www.cehd.umn.edu/CAREI/
Center for Applied Research and Educational Improvement iii University of Minnesota
Executive Summary
Minnesota Statutes 122A.40, Subdivision 8 and 122A.41, Subdivision 5 requires that districts begin evaluating teachers in the 2014-2015 school year. In response to the statute, the Minnesota Department of Education (MDE) convened a work group in early winter 2011 to consult with the MDE Commissioner to develop a state model for teacher growth and development. In winter 2013, MDE released the Minnesota State Teacher Development, Evaluation, and Peer Support Model (hereafter “Model”) and began planning for a pilot of the Model during the 2013-2014 school year (hereafter “Pilot”).
The Model consists of three components for evaluating teachers: 1) teacher practice, 2) student engagement, and 3) student learning and achievement. Sixteen school districts and one charter school from across Minnesota agreed to participate in the Pilot. Six of the districts are implementing the full Model (all three components) and nine districts are implementing one or two components (see Appendix I). The size of participating districts varies widely, from 287 students to 7,356 students.
In August 2013, the Joyce Foundation funded the University of Minnesota’s Center for Applied Research and Educational Improvement (CAREI) to conduct an evaluation of the Pilot. This report summarizes results of surveys and interviews conducted with Pilot participants during November and December 2013 and is the first of three reports. The report for the entire Pilot year will be available in August 2014, and a final report, which will include information on the value-added assessments (an element of the student learning and achievement component) will be submitted to the Joyce Foundation in December 2014. The data in this report are preliminary and encompass only the first three months of the school year; thus, readers should not over-generalize the findings or conclusions presented here. The purpose of this interim report is to provide formative feedback to MDE.
Data Sources and Response Rate. The data collected for this report are drawn from online surveys and in-depth interviews of summative evaluators (usually principals, other school administrators, and district leaders) and teachers. The summative evaluator survey was administered as an online questionnaire in 14 of 17 pilot districts in November and December 2013. The overall response rate was 68% (25 out of 37). The response rate for individual districts ranged from 0% to 100%, with 12 of the 14 districts having a response rate of 50% or greater. The teacher survey was administered in 14 of 17 pilot districts in November and December 2013. The overall response rate was 41% (293 out of 723). The response rate for individual districts ranged from 17% to 82%, with 8 of the 14 districts having a response rate of over 40%.
Fourteen summative evaluators were interviewed across eight districts in November and December 2013, and 40 teachers were interviewed across eight districts in the same time frame. A range of experience was represented, from first-year teachers to veteran teachers with 37 years of experience. There was an even distribution of elementary and secondary teachers who were interviewed (17 elementary, 17 secondary, and 10 middle school, with some overlap) along with a balance of classroom teachers and subject specialists.
Initial Findings
Training and Technical Support. On the whole, the summative evaluators were very impressed with the quality of the MDE trainings. They expressed a high level of satisfaction with the presentations, although they reported that the amount of information tended to overwhelm their teachers. Teachers echoed a similar sentiment in their interviews, expressing a desire to have training topics broken into shorter sessions.
Center for Applied Research and Educational Improvement iv University of Minnesota
Eighty-six percent of teachers stated they attended the MDE training and 55% of those respondents stated that the MDE training provided adequate guidance for developing their Individual Growth and
Development Plan. The majority of teachers, 77%, referenced the Handbook and reported it provided adequate guidance while working on their Individual Growth and Development Plan.
Implementation of the Pilot. Teachers expressed support for the way in which the Model and a statewide teacher evaluation system in general serves as a stimulus for districts to provide professional development. At the same time, teachers also expressed serious concerns about the sustainability of the Model with the limited funds available for professional development and release time for peer reviewers. Teachers noted the heavy burden placed on principals as summative evaluators.
Comments that came out in interviews with summative evaluators acknowledged that their own
enthusiasm in implementing the Model had a strong positive effect on the perceptions of faculty and staff about the Model.
Individual Growth and Development Plan. Almost all teachers, whether surveyed or interviewed, reported that they had made some progress toward completing their Individual Growth and Development Plans, although more than half the teachers described their work as partially complete. About two-thirds of teachers surveyed found the performance standards rubric useful for identifying areas for professional growth, and an equal number of teachers responded that it was an effective tool for identifying areas of instructional practice that could be evaluated.Teachers interviewed found the Individual Growth and Development Plan form to be clear, and for many, it was familiar because they had written similar growth plans in the past. Most teachers consulted with at least one colleague while developing their Individual Growth and Development Plan and reported this collaboration as helpful.
Points of Contact. Half of the summative evaluators surveyed and interviewed indicated that they had planned their points of contact. This was consistent with the responses from teachers about points of contact with summative evaluators. Fewer than half of summative evaluators had completed any points of contact at the time of the survey and interviews. Both summative evaluators and teachers expressed concern about the time necessary for completing points of contact going forward.
Over half of the teachers surveyed had decided on points of contact with their peer reviewers, and over one-third of teachers surveyed reported they had completed one point of contact with a peer reviewer. Again, both summative evaluators and teachers had concerns about the time needed to complete points of contact with peer reviewers. During interviews, teachers and summative evaluators alike expressed hopes for increased collaboration through the peer reviewer relationship.
Student Learning Goals. Summative evaluators whose buildings had selected school-wide Student Learning Goals found that the uniformity of the goal made developing and approving these goals
manageable. In settings where there was a building-wide goal, summative evaluators had high completion rates with their teachers and expressed satisfaction with the process. Roughly half of the teachers
surveyed and interviewed had either completed or made some progress on developing their Student Learning Goals. Over half of teachers surveyed indicated that they had benefitted from consulting with a peer reviewer while developing their Student Learning Goals. Interviewed teachers talked positively about how they used student data to set starting points and decide upon benchmarks.
However, many summative evaluators found that their specialist teachers and non-teaching staff struggled much more to adapt the Student Learning Goals for their situations. This frustration was echoed in the interviews with specialist teachers and non-teaching staff whose goals could not easily be connected to a wider building goal and whose number of students made designating Student Learning Goals a challenge.
Center for Applied Research and Educational Improvement v University of Minnesota
Table of Contents
Introduction ... 1
Summative Evaluator Implementation Survey ... 2
Teacher Implementation Survey ... 18
Teacher Beliefs Survey ... 31
Summative Evaluator Interviews ... 33
Teacher Interviews ... 43
Summary ... 56
Center for Applied Research and Educational Improvement vi University of Minnesota
Tables
Table 1. Number of teachers in your building(s) participating in the Pilot ... 3 Table 2. Grade levels housed in summative evaluator building(s) ... 3 Table 3. Number of teachers’ Individual Growth and Development Plans summative evaluators have reviewed and approved ... 4 Table 4. Number of hours summative evaluators spent reviewing and approving teachers’ Individual Growth and Development Plans ... 4 Table 5. Number of participating teachers for which summative evaluators have decided on points of contact ... 5 Table 6. Number of participating teachers for which summative evaluators have carried out any points of contact and completed a points of contact form ... 5 Table 7. Total hours summative evaluators have spent working on points of contact... 6 Table 8. Number of teachers’ Student Learning Goals forms summative evaluators have reviewed and approved ... 6 Table 9. Total hours summative evaluators spent working on teachers’ Student Learning Goals forms ... 7 Table 10. Types of training and information sessions that took place for teachers participating in the Pilot ... 7 Table 11. Number of hours summative evaluators have spent in MDE information and/or planning
sessions ... 8 Table 12. Number of hours summative evaluators spent attending MDE summative evaluator training sessions ... 8 Table 13. Number of hours summative evaluators spent attending MDE teacher training sessions ... 9 Table 14. Number of hours summative evaluators spent attending district-sponsored sessions related to the Pilot ... 9 Table 15. Number of hours summative evaluators spent attending building-sponsored sessions related to the Pilot ... 10 Table 16. Number of hours summative evaluators spent attending PLC and/or grade level meetings related to the Pilot ... 10 Table 17. Total hours summative evaluators have spent developing these materials ... 11 Table 18. Summative evaluators’ perspectives of how well the Model works for evaluating specialist teachers ... 11 Table 19. Summative evaluators’ perspectives of how well the Model works for evaluating
Center for Applied Research and Educational Improvement vii University of Minnesota
Table 20. Summative evaluators’ perspectives of how well the Model works for evaluating mid-career
teachers ... 12
Table 21. Summative evaluators’ perspectives of how well the Model works for evaluating late-career teachers ... 12
Table 22. Summative evaluators’ perspectives of how well the Model works for evaluating part-time teachers ... 13
Table 23. Summative evaluators’ perspectives of how well the Model works for evaluating teachers who teach in more than one school in the district ... 13
Table 24. Summative evaluators’ overall satisfaction with the training received from MDE for the Pilot ... 14
Table 25. Summative evaluators’ overall satisfaction with the communication they had with MDE staff regarding the Pilot ... 14
Table 26. Summative evaluators’ overall satisfaction with the Minnesota State Teacher Development, Evaluation, and Peer Support Model ... 15
Table 27. Summative evaluators’ rating of the Model's ability to provide a valid assessment of a teacher's performance... 15
Table 28. Teachers’ progress on their Individual Growth and Development Plans ... 18
Table 29. Teachers’ progress on points of contact ... 19
Table 30. Teachers’ progress on Student Learning Goals. ... 19
Table 31. Amount of time spent by teachers on the implementation of Model components ... 20
Table 32. Teachers’ references while developing the Individual Growth and Development Plan ... 21
Table 33. Teachers’ ratings on the usefulness of the Handbook and training in developing their plan and the perceived benefits of the process of developing their professional growth plans ... 21
Table 34. Teachers’ consultants while developing the Individual Growth and Development Plan ... 22
Table 35. Other write-in responses for teachers’ consultants while developing the Individual Growth and Development Plan ... 22
Table 36. Teachers’ perception of whether or not it was beneficial to consult with someone when developing the Individual Growth and Development Plan ... 22
Table 37. Teachers’ views on the difficulty level in developing the Individual Growth and Development Plan ... 23
Table 38. Teachers’ views on the effectiveness of performance standards for teacher rubric ... 23
Table 39. Individuals whom teachers consulted with while developing their Student Learning Goals...24
Table 40. Teachers’ perceived benefits of the consultants that were utilized in developing their Student Learning Goals ... 24
Center for Applied Research and Educational Improvement viii University of Minnesota
Table 41. Teachers’ ratings on the usefulness of the Handbook and training in developing their Student
Learning Goals ... 25
Table 42. Teachers’ completion rates associated with the components of the Student Learning Goals ... 25
Table 43. Teachers’ views on the difficulty of developing their Student Learning Goals... 26
Table 44. Methods that teachers reported they will use to assess Student Engagement ... 27
Table 45. Teachers’ overall satisfaction with the Minnesota State Teacher Development, Evaluation, and Peer Support Model ... 27
Table 46. Teachers’ rating of the Model's ability to provide a valid assessment of a teacher's performance ... 28
Table 47. Teaching level of teacher beliefs survey respondents ... 32
Table 48. Summative evaluator interviews by district/school ... 33
Table 49. Teacher interviews by district ... 43
Table 50. Characteristics of teacher interview participants ... 43
Appendices
Appendix A: Summative Evaluator Implementation Survey Instrument ... 59Appendix B: Teacher Implementation Survey Instrument ... 65
Appendix C: Teacher Beliefs Survey Instrument ... 74
Appendix D: Summative Evaluator Implementation Survey Response Rate Information ... 77
Appendix E: Teacher Implementation Survey Response Rate Information ... 78
Appendix F: Teacher Beliefs Survey Response Rate Information ... 79
Appendix G: Summative Evaluator Implementation Survey Item Response Frequency Tables ... 80
Appendix H: Teacher Implementation Survey Item Response Frequency Tables ... 92
Appendix I: Participating Districts Map ... 106
Appendix J: Summative Evaluator Interview Protocol ... 107
Center for Applied Research and Educational Improvement 1 University of Minnesota
Introduction
Minnesota Statutes 122A.40, Subdivision 8 and 122A.41, Subdivision 5 requires that districts begin evaluating teachers in the 2014-2015 school year. In response to the statute, the Minnesota Department of Education (MDE) convened a work group in early winter 2011 to consult with the MDE Commissioner to develop a state model for teacher growth and development. In winter 2013, MDE released the Minnesota State Teacher Development, Evaluation, and Peer Support Model (hereafter “Model”) and began planning for a pilot of the Model during the 2013-2014 school year (hereafter “Pilot”).
The Model consists of three components for evaluating teachers: 1) teacher practice, 2) student engagement, and 3) student learning and achievement. Sixteen school districts and one charter school from across Minnesota agreed to participate in the Pilot. Six of the districts are implementing the full Model (all three components) and nine districts are implementing one or two components (see Appendix I). The size of participating districts varies widely, from 287 students to 7,356 students.
In August 2013, the Joyce Foundation funded the University of Minnesota’s Center for Applied Research and Educational Improvement (CAREI) to conduct an evaluation of the Pilot. This report summarizes results of surveys and interviews conducted with Pilot participants during November and December 2013.
Center for Applied Research and Educational Improvement 2 University of Minnesota
Summative Evaluator Implementation Survey
Method
Participants and Response Rate
The summative evaluator implementation survey was administered as an online questionnaire. All 17 districts were contacted for summative evaluator email address information. Fourteen of the 17 districts responded to the request, and, between November 20 and November 25, 2013, a link to the questionnaire was emailed to 37 summative evaluators representing these 14 districts. The number of summative evaluators receiving the survey per district ranged from one to seven. No summative evaluators elected to ‘opt-out’ of the survey, and all messages reached the addressees (no email bounces). On December 2, 2013, eight days after the initial email message, a reminder email was sent to 19 non-respondents. On December 16, 2013, the link to the survey was closed. The overall response rate was 68% (25 out of 37). The response rate for individual districts ranged from 0% to 100%, with 12 of the 14 districts having a response rate of 50% or greater (see Appendix D).
Survey Instrument
The questionnaire was designed to gather information on the summative evaluators’ perspectives on the usefulness of the Teacher Development, Evaluation, and Peer Support Model: Implementation
Handbook, sources of support they received, level of support they received, progress towards completing specific tasks, and overall evaluation of the Model. Various six-point response scales were used to collect summative evaluator responses. The questionnaire also included items regarding background information about the building site including: number of teachers in the building, number of summative evaluators in the building, and grade level(s) housed in the building. In addition, one open-ended item at the end of the questionnaire provided the opportunity for summative evaluators towrite any comments or suggestions they had regarding the Model. The survey instrument can be found in Appendix A.
Results of the Summative Evaluator Implementation Survey
The summative evaluators’ responses represent their progress and thoughts three months into the first semester of the 2013-14 school year. Note that findings reported here are based on the response rate for each question. Detailed information regarding the summative evaluators’ responses can be found in Appendix G.
Background
Most respondents indicated that there were either one (56%) or two (32%) summative evaluators in their buildings. Only 8% said that their buildings had four or more summative evaluators.
The summative evaluators reported that the number of Pilot teachers in their buildings ranged from 4 to 90, with a mean of 29.9 (SD = 21.4). Table 1 presents a grouped frequency summary of the number of Pilot teachers in the summative evaluators’ buildings.
Center for Applied Research and Educational Improvement 3 University of Minnesota
Table 1. Number of teachers in your building(s) participating in the Pilot (N=25)
No. of Teachers Frequency %
1-10 6 24.0 11-20 2 8.0 21-30 6 24.0 31-40 5 20.0 41-50 2 8.0 51-60 2 8.0 More than 60 2 8.0
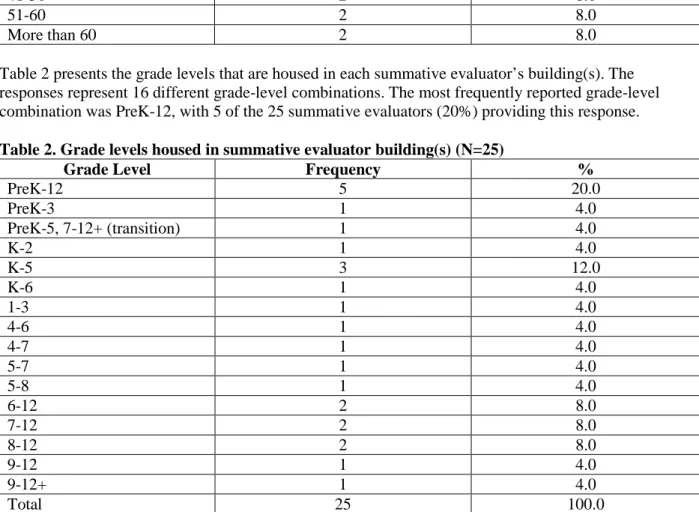
Table 2 presents the grade levels that are housed in each summative evaluator’s building(s). The responses represent 16 different grade-level combinations. The most frequently reported grade-level combination was PreK-12, with 5 of the 25 summative evaluators (20%) providing this response.
Table 2. Grade levels housed in summative evaluator building(s) (N=25)
Grade Level Frequency %
PreK-12 5 20.0 PreK-3 1 4.0 PreK-5, 7-12+ (transition) 1 4.0 K-2 1 4.0 K-5 3 12.0 K-6 1 4.0 1-3 1 4.0 4-6 1 4.0 4-7 1 4.0 5-7 1 4.0 5-8 1 4.0 6-12 2 8.0 7-12 2 8.0 8-12 2 8.0 9-12 1 4.0 9-12+ 1 4.0 Total 25 100.0
Center for Applied Research and Educational Improvement 4 University of Minnesota
Individual Growth and Development Plans
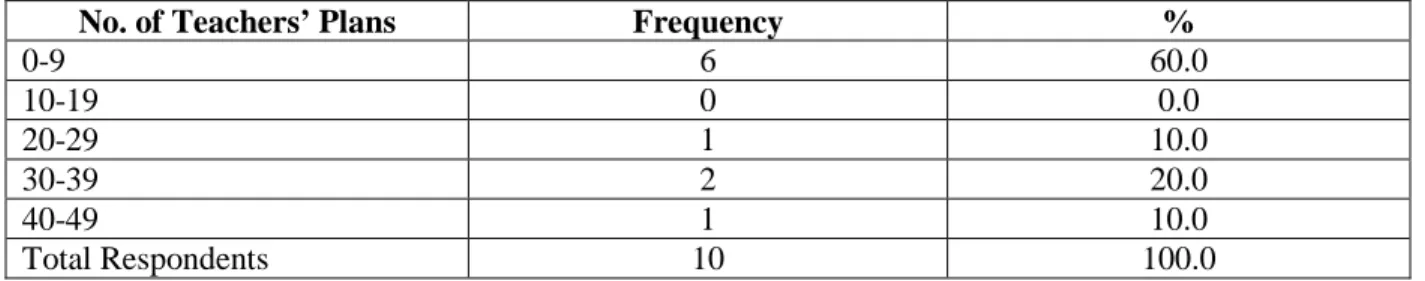
Summative evaluators were asked questions about the work they had completed to date on their teachers’ Individual Growth and Development Plans. Ten summative evaluators responded to these questions. Responses regarding the number of plans that, to date, had been reviewed and approved ranged from 0 to 46, with an average of 14.1 (SD = 17.6). The most frequently occurring response, provided by four of the ten summative evaluators, was zero. Table 3 presents a grouped frequency summary of the number of plans that had been reviewed and approved.
Table 3. Number of teachers’ Individual Growth and Development Plans summative evaluators have reviewed and approved (N=10)
No. of Teachers’ Plans Frequency %
0-9 6 60.0 10-19 0 0.0 20-29 1 10.0 30-39 2 20.0 40-49 1 10.0 Total Respondents 10 100.0
Responses regarding how many hours they had spent reviewing and approving their teachers’ Individual Growth and Development Plans ranged from 0 to 50 hours, with a mean of 12.4 (SD=16.8). The most frequently occurring response, provided by four of the ten summative evaluators, was zero hours. Table 4 presents a grouped frequency summary of the number of hours spent by summative evaluators reviewing and approving their teachers’ plans.
Table 4. Number of hours summative evaluators spent reviewing and approving teachers’ Individual Growth and Development Plans (N=10)
Hours Frequency % 0-9 6 60.0 10-19 1 10.0 20-29 1 10.0 30-39 1 10.0 40-49 0 0.0 50-59 1 10.0 Total Respondents 10 100.0
Center for Applied Research and Educational Improvement 5 University of Minnesota
Points of Contact
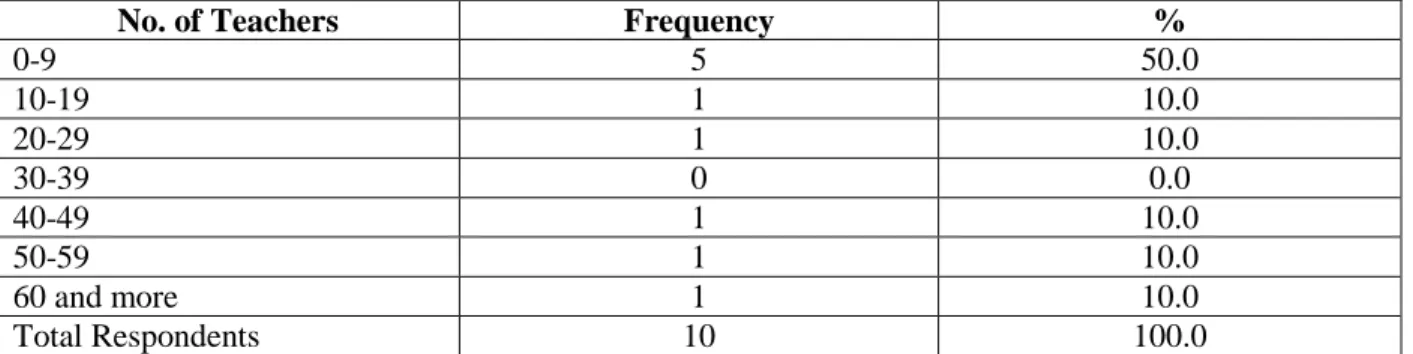
Summative evaluators were asked the number of teachers for whom they had arranged for points of contact. Ten summative evaluators responded to this question. Responses ranged from 0 to 64 teachers, with a mean of 19.4 (SD=23.8). The most frequently occurring response, provided by four of the ten summative evaluators, was zero. Table 5 presents a grouped frequency summary of the responses.
Table 5. Number of participating teachers for which summative evaluators have decided on points of contact (N=10)
No. of Teachers Frequency %
0-9 5 50.0 10-19 1 10.0 20-29 1 10.0 30-39 0 0.0 40-49 1 10.0 50-59 1 10.0 60 and more 1 10.0 Total Respondents 10 100.0
Ten summative evaluators responded to the question: For how many participating teachers have you carried outany Points of Contact and completed a Points of Contact form. The mean response was 1.4 teachers (SD=2.7), and the range was 0 to 7. The most frequently occurring response was zero teachers, provided by seven of the ten summative evaluators (see Table 6).
Table 6. Number of participating teachers for which summative evaluators have carried out any points of contact and completed a points of contact form (N=10)
No. of Teachers Frequency %
0 7 70.0 1 1 10.0 2 0 0.0 3 0 0.0 4 0 0.0 5 0 0.0 6 1 10.0 7 1 10.0 Total Respondents 10 100.0
Center for Applied Research and Educational Improvement 6 University of Minnesota
When asked to estimate the number of hours they had spent working on points of contact, responses given by the ten summative evaluators ranged from 0 to 28 hours, with a mean of 9.9 hours (SD = 9.1). The most commonly occurring response was zero hours, provided by three summative evaluators. Table 7 provides a grouped frequency summary of the responses.
Table 7. Total hours summative evaluators spent working on points of contact (N=10)
Hours Frequency % 0-4 3 30.0 5-9 2 20.0 10-14 1 10.0 15-19 3 30.0 20-24 0 0.0 25-29 1 10.0 Total Respondents 10 100.0
Student Learning Goals
The summative evaluators were asked how many teachers’ Student Learning Goals they had reviewed and approved and how much time they had spent working on their teachers’ Student Learning Goals. Responses regarding number of teachers’ Goals reviewed and approved ranged from 0 to 40, with a mean of 6.7 (SD=12.4). The most commonly occurring response was zero, provided by 8 of the 17 summative evaluators who responded to the question. See Table 8 for a grouped frequency summary of the
responses.
Table 8. Number of teachers’ Student Learning Goals forms summative evaluators you reviewed and approved (N=17)
No. of Teachers’ Forms Frequency %
0-4 12 70.6 5-9 2 11.8 10-14 0 0.0 15-19 0 0.0 20-24 1 5.9 25-29 0 0.0 30-39 1 5.9 40-49 1 5.9 Total Respondents 17 100.1
Center for Applied Research and Educational Improvement 7 University of Minnesota
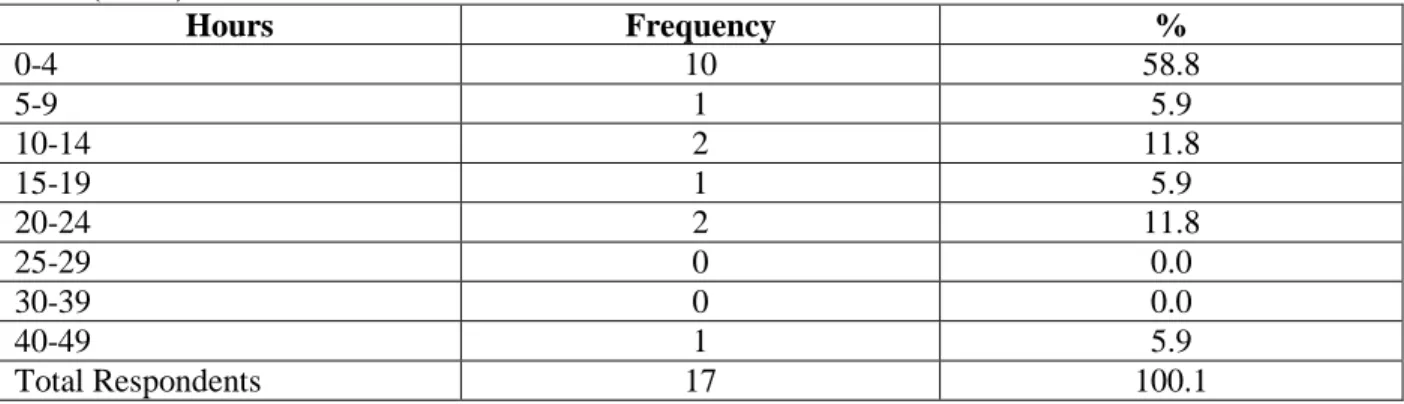
Estimates of the total time they had spent working on teachers’ Student Learning Goals ranged from 0 to 40 hours, with a mean of 7.9 hours (SD=10.9). The most frequently occurring response was zero hours, given by 6 of the 17 respondents. See Table 9 for a grouped frequency summary of the responses.
Table 9. Total hours summative evaluators spent working on teachers’ Student Learning Goals forms (N=17) Hours Frequency % 0-4 10 58.8 5-9 1 5.9 10-14 2 11.8 15-19 1 5.9 20-24 2 11.8 25-29 0 0.0 30-39 0 0.0 40-49 1 5.9 Total Respondents 17 100.1
Communication and Training
The summative evaluators were asked several questions about communication and training. One of these questions concerned the types of training and information sessions related to the Pilot that took place for teachers. Eighty percent reported that teachers had participated in district-sponsored training sessions, 72% reported that teachers had participated in MDE training sessions, 72% reported that teachers
participated in PLC and/or grade-level meetings, and 68% indicated that teachers participated in building-sponsored sessions. In addition, 8% stated that no training or information sessions related to the Pilot had yet taken place for the teachers in their buildings. See Table 10 for response frequencies.
Table 10. Types of training and information sessions that took place for teachers participating in the Pilot (Check all that apply) (N=25)
Responses Frequency %
District-sponsored sessions
related to the Pilot 20 80.0
MDE training sessions 18 72.0
PLC and/or grade-level
meetings related to the Pilot 18 72.0
Building-sponsored sessions
related to the Pilot 17 68.0
No training and information
sessions indicated 2 8.0
Total Respondents 25 *
Center for Applied Research and Educational Improvement 8 University of Minnesota
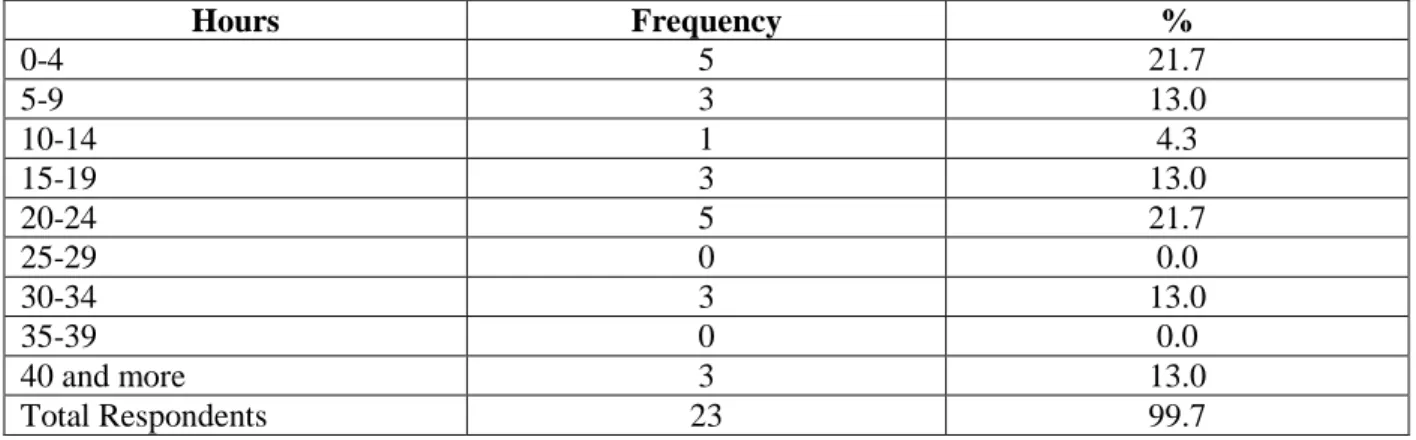
The summative evaluators were asked seven questions regarding the amount of time they personally had spent in various types of training and information sessions related to the Pilot. The summative evaluators’ responses regarding time spent in MDE information and/or planning sessions ranged from 0 to 60 hours, with a mean of 18.3 hours (SD=15.1). The most frequently occurring response was 20 hours, provided by 5 of the 23 respondents. Table 11 provides a grouped frequency summary of the summative evaluators’ responses.
Table 11. Number of hours summative evaluators spent in MDE information and/or planning sessions (N=23) Hours Frequency % 0-4 5 21.7 5-9 3 13.0 10-14 1 4.3 15-19 3 13.0 20-24 5 21.7 25-29 0 0.0 30-34 3 13.0 35-39 0 0.0 40 and more 3 13.0 Total Respondents 23 99.7
The mean response regarding how much time they had personally spent attending MDE summative evaluator training sessions was 6.2 hours (SD=4.9). There was a tie for the most frequent response with five summative evaluators indicating they had spent zero hours and five summative evaluators reporting they had spent eight hours. See Table 12 for a grouped frequency summary of the responses.
Table 12. Number of hours summative evaluators spent attending MDE summative evaluator training sessions (N=23) Hours Frequency % 0-2 7 30.4 3-5 3 13.0 6-8 7 30.4 9-11 3 13.0 12-14 1 4.3 15-17 2 8.7 Total Respondents 23 99.8
Center for Applied Research and Educational Improvement 9 University of Minnesota
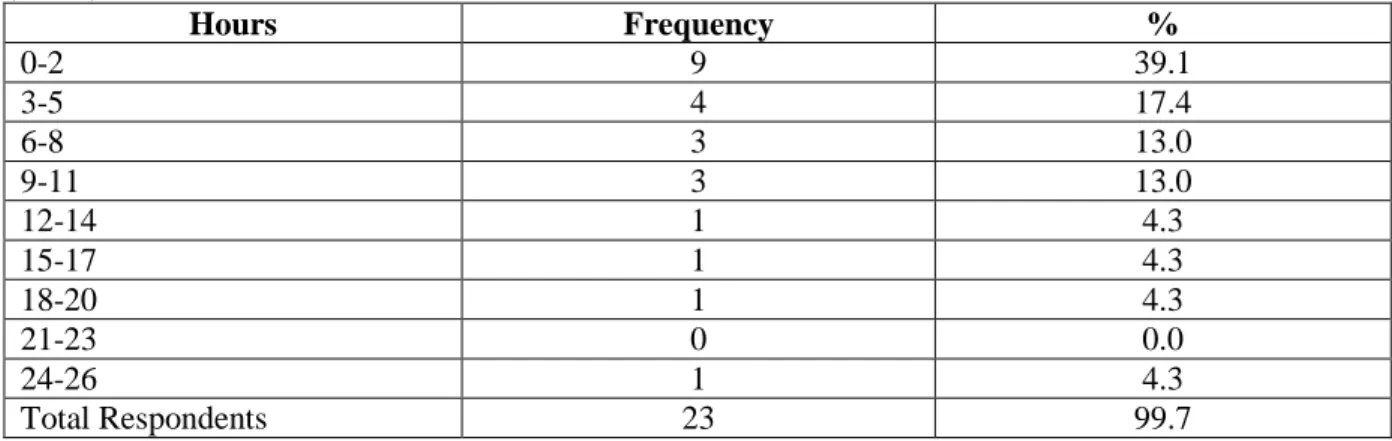
The mean response regarding time spent attending MDE teacher training sessions was 6.3 hours (SD=6.8). The range was 0 to 24 hours. The most frequently occurring response was zero hours, provided by 8 of the 23 respondents. See Table 13 for a grouped frequency summary of the responses.
Table 13. Number of hours summative evaluators spent attending MDE teacher training sessions (N=23) Hours Frequency % 0-2 9 39.1 3-5 4 17.4 6-8 3 13.0 9-11 3 13.0 12-14 1 4.3 15-17 1 4.3 18-20 1 4.3 21-23 0 0.0 24-26 1 4.3 Total Respondents 23 99.7
Responses regarding the time summative evaluators had personally spent attending district-sponsored sessions ranged from 0 to 75 hours, with a mean of 12.4 hours (SD=16.5). The most frequently occurring response was six hours, provided by three respondents. See Table 14 for a grouped frequency summary of the responses.
Table 14. Number of hours summative evaluators spent attending district-sponsored sessions related to the Pilot (N=23)
Hours Frequency % 0-2 4 17.4 3-5 6 26.1 6-8 4 17.4 9-11 1 4.3 12-14 1 4.3 15-17 2 8.7 18-20 2 8.7 21 and more 3 13.0 Total Respondents 23 99.9
Center for Applied Research and Educational Improvement 10 University of Minnesota
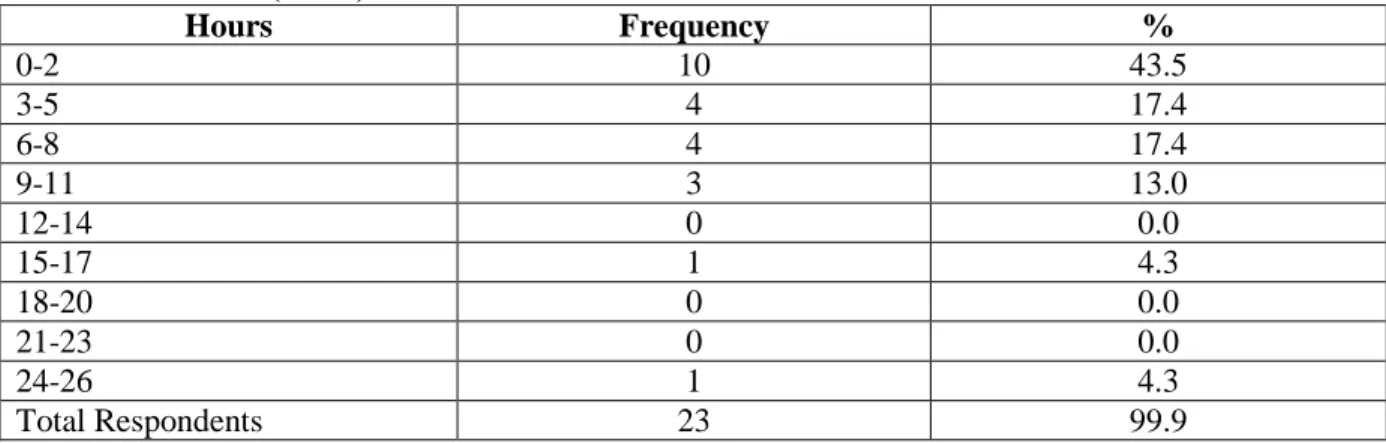
Estimates of time spent attending building-sponsored sessions related to the Pilot ranged from 0 to 25 hours, with a mean of 5.3 hours (SD=6.0). The most frequently occurring response was zero hours, provided by six of the summative evaluators. See Table 15 for a grouped frequency summary of the responses.
Table 15. Number of hours summative evaluators spent attending building-sponsored sessions related to the Pilot (N=23)
Hours Frequency % 0-2 10 43.5 3-5 4 17.4 6-8 4 17.4 9-11 3 13.0 12-14 0 0.0 15-17 1 4.3 18-20 0 0.0 21-23 0 0.0 24-26 1 4.3 Total Respondents 23 99.9
The summative evaluators’ estimates of time spent attending PLC and/or grade level meetings related to the Pilot ranged from 0 to 20 hours with a mean of 4.0 hours (SD=5.0). The most common response was zero hours, provided by 7 of the 23 respondents. See Table 16 for a grouped frequency summary of the responses.
Table 16. Number of hours summative evaluators spent attending PLC and/or grade level meetings related to the Pilot (N=23)
Hours Frequency % 0-2 13 56.5 3-5 4 17.4 6-8 2 8.7 9-11 2 8.7 12-14 1 4.3 15-17 0 0.0 18-20 1 4.3 Total Respondents 23 99.9
Center for Applied Research and Educational Improvement 11 University of Minnesota
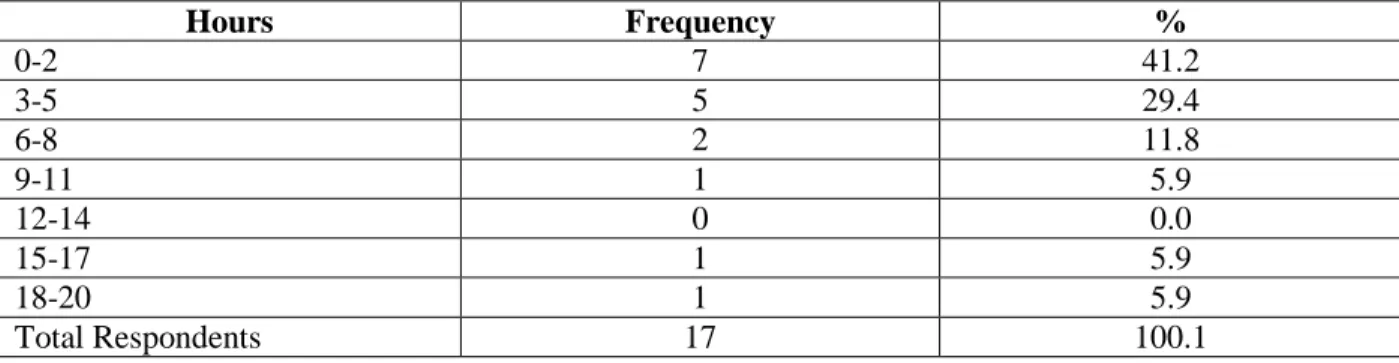
Approximately two-thirds (65%) of the 23 respondents said that they had personally developed materials (e.g., memos, announcements) to inform teachers about the Pilot. The remaining one-third said they had not developed any materials. Summative evaluators were asked, as a follow-up question, to estimate the total hours they had spent developing the materials. Time estimates ranged from 0 to 20 hours. The mean number of hours spent developing materials was 5.0 hours (SD=5.5). See Table 17 for a grouped
frequency summary of the responses.
Table 17. Total hours summative evaluators have spent developing these materials (N=17)
Hours Frequency % 0-2 7 41.2 3-5 5 29.4 6-8 2 11.8 9-11 1 5.9 12-14 0 0.0 15-17 1 5.9 18-20 1 5.9 Total Respondents 17 100.1
Satisfaction with the Model
The summative evaluators were asked a series of questions about their satisfaction with the Model. Tables 19 through 24 below present summative evaluators’ opinions of how well the Model works for evaluating specialist teachers, probationary teachers, mid-career teachers, late-career teachers, part-time teachers, and teachers who teach in more than one school in the district.
Evaluating specialist teachers. The summative evaluators indicated that they felt the Model was poor (30%), fair (30%), or good (30%) with respect to evaluating specialist teachers. No summative evaluators thought it was very good or excellent. See Table 18 for response frequencies.
Table 18. Summative evaluators’ perspectives of how well the Model works for evaluating specialist teachers (N=23) Responses Frequency % Poor 7 30.4 Fair 7 30.4 Good 7 30.4 Very good 0 0.0 Excellent 0 0.0 N/A 2 8.7 Total Respondents 23 99.9
Center for Applied Research and Educational Improvement 12 University of Minnesota
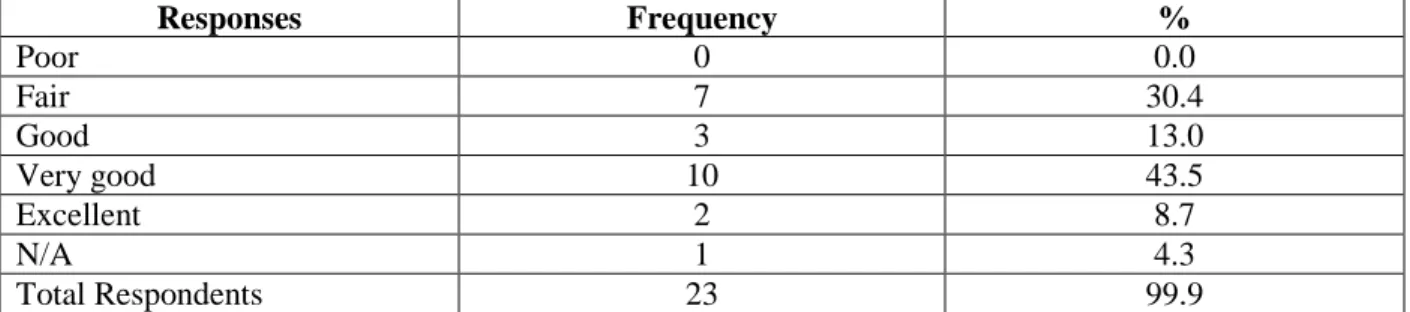
Evaluating probationary teachers. Overall, the summative evaluators thought the Model worked well for evaluating probationary teachers. The most frequent response was very good (44%), and no
summative evaluators said it was poor. See Table 19 for response frequencies.
Table 19. Summative evaluators’ perspectives of how well the Model works for evaluating probationary teachers (N=23) Responses Frequency % Poor 0 0.0 Fair 7 30.4 Good 3 13.0 Very good 10 43.5 Excellent 2 8.7 N/A 1 4.3 Total Respondents 23 99.9
Evaluating mid-career teachers. A majority of summative evaluators thought the Model was good (48%) or very good (35%) for evaluating mid-career teachers. See Table 20 for response frequencies.
Table 20. Summative evaluators’ perspectives of how well the Model works for evaluating mid-career teachers (N=23) Responses Frequency % Poor 1 4.3 Fair 2 8.7 Good 11 47.8 Very good 8 34.8 Excellent 1 4.3 N/A 0 0.0 Total Respondents 23 99.9
Evaluating late-career teachers. A majority of the summative evaluators thought the Model was either good (39%) or very good (39%) for evaluating late-career teachers. See Table 21 for response
frequencies.
Table 21. Summative evaluators’ perspectives of how well the Model works for evaluating late-career teachers (N=23) Responses Frequency % Poor 1 4.3 Fair 3 13.0 Good 9 39.1 Very good 9 39.1 Excellent 1 4.3 N/A 0 0.0 Total Respondents 23 99.8
Center for Applied Research and Educational Improvement 13 University of Minnesota
Evaluating part-time teachers. Summative evaluators’ responses indicated that they thought the Model did not work as well for evaluating part-time teachers as it did for evaluating other categories of teachers. The 23 respondents who answered the question about part-time teachers rated the Model as good (30%) or fair (22%) for evaluating part-time teachers. See Table 22 for response frequencies.
Table 22. Summative evaluators’ perspectives of how well the Model works for evaluating part-time teachers (N=23) Responses Frequency % Poor 2 8.7 Fair 5 21.7 Good 7 30.4 Very good 3 13.0 Excellent 1 4.3 N/A 5 21.7 Total Respondents 23 99.8
Evaluating teachers who teach in more than one school in the district. The most common ratings given to the Model for evaluating teachers who teach in more than one school in the district were good (26%) or fair (22%). See Table 23 for response frequencies.
Table 23. Summative evaluators’ perspectives of how well the Model works for evaluating teachers who teach in more than one school in the district (N=23)
Responses Frequency % Poor 3 13.0 Fair 5 21.7 Good 6 26.1 Very good 3 13.0 Excellent 1 4.3 N/A 5 21.7 Total Respondents 23 99.8
Center for Applied Research and Educational Improvement 14 University of Minnesota
Overall Satisfaction
Finally, summative evaluators were asked to provide overall satisfaction ratings regarding training provided by MDE, communication with MDE, and the Model. They were also asked specifically to rate the Model’s ability to provide a valid assessment of a teacher’s performance. Tables 24 through 27 display summative evaluators’ responses to these questions.
With respect to their overall satisfaction with training received from MDE for the Pilot, a majority of summative evaluators reported being satisfied (54%). See Table 24 for response frequencies.
Table 24. Summative evaluators’ overall satisfaction with the training received from MDE for the Pilot (N=24)
Responses Frequency %
Very dissatisfied 3 12.5
Dissatisfied 3 12.5
Neither dissatisfied nor satisfied 1 4.2 Satisfied 13 54.2 Very satisfied 3 12.5 N/A 1 4.2 Total Respondents 24 100.0
Regarding their satisfaction with the communication they had with MDE staff regarding the Pilot, the summative evaluators were fairly equally divided among the responses of neither dissatisfied nor satisfied (29%), satisfied (21%), and very satisfied (29%). Fewer respondents indicated they were very dissatisfied (4%) or dissatisfied (8%). See Table 25 for response frequencies.
Table 25. Summative evaluators’ overall satisfaction with the communication they had with MDE staff regarding the Pilot (N=24)
Responses Frequency %
Very dissatisfied 1 4.2
Dissatisfied 2 8.3
Neither dissatisfied nor satisfied 7 29.2 Satisfied 5 20.8 Very satisfied 7 29.2 N/A 2 8.3 Total Respondents 24 100.0
Center for Applied Research and Educational Improvement 15 University of Minnesota
The summative evaluators were asked how satisfied they were overall with the Minnesota State Teacher Development, Evaluation, and Peer Support Model. Exactly half of the 24 respondents said they were neither dissatisfied nor satisfied. The responses of summative evaluators who indicated a level of satisfaction tended to be more somewhat more positive (29% satisfied or very satisfied) than negative 21% dissatisfied or very dissatisfied), a See Table 26 for response frequencies.
Table 26. Summative evaluators’ overall satisfaction with the Minnesota State Teacher Development, Evaluation, and Peer Support Model (N=24)
Responses Frequency %
Very dissatisfied 1 4.2
Dissatisfied 4 16.7
Neither dissatisfied nor satisfied
12 50.0
Satisfied 5 20.8
Very satisfied 2 8.3
Total Respondents 24 100.0
The summative evaluators were asked how they would rate the Model’s ability to provide a valid
assessment of a teacher’s performance. Of these 24 respondents, 8% responded poor, 25% responded fair, 38% responded good, 17% responded very good, and 13% responded no opinion. See Table 27 for response frequencies.
Table 27. Summative evaluators’ rating of the Model's ability to provide a valid assessment of a teacher's performance (N=24) Responses Frequency % Poor 2 8.3 Fair 6 25.0 Good 9 37.5 Very good 4 16.7 Excellent 0 0.0 No opinion 3 12.5 Total Respondents 24 100.0
Center for Applied Research and Educational Improvement 16 University of Minnesota
Summary of Summative Evaluator Implementation Survey Results
Progress to Date
Summative evaluators were asked a variety of questions regarding their implementation of the Model, including their progress in reviewing and approving Individual Growth and Development Plans, establishing and carrying out points of contact, reviewing and approving Student Learning Goals, participation in training/information sessions and PLC meetings, and their satisfaction with the Pilot and the Model. The summative evaluators’ responses represent their progress and thoughts about the Model three months into the first semester of the school year.
Individual Growth and Development Plan. The summative evaluators were asked about the work they had done with teachers’ Individual Growth and Development Plans. A majority of respondents had reviewed fewer than ten plans and had spent an average of 12.4 hours reviewing and approving these Plans.
Points of contact. Half of the summative evaluators had decided on points of contact for some of their teachers. But seven summative evaluators (70%) had neither carried out points of contact nor completed any points of contact forms. The three remaining summative evaluators had begun to carry out points of contact with teachers and spent an average of 9.9 hours on this activity.
Student Learning Goals. Summative evaluators were also asked about the work they had done with teachers’ Student Learning Goals. Fourteen summative evaluators (82%) had reviewed and approved Student Learning Goals for fewer than ten teachers. The mean response for hours spent by summative evaluators on teachers’ Student Learning Goals was 7.9 hours.
Training and information sessions. When asked what types of training and information sessions related to the Pilot had taken place for the teachers in their buildings, 72% reported that there were MDE training sessions, 80% reported that there were district-sponsored sessions, 68% reported that there were building-sponsored sessions, and 72% reported that there were PLC and/or grade-level meetings.
Time spent attending and developing materials for training and information sessions. Summative evaluators reported having personally spent an average of 18.3 hours in MDE information and/or planning sessions, 6.2 hours attending MDE summative evaluator training sessions, 6.3 hours attending MDE teacher training sessions, 12.4 hours attending district-sponsored sessions, 5.3 hours attending building-sponsored sessions, and 4.0 hours attending PLC and/or grade level meetings. Sixty-five percent of summative evaluators reported developing materials to inform teachers about the Pilot and spending an average of 5.0 hours developing these materials.
Overall Satisfaction
The summative evaluators were asked questions about their satisfaction with the Model for evaluating teachers. Summative evaluators who responded to these questions reported that the Model is generally good or very good for evaluating mid-career teachers (83%) and late-career teachers (78%). However, they reported that it was not as effective for evaluating probationary, specialist, or part-time teachers or teachers who teach in more than one school in the district.
Lastly, the summative evaluators were asked about their satisfaction with the Pilot and with the Model. A majority of respondents reported being satisfied (54%) with the training provided by MDE. Regarding satisfaction with communication with MDE, responses were fairly evenly split among neither dissatisfied
Center for Applied Research and Educational Improvement 17 University of Minnesota
nor satisfied (29%), satisfied (21%), and very satisfied (29%). Half of the respondents (50%) said they were neither dissatisfied nor satisfied overall with the Minnesota State Teacher Development, Evaluation, and Peer Support Model. When asked how they would they rate the Model’s ability to provide a valid assessment of a teacher’s performance, the most frequent responses were good (38%) and fair (25%).
Center for Applied Research and Educational Improvement 18 University of Minnesota
Teacher Implementation Survey
Method
Participants and Response Rate
The teacher implementation survey was administered as an online questionnaire. All 14 districts were contacted for the email addresses of teachers participating in the Pilot. Fourteen of the 17 districts responded to the request, and, between November 20 and November 25, 2013, a link to the questionnaire was emailed to 723 teachers representing these 14 districts. Four teachers elected to ‘opt-out’ of taking the survey, and five messages did not reach the senders (five email bounces). On December 2, 2013, eight days after the original email message, a reminder email was sent to 466 non-respondents. On December 16, 2013, the link to the survey was closed. The overall response rate was 41% (293 out of 723). The response rate for individual districts ranged from 17% to 82%, with 8 of the 14 districts having a response rate of over 40% (see Appendix E).
Survey Instrument
The questionnaire contained 39 questions designed to collect teachers’ perspectives on the usefulness of the Teacher Development, Evaluation, and Peer Support Model: Implementation Handbook, sources of support they had received, level of support received, progress towards completing specific tasks, and their overall opinion of the Model. Various six-point response scales were used to collect teacher responses. The questionnaire also included background information items regarding the grade level(s) taught during the 2013-14 school year, subject area, gender, number of years teaching in the district, and total number of years teaching. The survey instrument can be found in Appendix B.
Teacher Implementation Survey Results
Progress to Date
The questionnaire contained a number of items designed to assess teachers’ progress with respect to completing tasks related to the Teacher Practice and Student Learning Goals components of the Model. The teachers’ responses represent their progress three months into the first half of the school year. Detailed information regarding the teachers’ responses can be found in Appendix H.
Individual Growth and Development Plan. The teachers’ responses to the questions regarding completion of their Individual Growth and Development Plans are presented in Table 28. One hundred twenty-eight teachers (94%) indicated that they had made some progress on the completion of their Individual Growth and Development Plans. Thirty-seven teachers (27%) had completed all parts of their Plan. Eight teachers (6%) reported that they had made no progress on their plan.
Table 28. Teachers’ progress on their Individual Growth and Development Plans
As of today, how much of the Plan have you completed?
Response Frequency %
All 37 27.2
More than half 31 22.8
Less than half 60 44.1
None 8 5.9
Center for Applied Research and Educational Improvement 19 University of Minnesota
Points of Contact
The teachers responded to four questions regarding points of contact, two of which concerned points of contact with peer reviewers and two of which related to points of contact with the summative evaluator. Table 29 presents the percent of teachers responding yes to each of the questions. Sixty percent of the teachers indicated that they had decided on points of contact with their peer reviewer and 39% indicated that points of contact with their peer reviewer had taken place. The percent responding yes to the two questions concerning points of contact with the summative evaluator were lower. Thirty-six percent of teachers reported that they had decided on points of contact with their summative evaluator, and 24% indicated that points of contact with the summative evaluator had taken place.
Table 29. Teachers’ progress on points of contact
Points of Contact Component Total Yes/Total % Responding Yes
Have you and a peer reviewer decided on any of your
points of contact? 81/136 59.6
Have any points of contact between you and your peer
reviewer taken place? 52/135* 38.5
Have you and your summative evaluator decided on
any of your points of contact? 49/136 36.0
Have any points of contact between you and your
summative evaluator taken place? 32/131* 24.4
* The total n for percentage calculations does not include participants who selected the N/A option.
Student Learning Goals
Completion of the Student Learning Goals component involves five activities. A teacher must: a) select or develop a quality assessment; b) establish a mastery score for the assessment; c) establish student starting points; d) set student learning goal(s); and e) share student learning goal(s) with the summative evaluator. Teachers participating in the Student Learning Goal component of the Model were asked to check all the activities that they had completed. Completion rates for the five activities ranged from 33% to 56%, with about one-quarter of the teachers (28%) indicating that they had not completed any of the activities. The highest completion rate (56%) was associated with setting student learning goal(s). See Table 30 for complete results.
Table 30. Teachers’ progress on Student Learning Goals.
As of today, how far along are you in the Student Learning Goals process? (Check all that have been completed.)
Activity Frequency/Total
% Checking the Activity*
I have selected or developed a quality assessment. 72/162 44.4 I have established a mastery score for the assessment. 59/162 36.4
I have established student starting points. 67/162 41.4
I have set student learning goal(s). 91/162 56.2
I have shared student learning goal(s) with the summative
evaluator. 53/162 32.7
None of these have been completed. 45/162 27.8
* Percentages sum to more than 100% because respondents were asked to check all activities that had been completed.
Center for Applied Research and Educational Improvement 20 University of Minnesota
How Much Time Was Spent
The teachers were asked to provide their best estimates of how much time they had spent working on activities required by the Teacher Practice, Student Learning Goals, and Student Engagement components of the Model. The results are shown in Table 31. Note that the median is reported rather than the mean because response options (i.e., 1 hour or less, More than 20 hours) did not allow for the computation of a mean. The medians indicate that, on average, teachers had spent approximately 3 hours preparing their Individual Growth and Development Plans, 2 hours working on their Student Learning Goals, and 1 hour working on the assessment of student engagement.
Table 31. Amount of time spent by teachers on the implementation of Model components Evaluation Component Total No. of
Respondents Minimum Maximum Median Mode
Preparing the Individual Growth and Development Plan 137 1 hour or less 20 hours or more 3 hours 1 hour or less (28%) Working on Student Learning
Goals 150 0 hour
More than
20 hours 2 hours
0 hour (17%) Working on the assessment of
student engagement 173 0 hour
More than
20 hours 1 hour
Less than 1 hour (24%)
Implementation of the Teacher Practice and Student Learning Goals Components
Teachers were asked about the resources and consultants that were utilized in carrying out activities related to the Teacher Practice and Student Learning Goals components of the Model and the perceived benefits associated with those resources and consultants. They were also asked about the difficulty level of carrying out the processes related to these two components of the Model.
Teachers participating in the Teacher Practice component of the Model were asked to report what references they utilized, the individuals with whom they consulted, the perceived benefits of the
references and consultants, and the perceived benefits of the Model on their instructional practice. Their responses are in the narratives and tables that follow. More thorough information regarding teachers’ responses to the process of carrying out the Model components can be found in Appendix H.
Center for Applied Research and Educational Improvement 21 University of Minnesota
Individual Growth and Development Plan
Teachers’ responses regarding their use of district, school, and PLC goals to inform their Individual Growth and Development Plans are shown in Table 32. Of the 137 respondents, 75% reported that they referred to their district goals, 81% reported that they referred to their school goals, and 77% reported that they referred to their PLC goals while developing their plan. Seven percent of the total respondents did not refer to any of these goals.
Table 32. Goals referred to by teachers while developing the Individual Growth and Development Plan
Did you refer to your . . . ?
Total Yes/ No. of Respondents % Responding Yes District goals 103/137 75.2 School goals 112/137 81.8 PLC goals 106/137 77.4
To assist teachers with the development of their Plans, teachers were provided the Teacher Development, Evaluation, and Peer Support Model: Implementation Handbook (Handbook) as well as training MDE. Teachers were asked to rate how helpful these two resources were in guiding them through the
development of their Plans. Teachers were also asked how working on their Plans influenced their instructional practice. Seventy-nine percent of the total respondents reported they referred to the Handbook while working on their Plan. Of those who did refer to the Handbook, 107 teachers (77%) indicated that the Handbook provided adequate guidance. Of the 117 respondents who attended MDE training, 55% stated that the MDE training provided adequate guidance. Overall, 79% of respondents reported the process of formulating their Plan had helped them to reflect on their instructional practice. See Table 33 for complete results.
Table 33. Teachers’ ratings on the usefulness of the Handbook and training in developing their Plans and the perceived benefits of the process of developing their Plans
Evaluation Component Total Somewhat true or Completely true/No. of Respondents % Somewhat true or Completely true
The Teacher Development, Evaluation, and Peer Support Model: Implementation Handbook provided adequate guidance for developing my Plan.
82/107a 76.6
The MDE training provided adequate guidance for
developing my Plan. 64/117
a 54.7
Formulating my professional growth goals helped me to reflect on my instructional practice.
101/131b 79.4
a
The total n for percentage calculations does not include participants who selected the “Did not use the Handbook” option.
b The response options were Completely untrue, Somewhat untrue, Neither untrue nor true, Somewhat true,
Completely true, and N/A. The total n for percentage calculations does not include participants who selected the N/A option.
Center for Applied Research and Educational Improvement 22 University of Minnesota
While developing their Plans, some teachers consulted with various individuals. Seventy-five teachers (63% of 120 respondents) indicated that they consulted with a peer reviewer, 32 teachers (29%) consulted with their summative evaluator, an equal number of teachers, 32 (29%), consulted with someone other than a peer reviewer or summative evaluator, and 43 (55%) teachers consulted with no one and wrote the Plan on their own. See Table 34 for results.
Table 34. Teachers’ consultants while developing the Individual Growth and Development Plan
Evaluation Component
Total Yes/ No. of Respondents
% Responding Yes
I consulted with a peer reviewer. 75/120 62.5
I consulted with a summative evaluator. 32/112 28.6
I consulted with no one; I wrote them on my own. 43/78 55.1
I consulted with other. 32/89 36.0
Of the 32 teachers who consulted others, their write-in responses indicated that 38% consulted with a fellow teacher or colleague and 34% consulted with their PLC. See Table 35 for complete results.
Table 35. Other write-in responses for teachers’ consultants while developing the Individual Growth and Development Plan
Response Frequency %
Fellow teacher(s)/colleague(s) 12 37.5
PLC 11 34.4
Write-ins with a frequency ≤ 3 5 15.6
No write-in 4 12.5
Total 32 100.0
A summary of responses indicating the teachers’ views on how beneficial their consultations were can be found in Table 36. Regardless of whom they consulted with, the majority of teachers found the
consultations to be beneficial. More specifically, 87% found it beneficial to consult with a peer reviewer, 59% found it beneficial to consult with a summative evaluator, and 67% found it beneficial to consult with other individuals.
Table 36. Teachers’ perception of whether or not it was beneficial to consult with someone when developing the Individual Growth and Development Plan
Evaluation Component
Total Yes/ No. of Respondents
% Responding Yes
It was beneficial to consult with a peer reviewer. 76/87 87.4 It was beneficial to consult with a summative evaluator. 35/59 59.3
It was beneficial to consult with other. 31/46 67.4
Note: The response options were Yes, No, and N/A. The total n for percentage calculations does not include participants who selected the N/A option.
Center for Applied Research and Educational Improvement 23 University of Minnesota
The responses of teachers with regard to the level of difficulty experienced in developing their Plans are summarized in Table 37. Of the 127 teachers who had written their professional growth goal(s) and the 124 who had written their performance standard(s), almost half (46% and 48%, respectively) thought these tasks were either difficult or very difficult.
Table 37. Teachers’ views on the difficulty level in developing the Individual Growth and Development Plan Evaluation Component Total Somewhat difficult or Very difficult/ No. of Respondents % Somewhat difficult or Very difficult
Writing professional growth goal(s) 58/127a 45.7
Writing the performance standard(s) for my goals 59/124b 47.6 a The total n for percentage calculations does not include participants who selected the “Have not written my
professional growth goals” option.
b The total n for percentage calculations does not include participants who selected the “Have not written the
performance standard(s)” option.
Performance Standards for Teacher Practice Rubric
Teachers responded to two questions related to the performance standards for the teacher practice rubric. These questions were asked to find out teachers’ views on the effectiveness of the performance standards as a tool for identifying areas of their practice for professional growth and evaluation. Sixty-eight percent of the teachers reported that the performance standards were effective in helping them to identify areas of their practice for professional growth, and 64% reported that the performance standards were effective for helping them identify areas of their practice for evaluation. Table 38 presents the percent of teachers who responded somewhat true or completely true to the questions.
Table 38. Teachers’ views on the effectiveness of the performance standards for the teacher practice rubric
The Performance Standards for Teacher Practice Rubric were an effective tool for . . .
Total Somewhat true or Completely true/No. of Respondents % Somewhat true or Completely true
Identifying areas of my practice for professional growth. 90/132 68.2 Identifying areas of my practice for evaluation. 84/131 64.1 Note: The response options were Completely untrue, Somewhat untrue, Neither untrue nor true, Somewhat true, Completely true, and N/A. The total n for percentage calculations does not include participants who selected the N/A option.
Center for Applied Research and Educational Improvement 24 University of Minnesota
Student Learning Goals
Teachers participating in the Student Learning Goals component of the Model were asked about the resources they consulted while developing their Student Learning Goals and the level of difficulty experienced while working on the various requirements of this evaluation component. Table 39 presents the teachers’ responses regarding the individuals they consulted while developing their Student Learning Goals. Sixty percent of the respondents said that they consulted with a peer reviewer and 28% said they consulted with a summative evaluator. Other consultants, such as fellow teachers and PLC’s, were utilized by 31% of the respondents.
Table 39. Individuals whom teachers consulted with while developing their Student Learning Goals Evaluation Component Response Frequency %
In formulating my student learning goals, I
consulted with: (check all that apply)
A peer reviewer 79 60.3
A summative evaluator 36 27.5
No one; I wrote them on my own 25 19.1
Other write-in consultants 40 30.5
- Fellow teacher(s)/colleagues 10 7.6 - PLC 7 5.3 - Intervention team 5 3.8 - Othera 18 13.7 Total respondents 131 *
* Percentages total up to more than 100% because respondents could choose more than one option as their response
a
Responses include other write-ins that occurred only once
Teachers’ responses regarding whether or not the consultants were perceived to be beneficial are presented in Table 40. Ninety percent of respondents found that it was beneficial to consult with a peer reviewer, and 64% reported that it was beneficial to consult with a summative evaluator. Eighty percent of those who consulted with someone other than a peer reviewer or summative evaluator indicated that the other consultations were beneficial.
Table 40. Teachers’ perception of whether or not it was beneficial to consult with someone when developing their Student Learning Goals
It was beneficial to consult with . . .
Total Yes/No. of Respondents % Responding Yes A peer reviewer. 84/93 90.3 A summative evaluator. 41/64 64.1 Other 32/40 80.0
Note: The response options were Yes, No, and N/A. The total n for percentage calculations does not include participants who selected the N/A option.
To assist in the development of their Student Learning Goals, teachers were provided a Student Learning Goals Handbook and training from MDE. Teachers were asked to rate how helpful they thought those two resources were in guiding them through the development of their Student Learning Goals. Seventy-eight percent of the teachers referred to the Handbook, with 62% of them indicating that the Handbook
provided adequate guidance in helping them to develop their Student Learning Goals. Eighty-four percent of the teachers attended the MDE training session, and approximately two-thirds of the teachers (68%)
Center for Applied Research and Educational Improvement 25 University of Minnesota
reported that the training helped them develop their Student Learning Goals. See Table 41 for complete results.
Table 41. Teachers’ ratings of the usefulness of the Student Learning Goals Handbook and MDE training in developing their Student Learning Goals
“. . . provided adequate guidance for developing my student learning goals.”
Total Somewhat true or Completely true/No. of Respondents % Somewhat true or Completely true
Student Learning Goals Handbook 64/104a 61.5
MDE training 77/114b 67.5
a The total n for percentage calculations does not include participants who selected the “Did not use the handbook”
option.
b The total n for percentage calculations does not include participants who selected the “Did not attend the MDE
training” option.
The responses of teachers regarding completion of the Student Learning Goal components are shown in Table 42. The completion rates associated with the five components ranged from 33% for sharing the student learning goal(s) with the summative evaluator to 56% for setting student learning goals. It should be noted that 28% of the respondents indicated that, at the time they participated in the survey, they had completed none of the five components. Thus, it appears that the majority of teachers still have to complete at least four of the five components before their Student Learning Goals can be approved.
Table 42. Teachers’ completion rates associated with the components of the Student Learning Goals (N=162)
Student Learning Goals Component % of Teachers Who Have Completed the Component
Selecting or developing assessments to measure the goals 43.8
Establishing mastery scores for the assessment 35.8
Establishing student starting points 40.7
Setting student learning goals 56.2
Sharing student learning goal(s) with the summative
Center for Applied Research and Educational Improvement 26 University of Minnesota
The responses of teachers regarding the level of difficulty experienced while working on the components of their Student Learning Goals are shown in Table 43. The percentages of teachers selecting somewhat easy or very easy were very similar across the four components, ranging from 38% for establishing mastery scores to 45% for establishing student starting points. Interestingly, these percentages are also very similar to the percentages associated with somewhat difficult or very difficult (31% to 40%). Therefore, teachers seem to be equally divided regarding whether the tasks associated with Student Learning Goals are easy or difficult for them to carry out.
Table 43. Teachers’ perceptions of the difficulty of completing the components of their Student Learning Goals
Student Learning Goals Component Total n of Respondents % Somewhat easy or Very easy % Somewhat difficult or Very difficult
Selecting or developing assessments
to measure the goals 116 43.1 37.9
Establishing mastery scores for the
assessment 109 37.6 40.4
Establishing student starting points 119 45.4 31.1
Setting student learning goals 123 39.0 39.0
Note: The total n for percentage calculations for the four components does not include participants who selected the “Have not selected or developed assessment” option, the “Have not developed mastery scores” option, “Have not developed my student starting points” option, or the “Have not developed student learning goals” option.
Center for Applied Research and Educational Improvement 27 University of Minnesota
Student Engagement
Teachers participating in the Student Engagement component of the Model were asked to identify the methods they were planning to use to assess student engagement. The survey presented a list of six methods (MDE Student Engagement Survey, observation, student portfolios, student presentations/ performances/projects, teacher portfolio, and video) plus an other write-in option, and teachers were asked to check all that applied. A total of 177 teachers responded to the survey item. Twenty-nine percent (52) of the respondents indicated that they had not yet decided on the methods they would use. Of those who did identify methods of assessing student engagement (125), the most commonly selected were observation (86%), student presentations/performances/projects (56%), the MDE Student Engagement Survey (38%), and student portfolios (16%). There was little commonality among the write-in other methods provided by 18% of the teachers. Some examples of other methods identified by the teachers were attendance, participation, student reflections, and tests. Table 44 presents a summary of the teachers’ responses.
Table 44. Methods that teachers reported they will use to assess student engagement (N=125) Evaluation
Component Response Frequency %
What methods will you use to assess student engagement? (Check all that apply.)
Observation 107 85.6
Student
presentations/performances/projects 70 56.0
MDE Student Engagement Survey 47 37.6
Student portfolios 20 16.0
Video 13 10.4
Teacher portfolio 7 5.6
Other write-in methods 22 17.6
Total respondents selecting methods 125 * *Percentages total up to more than 100% because respondents could choose more than one option as their response
Overall Satisfaction
The questionnaire asked teachers to indicate their level of overall satisfaction with the Model by responding to the question, Based on your experiences to date, how satisfied are you, overall, with the Minnesota State Teacher Development, Evaluation, and Peer Support Model? The majority of the teachers (57%) indicated that they were neither dissatisfied nor satisfied with the Model. The teachers who did express a specific sentiment, however, were more inclined to be dissatisfied (30%) than satisfied (13%). In addition, it should be pointed out that no teachers indicated that they were very satisfied with the Model. See Table 45 for results.
Table 45. Teachers’ overall satisfaction with the Minnesota State Teacher Development, Evaluation, and Peer Support Model
Response Frequency %
Very dissatisfied 25 9.9
Dissatisfied 51 20.2
Neither dissatisfied nor satisfied 143 56.5
Satisfied 34 13.4
Very satisfied 0 0.0
Center for Applied Research and Educational Improvement 28 University of Minnesota
A second question was posed to the teachers to gauge their overall impressions of the Model. The question was, Based on your experiences to date, how would you rate the Model's ability to provide a