(www.interscience.wiley.com) DOI: 10.1002/spip.335
Using Simulation to
Evaluate Global Software
Development Task
Allocation Strategies
Research Section
Siri-on Setamanit,
1∗,†Wayne Wakeland
2and David Raffo
11School of Business Administration, Portland State University, 631 SW
Harrison St., Portland, OR, USA
2Systems Science PhD, Portland State University, 1604 SW 10th Ave.,
Portland, OR, USA
We describe a hybrid computer simulation model of the software development process that
is specifically architected to study alternative ways to configure global software development
(GSD) projects, including phase-based, module-based, and follow-the-sun allocation strategies.
The model is a hybrid system dynamics and discrete-event model. In this paper, test cases
have been developed for each allocation strategy, and project duration is computed for each
configuration under a range of plausible assumptions for key parameters. The primary finding is
that although under ideal assumptions follow-the-sun is able to produce impressive reductions
in time-to-market, under more realistic assumptions the reverse is true, thus corroborating
findings by other researchers. We also conducted a factorial design to examine the impact of
GSD factors including distance, culture, language, trust, and time zone on project duration
under different task allocation strategies. The analysis reveals that different factors affected the
performance of the selected allocation strategies in unique ways. These findings show how the
unique ability of our GSD model to represent detailed development processes and work artifact
transfer allows researchers to address challenging questions that are critical to GSD project
success. Copyright
2007 John Wiley & Sons, Ltd.
KEY WORDS: global software development; distributed development; software process simulation modeling; hybrid simulation model
1. GLOBAL SOFTWARE DEVELOPMENT
Global software development (GSD) is a software development in which software teams, working on the same project or system, collaborate across
∗Correspondence to: Siri-on Setamanit, School of Business
Administration, Portland State University, 631 SW Harrison St., Portland, OR, USA
†E-mail: [email protected]
Copyright2007 John Wiley & Sons, Ltd.
national boundaries or are dispersed geographi-cally. Almost 100 nations are now participating in GSD (Carmel and Tija 2005) expecting to gain bene-fits including reduction in time-to-market, reduc-tion in development costs, better use of scarce resources, and business advantages from proximity to customers (Gorton and Motwani 1996, Norbjerg
et al. 1997, Carmel 1999, Herbsleb and Moitra 2001, Carmel and Tija 2005). It has been reported that the major benefits expected are reduction in develop-ment cost and developdevelop-ment time (King 2003, Carmel and Tija 2005).
Ideally, with the use of follow-the-sun or 24-hour development, it is expected that the cycle time can be reduced by 20–35% (Carmel 1999). Unfor-tunately, in practice, follow-the-sun development requires much more communication and coordi-nation. Together with time zone difference and cultural and language differences, few GSD projects have been able to realize the full (theoretical) bene-fits of follow-the-sun development.
An IBM team described in Carmel’s book (Carmel 1999) decided to abandon follow-the-sun strategy since the daily handoffs between sites were too difficult to coordinate. In addition, on the basis of empirical studies, Herbsleb and Mockus found that for work of equal size and complexity, mul-tisite software development takes much longer than single-site development (Herbslebet al. 2001, Herbsleb and Mockus 2003). The authors further recommend that the way to speed the development is to decouple the work so that each site can operate more independently.
This raises the question whether follow-the-sun development with daily handoffs is the best way to pursue if the goal of the GSD project is to reduce the cycle time. What factors contribute to the delay? Is there any better way to distribute work between sites?
The results from empirical study are often influ-enced by several factors. It is difficult to separate the factors and identify which factor actually influences the result and to what degree. For example, with empirical study and statistical modeling techniques, Herbsleb et al. (2001), and Herbsleb and Mockus (2003) found that communication, coordination, and social networks in multisite development may differ from single-site development such that it requires more people to participate, and therefore introduces additional delays. The authors recognize that sev-eral factors such as ‘teamness’ and cultural and language differences may also contribute to delay. Unfortunately, with their research design, it was not possible to assess the relative effect of each of these factors.
We believe that simulation models can be used to help expand and identify the factors that contribute to project delays. In Section 2, we explain how simulation modeling can help address this important issue. This model is a hybrid system dynamics (SD) and discrete-event simulation (DES) model. We provide an overview of our GSD simulation model in Section 3. Experimental results
are provided in Section 4, followed by conclusion in Section 5.
2. A SIMULATION MODEL AS AN
EXPERIMENTATION PLATFORM
In software engineering it is easy to propose hypotheses; however, it is very difficult to test them (Abdel-Hamid 1988). Controlled experiments are costly and time consuming (Myers 1976), and are nearly impossible to conduct. In addition, the isolation of the effect and the evaluation of the impact of any given factor within a large, complex, and dynamic project environment (such as GSD) can be remarkably difficult (Glass 1982).
With available empirical data, software process simulation models can be constructed and cal-ibrated so that they reflect real-world behavior quite accurately. Such models can then be used as an experimental platform to investigate the sit-uation/system and evaluate new hypotheses and theories. By varying individual parameters or com-binations thereof, the magnitude and strength of the impact on variables of interest can be measured (Rus et al. 2002). Simulation models enable con-trolled experimentation that allows the researcher to identify factors that profoundly impact the out-come. It is far less costly and less time consuming to perform experimentation using simulation models. The next section describes our hybrid simulation model of GSD.
3. A GSD SIMULATION MODEL
3.1. Hybrid Simulation ModelWe believe that a hybrid simulation model com-bining the system dynamics and discrete-event paradigms is the most appropriate for represent-ing GSD project (Raffo and Setamanit 2005). One strength of the SD paradigm is its ability to cap-ture the dynamic nacap-ture of software development projects. Therefore, it is suitable for modeling con-tinuous factors and their interactions, including communication, coordination, cultural issues, learn-ing curve, changlearn-ing staff levels, and dynamically varying productivity. DES has the ability to cap-ture actual process level details, and the ability to represent each work product of the develop-ment process as being unique – through the use of
attributes attached to each work product, such as size and complexity. Thus, DES provides the abil-ity to explicitly represent the process structure and mechanisms used to transfer work products and to coordinate activities. These two paradigms com-plement each other and allow our GSD model to capture the actual development processes executing within a continuously changing project environ-ment.
3.2. Important Factors
In our previous work (Raffo and Setamanit 2005), we have identified the factors that can affect the performance and the PD of GSD projects. These factors can be segmented into three categories, as follows:
• Fundamental Factors
The fundamental factors relate to the primary characteristics of GSD projects, including commu-nication problems, coordination and control prob-lems, cultural differences, language differences, and time zone differences. A project manager has little or no control over these factors; however, by using the right strategy and tool support, the negative impact of these factors can be reduced.
• Strategic Factors
The strategic factors are related to high-level issues that the project manager must address when managing a GSD project. Decisions regarding these issues significantly impact the performance of the GSD project. There are five such factors, including development site, product architecture, task allocation strategy, distribution overhead, and distribution effort loss.
• Organizational Factors
The factors in this category are concerned with the impacts from virtual teams, including team formulation and team dynamics.
Additional explanation of these factors may be found in Raffo and Setamanit (2005). Our GSD model incorporates all of the factors mentioned above. The next section describes the GSD model structure, and how it incorporates these important factors.
3.3. GSD Model Structure
The GSD model used in this study is a hybrid model combining SD and DES paradigms. A SD
model is inspired by and adapted from the SD model of software development created by Abdel-Hamid and Madnick (1991). The interface between SD and DES submodels is inspired by the hybrid model of the software development process created by Martin (2002).
First, we provide a high-level overview of the complete GSD model. We then describe how the model works, focusing on the unique mechanisms and structures of the model that enable us to investigate alternative GSD configurations.
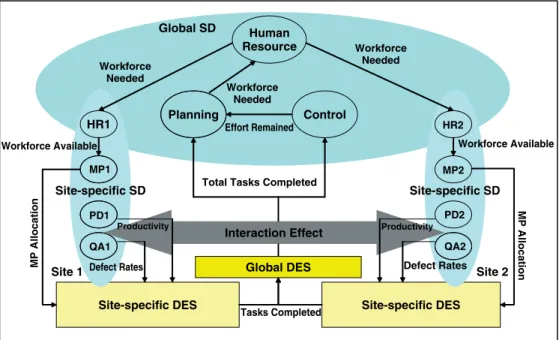
The GSD model has three high-level components: a DES model, an SD model, and an interaction effect (IE) model. The DES model includes a global DES submodel and a site-specific DES submodel for each development site. Each development site may have different process steps depending on how tasks are allocated and specific activities are performed. The site-specific DES allows us to represent these differences and to capture their impact. Different time zones are also modeled. Artifacts or work products pass from one site to another at different times, depending upon the allocation strategy, in order to capture the effect of distribution overhead and distribution effort loss. The global DES submodel aggregates the information from the site-specific DES submodels to determine overall project progress.
The SD model includes a global SD submodel and a site-specific SD submodel for each development site. The global SD submodel captures the overall project environment, including the planning and controlling activities. The global SD submodel has three modules: Human Resources (HR), Planning, and Control. The HR module acts as an interface between the HRn modules from each development
site and the other modules in the global SD submodel. The control module receives information about the project progress (from the global DES submodel) and then evaluates whether adjustments to the schedule or the work rate are needed. The planning module monitors and identifies the workforce level required to meet the overall project schedule.
Each development site has its own site-specific SD submodel. The site-specific SD submodel represents aspects that may be different between develop-ment sites, including HR, productivity, manpower allocation (MP), and quality assurance (QA). The HRnmodule deals with Human Resource
manage-ment, which includes hiring, training, assimilation,
HR = Human Resource MP = Manpower Allocation PD = Productivity QA = Quality Global DES Planning Control Workforce Needed Workforce Available HR1 PD1 QA1 MP1 MP Allocation
Total Tasks Completed
Site 2 Site 1 Human Resource Workforce Needed HR2 PD2 QA2 MP2 MP Allocation Defect Rates Global SD Site-specific SD Site-specific SD Site-specific DES Workforce Needed Effort Remained Tasks Completed Workforce Available Defect Rates Productivity Productivity Interaction Effect Site-specific DES
Figure 1. Overview of the GSD model structure
and transferring Human Resource in a particular site. The PDn module models the rate at which
developers at a particular site can develop software (productivity rate). The MPnmodule assigns
work-force to different activities. The QAnmodule models
defect generation, detection, and correction rates. The IE model comes into play when staff from different sites need to collaborate or work closely together; for example, during follow-the-sun development. When developers work with their colleagues from the same site, information such as productivity and defect rates will be sent directly from the site-specific SD submodels. However, when developers have to collaborate with their colleagues from other sites, their productivity (from PDn module) will be modified by the
IE model to takes those effects into account. More information about the GSD model logic is explained in Section 3.4. Section 3.5 provides additional details about the IE model. Figure 1 shows the overall GSD model structure with two development sites.
3.4. GSD Model Logic
The GSD model is designed to be flexible and expandable. At the simplest level, the GSD model
can be used to represent a single-site software devel-opment project. To add additional develdevel-opment sites, one site-specific SD and one site-specific DES submodel are added to represent the characteristics of each new development site.
Assume that there are two development sites involved in a project (as shown in Figure 1). The following discussion illustrates how the GSD model works. The site-specific HRn modules (HR1 and
HR2) will send information about the available workforce to the site-specific MPnmodule. The MPn
module will allocate the workforce to different tasks such as development and QA. The PDn module
determines the productivity of the staff (depending on the workforce mix and the schedule pressure).
The productivity rate will be sent to the IE model. If the developers in a particular site work only with other developers from the same site, the IE model will pass along the productivity rate to the site-specific DES without any modification.
On the other hand, if the developers have to work with their colleagues from other sites, the IE model will modify the productivity rate before sending it to the site-specific DES submodel.
The productivity rate and the manpower will be sent to site-specific DES submodel. This information drives the software development activity at a
Trust Communication Frequency Coordination Efficiency Distance Culture Difference Familiarity Meeting + + + + + -Productivity (from PD module) Productivity Multiplier Productivity (Multi-site)
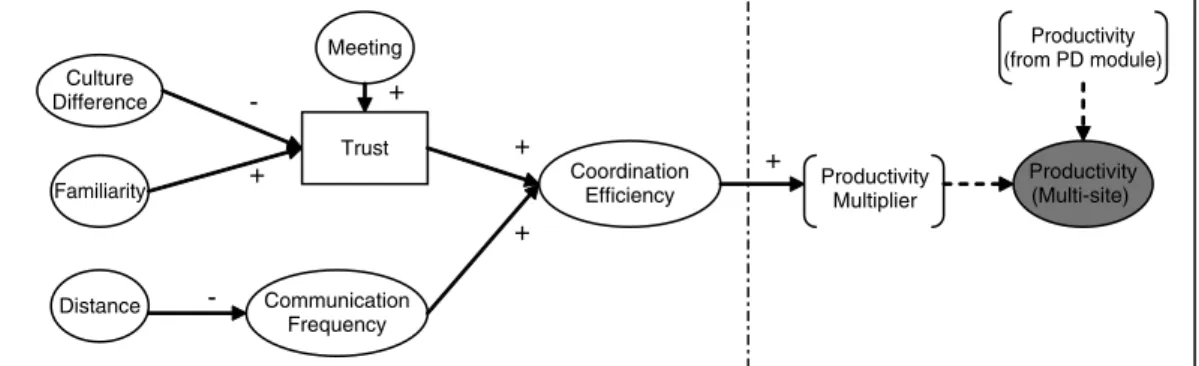
Figure 2. The interaction effect on productivity rate
particular site. Each site then sends information about tasks completed to the global DES submodel. The global DES submodel aggregates information from all sites to determine the total task completion. The global DES submodel then sends information about total task completion to the control module. The control module reviews the project progress information and determines whether the schedule or work rate should be adjusted. If the schedule should be adjusted, the control module will sig-nal the planning module. The planning module will adjust the schedule and also determine the number of staff needed to complete the remain-ing project tasks. The plannremain-ing module will then send information about the workforce needed to the HR module (in the global SD submodel). The HR module will determine the workforce needed for each development site and then send the infor-mation to site-specific HRn module of each site.
The site-specific HRn module adjusts its workforce
to correspond to the workforce needed. This cycle repeats until the project is completed.
3.5. Interaction Effect Model
The structure of the IE model is based on literature regarding GSD, distributed development, and vir-tual teams. Factors and quantitative models relevant to the GSD model are reported in Raffo and Seta-manit (2005). The IE model impacts many factors including productivity and defect generation.
3.5.1. Interaction Effect on Productivity Rate
For knowledge-based work such as software devel-opment, tight coordination among various efforts is required for the project to be successful (Kraut and Streeter 1995). Problems of coordination lead to
losses in productivity (Steiner 1966, Brooks 1975). Because of the distance and time zone differences, coordination within and across multisite develop-ment teams is even more difficult, which further impacts productivity. The IE model calculates the coordination efficiency of the distributed team (rel-ative to the coordination efficiency of the single-site team), and then applies the coordination effect to the productivity before sending it to the site-specific DES submodel. If the coordination efficiency of the distributed team is lower, the productivity will be lower. Figure 2 shows the interaction effects on pro-ductivity rate.
There are two primary factors that have a significant impact on coordination efficiency: Com-munication Frequency and Trust. More information about these two factors is provided in the next two sections.
3.5.1.1. Communication Frequency Team members coordinate their work through communication (exchange of information). Several studies of soft-ware development projects (Curtiset al. 1988, Perry
et al. 1994, Kraut and Streeter 1995, Herbsleb and Grinter 1999) found that informal, unplanned, and
ad hoc communication is extremely important in supporting collaboration. Discussions with peers is the most used and valued coordination technique (Kraut and Streeter 1995). Thus, teams with fre-quent communications among their members tend to coordinate better. However, the distance between team members negatively affects the volume of communication (Allen 1977). This agrees with the finding by Krautet al. (1990) that physical proxim-ity increases the likelihood of collaboration among scientists. In our GSD model, the IE model will determine the relative frequency of communication
when team members are at different sites compared to when they are at the same site. The relative com-munication frequency will positively impact the coordination efficiency.
3.5.1.2. Trust Trust is a basic feature of social situations that requires cooperation and interdepen-dence (Jennings 1971). Without trust, it is unlikely that a team will work together effectively since the team members are unwilling to communicate openly across sites. Teams with higher trust tend to coordinate better, and thus achieve better perfor-mance (Jarvenpaa and Leidner 1999).
In the GSD model, trust will be modeled as a dynamic variable. The initial level of trust is determined by culture individualist or collectivist, as defined by Hofstede (2001) and team member familiarity (Consortium 2002). People from the same culture develop trust more quickly than people from different cultures. In addition, individuals from an individualistic culture tend to be more ready to trust others than individuals from a collectivist culture (Pearce 1974, Gudykunst 1996). Trust will be higher when team members become more familiar with each other.
Unfortunately, without face-to-face communica-tion, trust tends to decrease overtime (Meyer 1991). However, the GSD model includes a mechanism that triggers meetings between team members to re-establish trust whenever the trust level falls below a predetermined threshold.
3.5.2. Interaction Effect on Defect Injection Rate
When teams are separated by time and/or distance, communication effectiveness is hampered both in quality and timeliness (Espinosa and Carmel 2003a). Rich communication media (such as face-to-face interaction) tend to be more effective than leaner media (such as telephone or e-mail). The leaner the communication media, the higher the likelihood of miscommunication, which can introduce defects (Espinosa and Carmel 2003a). In addition, different cultures (high-context and low-context Hall 1976) also lead to miscommunication.
In our GSD model, communication media affects the defect generation multiplier. For example, telephone will lead to a higher defect generation multiplier than a face-to-face meeting. The defect generation multiplier is applied to the defect generation rate from the QA module. The value of the defect generation multiplier is based on
information from the coordination cost model developed by Espinosa and Carmel (2003b).
There are three factors that determine the choice of communication media: time zone differences, message urgency, and native language. When there is no overlap in work hours, the choice of commu-nication media is limited to asynchronous media. The urgency of communication increases the use of synchronous communication. It has been reported that developers prefer to use telephone over e-mail when the urgency category is within 10 min (Wijayanayake and Higa 1999). Regarding lan-guage, nonnative English-speaking people prefer asynchronous communication such as e-mail over synchronous since it allows them to read and write at their own pace (Ishii 1993, Carmel and Agarwal 2001, Keil and Eng 2003). Therefore, if the devel-opers speak different languages, they will prefer to use e-mail instead of synchronous communica-tion, except when the urgency is within 10 min. Currently, there are three communication media options represented in our model: telephone, instant messaging (chat), and e-mail.
3.6. GSD Model Verification and Validation
Several verification and validation techniques described by Schlesinger (1974) and Pegden et al. (1990) were performed. We found that the GSD model is stable and able to produce reasonable and consistent results. The model is also able to repli-cate the behaviors of the GSD projects as described in the literature (Carmel 1999, Herbslebet al. 2001, Herbsleb and Mockus 2003).
We also tailored the theoretical GSD model to a specific project of a GSD company. The tailored model was able to replicate the behavior of the project of interest and was used by the project manager to support project decision-making. The application of the GSD model to a real-world project increased our confidence in the validity of the model, and confirmed that the model was ready to be used to investigate real-world GSD phenomena.
4. MODEL RESULTS
To illustrate the functionality and the usefulness of the GSD model, we created a simple example project. The example project has two development sites (sites A and B), and has five phases includ-ing Requirements (REQ), Design (DES), Codinclud-ing
REQ DES CODE TEST RWK Site A Single-site REQ Site A Module-based Phase-based Follow-the-sun Site B REQ TEST RWK Site A DES CODE Site B
REQ DES CODE TEST RWK
Site A
REQ DES CODE
Site B TEST RWK
DES CODE TEST RWK
REQ DES CODE
Figure 3. Four configurations of the GSD model
(CODE), Testing (TEST), and Rework (RWK). We created four model configurations. Each configura-tion represents a different task allocaconfigura-tion strategy as defined by Carmel (1999): single-site, module-based, phase-module-based, and follow-the-sun, as shown in Figure 3.
4.1. Ideal Situation
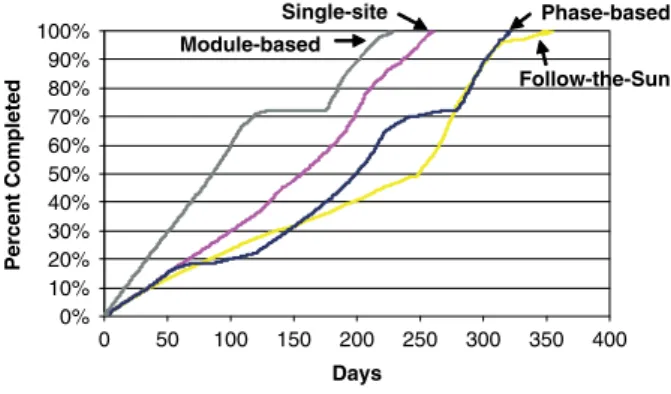
One of the proposed benefits of GSD is that it can reduce the development cycle time, especially the follow-the-sun strategy. In this scenario, we assume that everything is perfect. Developers can coordinate with colleagues from other sites just as efficiently as when they coordinate with their col-leagues from the same site. There are no problems regarding cultural or language differences. In other words, the full benefit of GSD can be achieved. To represent this situation, we configure the GSD model to exclude all the effects from GSD factors mentioned in Section 3.5. Figure 4 shows project progress against time for the four configurations.
As expected by GSD enthusiasts, when every-thing works perfectly, follow-the-sun development has the shortest development cycle time. The devel-opment cycle time using follow-the-sun strategy is about 70% of the time it takes using single site.
Module-based took a little longer than the follow-the-sun strategy since there is only one site working at the end of the development cycle. Phase-based took about the same time as single site since we assumed that the staff in both sites have approximately the same productivity rate.
0% 0 50 100 150 200 250 300 10% 20% 30% 40% 50% 60% 70% 80% 90% 100% Days Percent Completed Single-site Follow-the-Sun Phase-based Module-based
Figure 4. Project progress comparison (ideal situation)
4.2. Real-World Situation
As mentioned before, there are several factors that may affect the efficiency and the effectiveness of the development in distributed environment. In this scenario, we include all the GSD factors described in Section 3.5 such as coordination costs due to dis-tance, language differences, time zone differences, cultural differences, and so forth. Figure 5 shows the project progress against time for the four con-figurations.
When GSD factors are taken into account, the follow-the-sun strategy is no longer the shortest. Communication and coordination problems cou-pled with cultural and language differences make it difficult to coordinate, which reduces the develop-ment productivity. Follow-the-sun took about 37% longer than single-site development. This agrees with Herbsleb’s finding that multisite development
0% 0 50 100 150 200 250 400 10% 20% 30% 40% 50% 60% 70% 80% 90% 100% Days Percent Completed Follow-the-Sun Module-based Phase-based Single-site 350 300
Figure 5. Project progress comparison (real-world situation)
can take longer than single-site development (Herb-sleb and Mockus 2003).
The module-based approach has the shortest cycle time in this case. This agrees with Herbsleb
et al.’s (Herbsleb and Grinter 1999, Herbsleb et al. 2001, Herbsleb and Mockus 2003) suggestion that the best strategy is to decouple the work so that each site can operate more independently.
One can imagine that it may be possible to speed up the module-based strategy by reducing the time to integrate work products from different sites (note the almost flat line for module-based development from time 120 to 170). This is the same for phase-based development. There are two handoff points. If the handoffs can be made smoother and faster, then cycle times can be reduced. For the follow-the-sun strategy, coordination difficulties affect productivity, which leads to long cycle times. If coordination can be made more efficient, then cycle times could be reduced.
4.3. Further Experimentation
Using realistic assumptions, we ran 30 replica-tions of each configuration and performed one-way ANOVA analysis. The results indicated that the duration from module-based configuration is the shortest, followed by single-site configuration. Follow-the-sun consistently takes the longest, with phase-based in the middle. One can see that the duration of the project depends on task allocation strategy used. The next step is to identify factors that have strong impacts on project duration for each task allocation strategy.
On the basis of the literature and initial experi-mentation with the model during verification and
validation process, there are several GSD factors that potentially have strong impact on project duration including distance, time zone, culture, language, distribution overhead, member familiar-ity, and meeting frequency. In order to gain better understanding of the effects of these factors on duration, we conducted a 27 factorial design with 5
replications for each design point (a modest sample size from a statistical viewpoint (Law and Kelton 2003)) for a total of 640 runs for each of the three task allocation strategies, for a total of 1920 runs. The response (dependent) variable is project dura-tion. Table 1 shows the factors, their levels, and descriptions.
By not treating task allocation strategy as a factor within the design, we will be able to identify the important factors for each task allocation strategy. The next section provides the results from the factorial designs for each task allocation strategy.
4.3.1. Follow-the-sun Strategy
All factors except language significantly affect project duration. Figure 6 shows the main effect plot of the seven different GSD factors on project duration.
Increasing percent overlap of work hours con-tributes to longer duration because there is less development time per day. Distance reduces com-munication frequency, which can contribute to lower productivity. Therefore, it takes a longer time to complete the project. Similarly, different cultures make it more difficult to communicate and coordi-nate; therefore, productivity will be lower, which results in longer project duration. An increase in distribution overhead contributes to higher effort, which makes project duration longer. In addi-tion, when developers are more familiar with one another, they coordinate better and have higher productivity. This contributes to shorter develop-ment time. Lastly, as develop-mentioned multiple times in the literature, frequent meetings help improve trust among team members. This also results in higher productivity and shorter cycle time.
We also examined the Pareto chart and normal probability plot of the standardized effect, and found that percent overlap of work hours is the most influential factors (with a 44% impact on duration), followed by distribution overhead (37%) and distance (10%). The effects of the interaction terms are minimal.
Table 1. Factor levels and descriptions
Factors Levels Description
Distance 2 Within walking distance Not within walking distance
Proxy measure for communication frequency (shorter distance=higher communication frequency)
Time zone 2 No overlap working hour Different time zone means less overlap working hour 100% overlap working hour
Culture 2 Same
Different
National culture between two development sites (related to the location of development sites)
Language 2 Same Official language between two development sites Different
Distribution overhead 2 Low High
Additional effort/time required when tasks are distributed across sites including artifact transfer and knowledge transfer
Member familiarity 2 Low High
The degree that members are familiar with one another (i.e. work together before=high)
Team meeting 2 Infrequent: every 8 months The frequency of team meeting during the course of the project Frequent: every 4 months
Figure 6. Main effect on duration (follow-the-sun)
4.3.2. Module-based Strategy
Similar to follow-the-sun strategy, the main effects for the module-based strategy of all factors except language on project duration are statistically sig-nificant. Figure 7 shows the main effect plot of the seven GSD factors on duration.
The most influential factor by far is distribution overhead. Percent overlap of work hours, familiar-ity, and meeting frequency also impact duration to some degree.
It is interesting to note that the effect of percent overlap of work hours and meeting frequency on module-based project duration is in the opposite direction to the effect on the follow-the-sun project. Unlike the follow-the-sun strategy, an increase in the percent overlap of work hours contributes to shorter duration. The reason is that, with the
module-based strategy, development work hours per day do not decrease due to the increase in percent overlap of work hours since each site works independently at its own schedule. In addition, increasing the overlap of work hours allows more opportunity for synchronous communication when needed, which contributes to higher productivity and thus to shorter duration.
Increasing meeting frequency increases project duration. The benefit of productivity improvement (due to higher trust) is not enough to offset the development time lost when holding additional meetings.
4.3.3. Phase-based Strategy
The main effects of all factors except language on project duration are statistically significant. Figure 8
Figure 7. Main effect on duration (module-based)
Figure 8. Main effect on duration (phase-based)
shows the main effect plot of the seven GSD factors on duration.
Like the module-based strategy, the most influen-tial factor by far on project duration for the phase-based strategy is distribution overhead, followed by percent overlap of work hours. The impacts of other factors are relatively minimal. The interac-tion between percent overlap of work hours and meeting frequency is significant. Figure 9 shows an interaction plot of these two factorsvis-`a-visproject duration.
Interestingly, frequent meetings contribute to longer duration only when there is no overlap of work hours. The effect of meeting frequency is negligible when work hours are 100% overlapped. This finding suggests that when work hours are 100% overlapped, the project should hold frequent meetings in order to reduce effort and duration.
Figure 9. Interaction plot on duration (phase-based)
However, when there is 0% overlap, frequent meetings can help reduce effort, but unfortunately project duration increases somewhat.
5. DISCUSSION
The results provided in the previous section are hypothetical results to illustrate the functionality and usefulness of the GSD model. The model was calibrated with information from literature (Boehm 1997, Carmel 1999) and the industry standard data collected by Jones (1977).
Despite the fact that our results are based on sim-plified models that were drawn from the literature, it is quite clear that the success of GSD depends on many factors. It is interesting to see how dif-ferent factors affected the performance of difdif-ferent allocation strategies in unique ways. For example, increasing overlap of work hours contributes to shorter duration for module-based and phase-based strategy; but unfortunately this increases project duration for follow-the-sun strategy. Finding such potentially counter-intuitive results that support findings in the literature emphasizes the ability of the GSD model in representing detailed process step and work artifact transfer, which enables us to examine the project using different task allocation strategies.
In addition, this finding can also help one improve project performance and formulate optimal policies for each task allocation strategy. For example, dis-tribution overhead is the most influential factor on project duration when using the phase-based strategy. If a team can reduce the overhead when transferring work product between sites, the project duration can be reduced. This could be done, for example, by: (i) utilizing a formal transition process such as having a liaison visit the site, (ii) providing better documentation, or (iii) establishing a more robust communication infrastructure. For the base-line project modeled in our research, a 25% decrease in distribution overhead reduced project duration by 5%.
6. CONCLUSION
In this paper, we used a GSD model to evaluate the choice of task allocation strategy and its impact on project duration. By using the GSD simulation model, we were able to capture and assess the impact of a number of real-world factors that have been presented in the literature. These included the factors of distance, culture, language, trust (familiarity and meeting frequency), and time
zone (percent overlap of work hours). The results obtained were consistent with those found in the literature (Carmel 1999, Herbsleb and Grinter 1999, Herbsleb et al. 2001, Herbsleb and Mockus 2003). The results provide additional insight into the role of the various factors under different task allocation strategies, and indicate that different strategies are appropriate for different types of development. This matches with real-world experience and helps to establish the validity of the theoretical model.
In addition to helping project managers to determine which type of GSD configuration is likely to work best for their particular situation, the GSD model also shows promise for exploring other globally distributed development issues such as:
General GSD project:
• Should work be distributed across multiple sites or should it be centralized at a single site?
• Under what circumstances do dispersed teams perform better than colocated teams? When should a GSD approach be chosen?
• What are the critical success factors in GSD projects?
• What characteristics make a project suitable for GSD?
• What practices and tools are effective and worthwhile to apply to GSD projects?
Specific GSD project:
• Which development sites should be included in the project?
• How should work be divided up across sites? What task allocation strategy should be used for a particular project?
• What is the forecasted project performance in terms of cost, quality, and schedule?
• What is the impact of process changes in a GSD context? Should we add process A? Can we minimize or skip a portion of process B?
REFERENCES
Abdel-Hamid T. 1988. The economics of software quality assurance: a simulation-based case study.MIS Quarterly 12(3): 394–411.
Abdel-Hamid T, Madnick S. 1991. Software Project
Dynamics: An Integrated Approach, ed, P.-H.s. series. Prentice-Hall: Englewood Cliffs, NJ.
Allen TJ. 1977.Managing the Flow of Technology. MIT press: Cambridge, MA.
Boehm BW, Abts C, Clark B, Devnani-Chulani S. 1997.
COCOMO II Model Definition Manual. University of Southern California: LA, CA.
Brooks FP. 1975. The Mythical Man-Month.
Addison-Wesley: Reading, MA.
Carmel E. 1999.Global Software Teams. Prentice Hall PTR: Upper Saddle River, NJ.
Carmel E, Agarwal R. 2001. Tactical approaches for alleviating distance in global software development.IEEE Software18(2): 22–29.
Carmel E, Tija P. 2005.Offshoring Information Technology: Sourcing and Outsourcing to a Global Workforce. Cambridge University Press: Cambridge, 282.
Consortium SP. 2002.Measurement for Distributed Teams. Software Productivity Consortium: Herndon, Virginia, 68.
Curtis B, Krasner H, Iscoe N. 1988. A field study of the software design process for large systems.
Communications of the ACM31(11): 1268–1287.
Espinosa JA, Carmel E. 2003a. The impact of time separation on coordination in global software teams: a conceptual foundation.Software Process Improvement and Practice8(4): 249–266.
Espinosa JA, Carmel E. 2003b. Modeling the effect of time separation on coordination costs in global software teams.
The 37th Hawaii International Conference on System Sciences, Hawaii.
Glass RL. 1982.Modern Programming Practices: A Report
from Industry. Prentice-Hall, Inc: Englewood Cliffs, NJ. Gorton I, Motwani S. 1996. Issues in co-operative software engineering using globally distributed teams.Information and SoftwareTechnology38: 647–655.
Gudykunst WB, Matsumoto Y, Ting-Toomey S,
Nishida T, Linda KW, Heyman S. 1996. The influence of cultural individualism-collectivism, self construals, and individual values on communication style across cultures.
Human Communication Research22(4): 510–543.
Hall ET. 1976. Beyond Culture. Doubleday Books: New
York.
Herbsleb JD, Grinter RE. 1999. Splitting the organization and integrating the code: Conway’s law revisited. Interna-tional Conference on Software Engineering (ICSE’99). ACM Press: Los Angeles, CA.
Herbsleb JD, Moitra D. 2001. Global software develop-ment.IEEE Software18(2): 16–20.
Herbsleb JD, Mockus A. 2003. An empirical study of speed and communication in globally distributed
soft-ware development. IEEE Transactions on Software
Engi-neering29(6): 481–494.
Herbsleb JD, Grinter RE, Finholt TA. 2001. An empirical study of global software development: distance and speed.ICSE 2001. IEEE: Toronto.
Hofstede G. 2001. Culture’s Consequences: Comparing
Values, Behaviors, Institutions, and Organizations Across Nations, 2nd edn. Sage Publications, Inc: Thousand Oaks, CA.
Ishii H. 1993. Cross-cultural communication and CSCW.
Global Networks: Computers and International Communi-cation, Harasim LM (ed.). MIT Press: Cambridge, MA., 143–151.
Jarvenpaa SL, Leidner DE. 1999. Communication and trust in global virtual teams. Organization Science10(6): 791–815.
Jennings EE. 1971.Routes to the Executive Suite. McGraw-Hill: New York.
Jones C. 1977. Applied Software Measurement: Assuring
Productivity and Quality. McGraw-Hill: New York. Keil L, Eng P. 2003. Experiences in distributed develop-ment: a case study.The International Workshop on Global Software Development: Portland, OR.
King J. 2003. It’s global itinerary: offshore outsourcing is inevitable.Computerworld.
Kraut RE, Streeter LA. 1995. Coordination in software development.Communications of the ACM38(3): 69–81. Kraut RE, Egido C, Galegher J. 1990. Patterns of contact and communication in scientific research collaborations. In Intellectual Teamwork: Social Foundations of Cooperative
Work, Galegher J, Kraut RE, Egido C (eds). Lawrence
Erlbaum Associates: Hillsdale, NJ, 149–172.
Law AM, Kelton WD. 2003. Simulation Modeling and
Analysis, 3rd edn.l The McGraw-Hill Companies, Inc.: New York, 760.
Martin R. 2002. A hybrid model of the software devel-opment process.Systems Science Ph.D. Program. Portland State University: Portland, OR.
Meyer D. 1991. A. tech talk: how managers are stimulating
global R&D communication. Sloan Management Review
32(3): 49–59.
Myers GJ. 1976.Software Reliability: Principles and Practices. John Wiley and Sons: New York.
Norbjerg J, Havn EC, Bansler JP. 1997. Global production: the case of offshore programming.Wirtschaftsinformatik ‘97. Physica-Verlag: Berlin.
Pearce WB. 1974. Trust in interpersonal communication.
Speech Monographs41: 236–244.
Pegden CD, Shannon RE, Sadowski RP. 1990.Introduction
to Simulation using SIMAN. McGraw-Hill: NY.
Perry DE, Staudenmayer NA, Votta LG. 1994. People,
organizations, and process improvement.IEEE Software
11(4): 36–45.
Raffo D, Setamanit S. 2005. A simulation model for global software development project.The International Workshop on Software Process Simulation and Modeling Fraunhofer IRB: Stuttgart, Germany.
Rus I, Biffl S, Halling M. 2002. Systematically combin-ing process simulation and empirical data in support of decision analysis in software development.The Four-teenth International Conference on Software Engineering and Knowledge Engineering (SEKE’02). ACM: Ischia.
Schlesinger S, Buyan R, Callender ED, Clarkson WK, Perkins FM. 1974. Developing standard procedures for simulation validation & verification. The 1974 Summer Computer Simulation Conference, Houston, Texas.
Steiner ID. 1966. Models for inferring relationships between group size and potential group productivity.
Journal of Behavioral Science5(11): 273–283.
Wijayanayake J, Higa K. 1999. Communication media choice by workers in distributed environment.Information & Management36: 329–338.