Productivity
Commission
Staff Working Paper
An Integrated Tariff
Analysis System:
Software and Database
November 2004
Staff Working Papers are not for quotation without the permission of the authors.
The views expressed in this paper are those of the staff involved and do not necessarily reflect those of the Productivity Commission.
Matthew D. Forbes Jane M. Fry Patrick A. Jomini Alexandra Strzelecki
Inquiries about this staff working paper:
Media and Publications Productivity Commission Locked Bag 2 Collins St East Melbourne VIC 8003 Tel: (03) 9653 2244 Fax: (03) 9653 2303 Email: [email protected] General Inquiries: Tel: (03) 9653 2100 or (02) 6240 3200
An appropriate citation for this paper is:
Forbes, M.D., Fry, J.M., Jomini, P.A. and Strzelecki, A. 2004, An Integrated Tariff
Analysis System: Software and Database, Productivity Commission Staff Working
Paper, Melbourne, November.
Information on the Productivity Commission, its publications and its current work program can be found on the World Wide Web at http://www.pc.gov.au or by contacting Media and Publications on (03) 9653 2244.
FOREWORD III
Foreword
The Productivity Commission and its predecessor organisations have had a long-standing involvement in the quantitative analysis of trade and assistance regimes. In the context of market access negotiations in the Doha Development Round, various systematic approaches and formulas have been proposed to reduce tariffs. The Integrated Tariff Analysis System (ITAS) has been developed by Commission staff to assist researchers in analysing proposals to reduce tariffs in non-agricultural markets.
As a model, ITAS involves some simplification. It incorporates a framework to address data limitations that otherwise pose serious obstacles to analysing possible tariff reduction scenarios. Until those data limitations are addressed in a definitive way, an accurate representation of tariff structures is not possible, and the assumptions that are incorporated in models such as this one are required to assess different proposals. ITAS is designed, therefore, primarily for use by trade analysts and researchers, but also by negotiators who require an accessible way to assess the effects of different proposals.
A CD-ROM accompanies this paper. It contains data and the suite of programs that were used in the implementation of ITAS that is described in the paper. For a selection of countries and customs territories, the data consist mainly of disaggregated bilateral tariffs estimated at the 6-digit level of the harmonised system of classification, which can readily be used in further analysis.
Although the ITAS framework was initially developed to facilitate the analysis of tariff reduction schemes in selected non-agricultural markets, it might be used to expand the analysis to tariffs that affect agricultural trade and to include other countries or customs territories. This paper and the companion CD-ROM provide guidance on how this might be done.
Gary Banks Chairman
Productivity Commission November 2004
CONTENTS V
Contents
Foreword III Contents V Acknowledgements XI Abbreviations XIIIIDisclaimer and limits on use XIV
Glossary XV
1 Introduction 1
The ITAS framework 2
Other tariff analysis software 4
Structure of the paper 7
2 Preparing tariff and trade data for analysis 9
Applied and bound tariffs 9
Raw data 10
Converting raw data into standardised data 13
Master database 19
3 Tariff reduction scenarios 21
Tariff reduction scenarios in ITAS 22
Measuring the effects of each scenario 24
4 Tariff analysis – detailed and summary outputs 31
Analysing tariff change scenarios 31
Detailed results 32
Summaries 35
VI CONTENTS
Incorporating planned tariff changes 45
Non-ad valorem tariffs 46
Prohibitive tariffs 49
Non-tariff barriers 49
Variations in scenarios 51
Updating ITAS after the Doha Round 52
Including additional importing countries 52
A Data A.1
Product classifications A.3
B Tariff reduction formulas in ITAS B.1
Proportional reduction formula B.2
European formula B.4
Korean formula B.6
Swiss formula B.10
Flexible Swiss formula B.11
Chinese formula B.14
Girard formula B.18
C The cost of aggregation C.1
Tariffs averaged over line items or HS6 categories C.2
Tariff dispersion within HS6 categories C.6
Applying formulas to aggregated and disaggregated data C.12
D Structure of ITAS D.1
Master data preparation module D.2
Import tariff module D.16
Market access module D.19
Price module D.22
Tariff revenue module D.23
Economic modelling input module D.25
E FAQs E.1
Deriving new results from ITAS E.1
Using existing results from ITAS E.5
CONTENTS VII
BOXES
2.1 The cost of aggregation — average tariff levels and dispersion 12
2.2 Timeframe for bound and applied tariff data (part 1) 17
2.3 Timeframe for bound and applied tariff data (part 2) 19
3.1 The cost of aggregation — effects on final rates 22
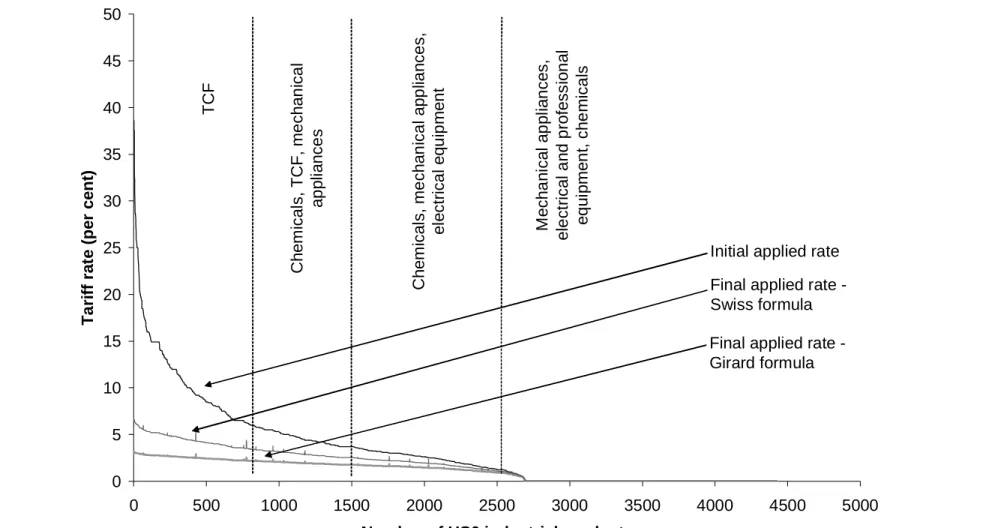
3.2 Weighted and unweighted averages 23
3.3 Average change and change in the average 26
3.4 Estimating changes in applied tariff rates 28
FIGURES
1.1 Types of tariff data available from ITAS 3
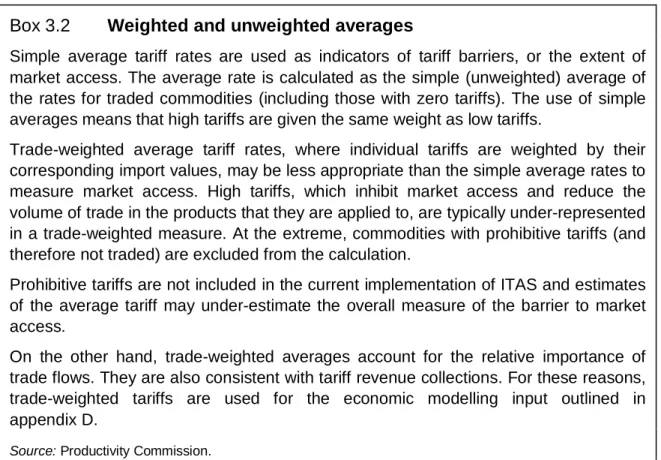
4.1 Initial tariff distribution and effects of selected formulas, estimated
MFN rates, US 39
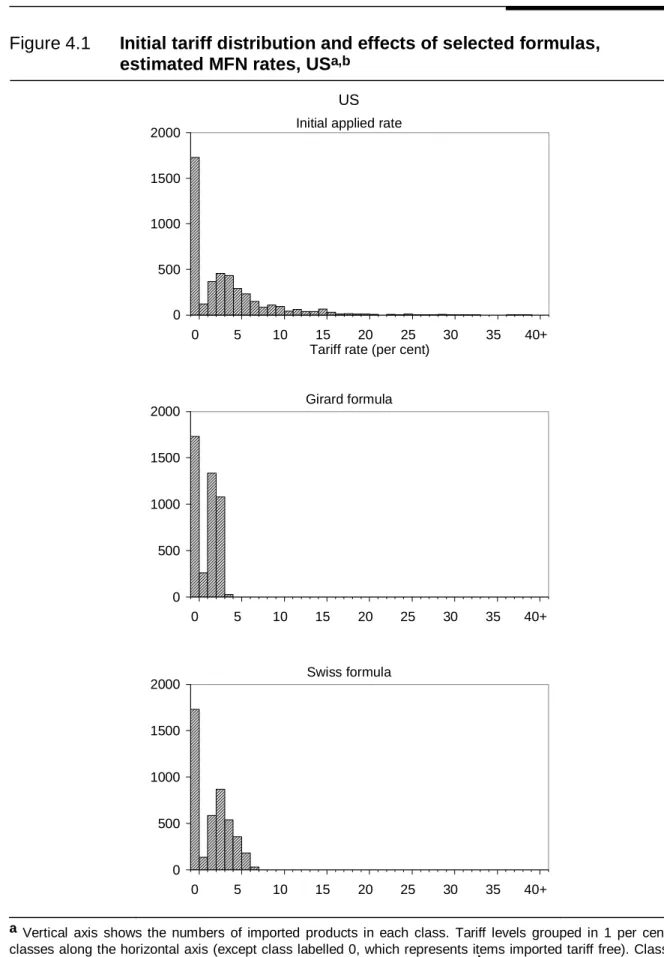
4.2 Initial bound and applied (MFN) tariffs on industrial products, by
HS6 item, US 41
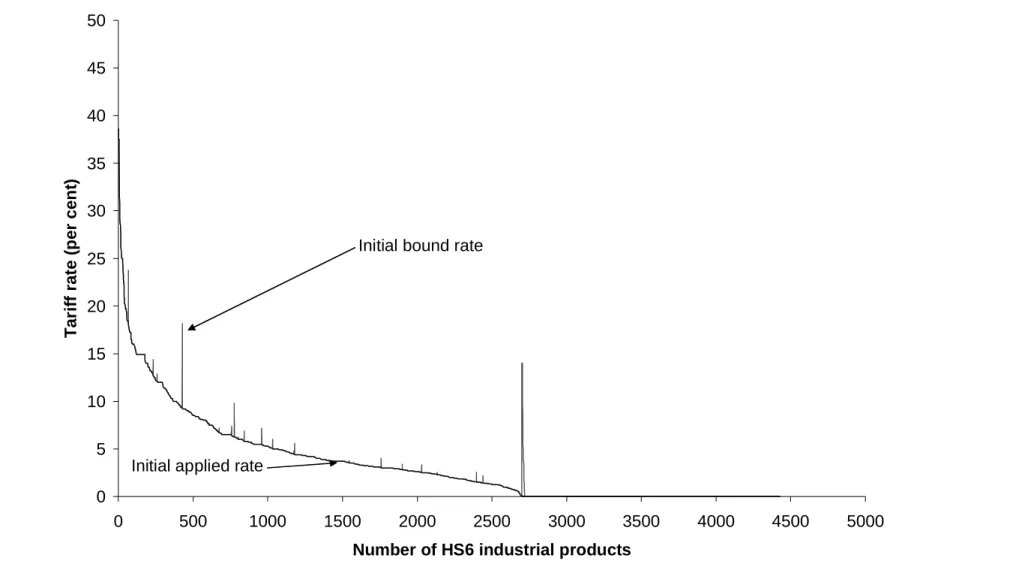
4.3 Effects of selected formulas on tariffs on industrial products, by HS6
item, US 42
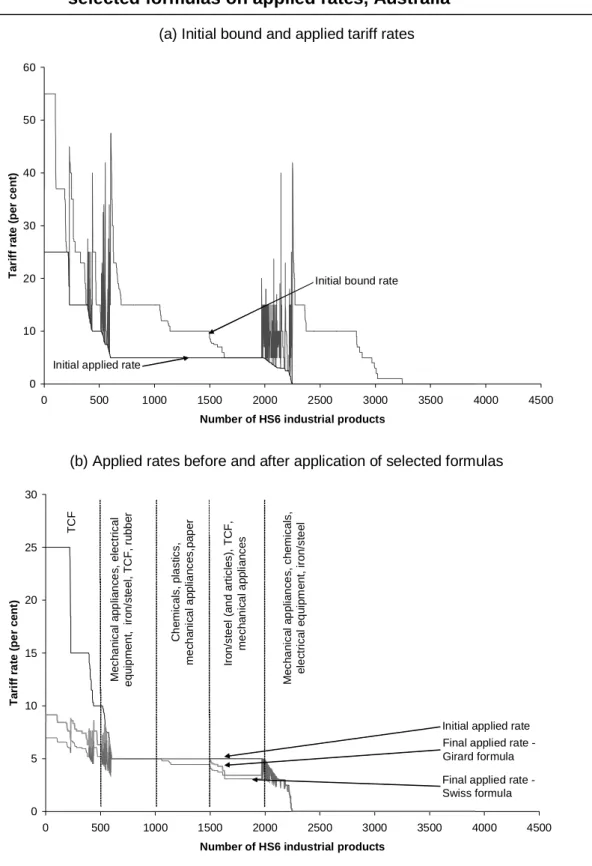
4.4 Bound and applied tariffs on industrial products and effects of
selected formulas on applied rates, Australia 43
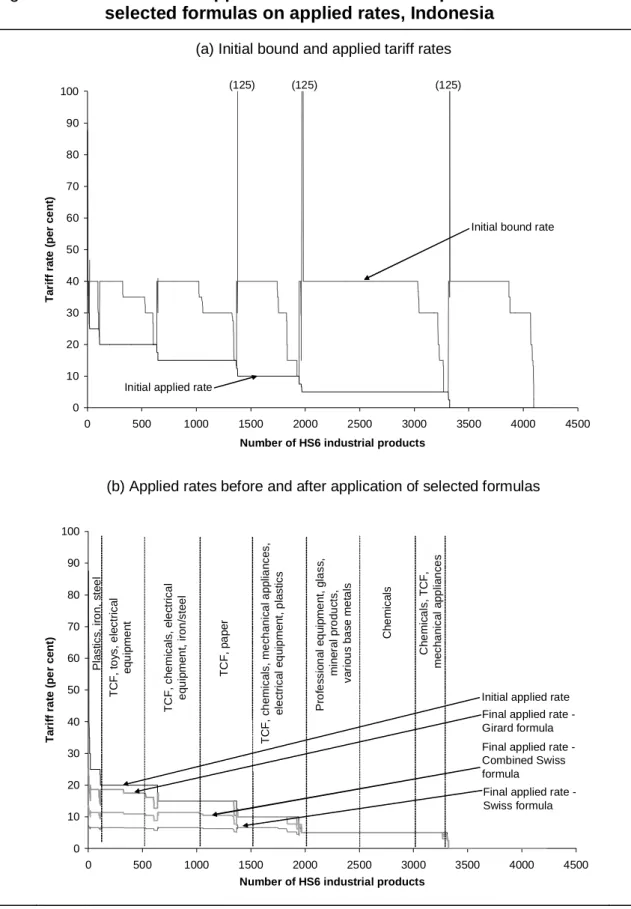
4.5 Bound and applied tariffs on industrial products and effects of
selected formulas on applied rates, Indonesia 44
B.1 Final tariffs and reductions with proportional reduction formula B.2
B.2 Final tariffs and reductions with European formula B.5
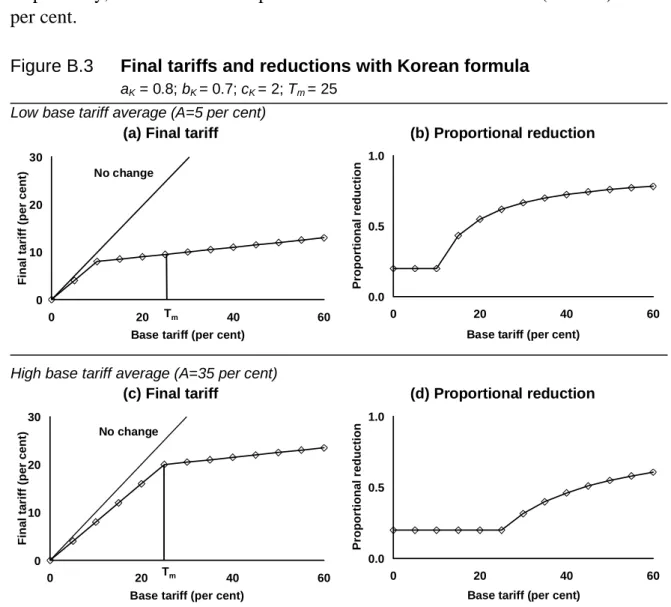
B.3 Final tariffs and reductions with Korean formula B.8
B.4 Korean formula producing negative final tariffs B.9
B.5 Final tariffs and reductions with the Swiss formula B.11
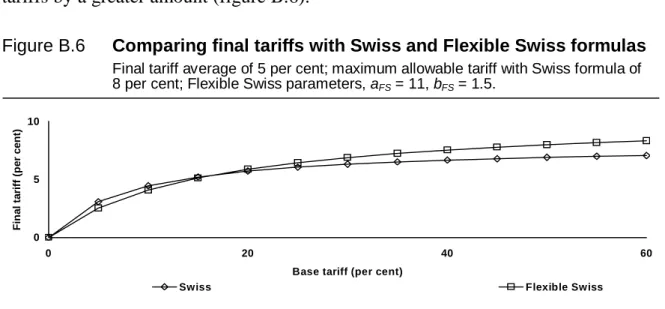
B.6 Comparing final tariffs with Swiss and Flexible Swiss formulas B.12 B.7 Final tariffs and reductions with the Flexible Swiss formula B.13
B.8 Final tariffs and reductions with the Chinese formula B.15
B.9 Final tariffs with an adjusting coefficient less than one B.16
B.10 Final tariffs for low tariffs in a low tariff structure with Chinese
formula B.17
B.11 Final tariffs and reductions with the Girard formula B.19
C.1 Percentage difference between HSx and HS6 bound rates C.17
VIII CONTENTS
C.3 Percentage difference between HSx and HS6 bound rates C.19
C.4 Percentage difference between HSx and HS6 bound rates C.20
C.5 Percentage difference between HSx and HS6 applied rates C.21
C.6 Percentage difference between HSx and HS6 applied rates C.22
C.7 Percentage difference between HSx and HS6 applied rates C.23
C.8 Percentage difference between HSx and HS6 applied rates C.24
D.1 Structural summary of the ITAS D.1
D.2 Summary of master data preparation module D.3
D.3 Module for preparing final data — Australia D.4
D.4 Module for preparing final data — Bangladesh D.6
D.5 Module for preparing final data — EU D.8
D.6 Module for preparing final data — Japan D.10
D.7 Module for preparing final data — Thailand D.12
D.8 Module for preparing final data — US D.14
D.9 ITAS processing — import tariff module D.17
D.10 ITAS processing — market access module D.20
D.11 ITAS processing — price module D.23
D.12 ITAS processing — tariff revenue module D.25
D.13 ITAS processing — economic modelling input module D.27
TABLES
2.1 Raw data and standardised data for conducting multi-country tariff
analysis 13
2.2 Primary data issues, solutions and comments 14
2.3 Ad valorem, non-ad valorem and AVE bound tariffs, by country 15
2.4 Ad valorem, non-ad valorem and AVE MFN tariffs, by country 16
3.1 ITAS tariff reduction scenarios 24
3.2 Result variables created under each tariff reduction scenario 24
4.1 Result variables included in ITAS 33
4.2 Detailed results, extract from the master database 34
4.3 Selected summary averages generated by ITAS 36
4.4 Effect of the Swiss, Girard and Combined Swiss formulas on
average applied tariffs, selected countries 37
5.1 Incidence of non-ad valorem (NAV) bound tariffs for agricultural
CONTENTS IX 5.2 Incidence of non-ad valorem (NAV) MFN tariffs for agricultural and
industrial products 48
5.3 Total commodity trade and trade in industrial products, by country 51
5.4 Other formulas used by ITAS 52
A.1 Features of primary trade and tariff data for industrial products A.2 A.2 Importing economies included in ITAS and their program
abbreviations A.3
A.3 Industrial product coverage A.4
A.4 Textile, clothing and footwear products A.5
A.5 Automotive products A.6
A.6 Chemical products A.7
A.7 Fish products A.7
A.8 Timber products A.7
A.9 Leather products A.8
A.10 Gems products A.8
A.11 Electrical products A.8
B.1 Pursuing tariff reduction goals with each formula B.3
B.2 Values for aFS, bFS, maximum bound tariff and target average tariffs
in Flexible Swiss scenario B.14
C.1 Tariff averages calculated using line items (HSx) and aggregated
(HS6) data C.5
C.2 Number of HS6 items affected by bound rate dispersion C.7
C.3 HSx bound tariffs within 20 per cent of corresponding HS6 rates C.8
C.4 Number of HS6 items affected by applied rate dispersion C.10
C.5 HSx applied tariffs within 20 per cent of corresponding HS6 rates C.11 C.6 Effects of aggregation process on bound rates following application
of Swiss8 formula C.14
C.7 Effects of aggregation process on final applied rates following
application of Swiss8 formula C.16
D.1 File list — generating final data for Australia D.5
D.2 File list — generating final data for Bangladesh D.7
D.3 File list — generating final data for EU D.9
D.4 File list — generating final data for Japan D.11
D.5 File list — generating final data for Thailand D.13
D.6 File list — generating final data for US D.15
X CONTENTS
D.8 File list — market access module D.21
D.9 File list — price module D.23
D.10 File list — tariff revenue module D.25
D.11 File list — economic modelling input module D.28
ACKNOWLEDGEMENTS XI
Acknowledgements
The authors would like to thank Jonathan Pincus from the Productivity Commission, Troy Podbury from the Australian Bureau of Agricultural and Resource Economics (ABARE), Frances Lisson and her colleagues from the Australian Government’s Department of Foreign Affairs and Trade, Sebastien Jean from the Centre d’Etudes Prospectives et d’Informations Internationales (CEPII) and Will Martin from the World Bank for helpful comments on a draft of this paper. Rick Johnson and Andrew Smith are gratefully acknowledged for their contributions to the formula analysis contained in appendix B. The authors would also like to thank participants at a Productivity Commission seminar for helpful comments.
Peter Cribbett, Dee Hanek and Wendy Maloney are gratefully acknowledged for providing research, editorial and administrative assistance.
ABBREVIATIONS XIII
Abbreviations
ABS Australian Bureau of Statistics
AMAD Agricultural Market Access Database
AVE Ad valorem equivalent
CEPII Centre d’Etudes Prospectives et d’Informations
Internationales (Centre for International Prospective Studies)
CGE Computable General Equilibrium
COMTRADE Commodity Trade Database
CTS Consolidated Tariff Schedule
GTAP Global Trade Analysis Project
HS Harmonised system
IDB Integrated Database
ITAS Integrated Tariff Analysis System
ITC International Trade Centre
LDCs Least-developed countries
MAcMap Market Access Map
MFN Most-favoured nation
NGMA Negotiating Group on Market Access
NTBs Non-tariff barriers
PC-IDB Personal Computer Integrated Database
PUR Post-Uruguay Round
SITC Standard International Trade Classification
TRAINS Trade Analysis Information System
UNCTAD United Nations Conference on Trade and Development
UNSD United Nations Statistical Division
WCO World Customs Organisation
WITS World Integrated Trade Solution
XIV DISCLAIMER AND LIMITS ON USE
Disclaimer and limits on use
1. To the extent permitted by law, the Commonwealth of Australia, the Productivity Commission and the World Trade Organisation (the Agencies) give no warranty of any type, either express or implied, for ITAS and its supporting databases (the Program), the Staff Working Paper, and any other material supplied with the Program.
2. To the extent permitted by law, the entire risk of loss, damage or unsatisfactory performance of the Program rests with any user (the User). In no event will the Agencies be liable for damages, including any general, special, incidental or consequential damages, arising out of the installation of the Program, any attempt to install the Program, the use of the Program, the inability to use the Program, the use of data obtained from the Program or the use of any documentation or other material accompanying the Program.
3. The numerical data and formulas contained in the Program are provided solely for the purpose of illustrating the capabilities of the ITAS framework. The Agencies give no warranty as to the accuracy, reliability, timeliness or other features of any data contained in the Program or data obtained from using the Program. The numerical data and formulas contained in the Program and the output of the Program should not be regarded as representative of any current negotiating framework or of any trade negotiations. Specifically, results presented in the Program and accompanying materials do not account for a number of aspects integral to the negotiating framework, in particular, those providing for flexibility for developing countries, the least-developed countries not being required to undertake reduction commitments, and possible credits for autonomous liberalisation (on a basis to be determined). For example, the Program illustrates the possible effects of applying formulas for reducing the tariffs of certain least-developed countries, which may have relevance only in the event of a unilateral decision by the country concerned to undertake reductions of such a nature outside of the scope of the negotiating modalities of the round. The results should not be taken to express or imply a requirement for, a commitment to, or a view favouring, tariff reductions inconsistent with the negotiating modalities of the round expressed in decisions by WTO bodies. 4. The numerical data and formulas contained in the Program do not represent any country’s negotiating
position or commitment regarding tariffs. The numerical data and formulas do not represent any commitment by parties to any WTO negotiations. The formulas used in the Program have properties similar to a number of those which have been discussed in the Negotiating Group on Market Access. The formulas are included in the Program for illustrative purposes only. Their inclusion does not imply that the form in which they have been included, what they take into account or what they omit, has any particular status in any trade negotiations.
5. The User should rely on the User’s own inquiries to determine the current situations in, commitments, or negotiating positions of, a particular country or category of countries regarding tariffs.
6. The words, including designations, used in the Program and the Productivity Commission Staff Working Paper accompanying the Program do not express or imply any opinion whatsoever on the part of the Agencies concerning the legal status of any country, territory, city, or area, or of its authorities or its government, or concerning the delimitation of its frontiers or boundaries.
7. The Program is a model only. Tariff-line level data have been averaged to the 6-digit level. Accordingly, results obtained from the Program may not necessarily match results obtained from applying tariff reduction formulas at the tariff-line level for individual countries. The Program and accompanying material use terminology, explained in the Glossary to the Productivity Commission Staff Working Paper, that does not necessarily match that used in negotiations.
8. The Program is made available to Users for their own internal use only and may not be provided or re-disseminated by them in any form to any other party.
9. The User may modify the Program. However, the Productivity Commission would appreciate being informed of any modifications made by the User and being offered the opportunity to add any extra data and modifications to its version of the Program. When making modifications of the Program available to the Commission, please also explain who created the material contained in the modifications.
GLOSSARY XV
Glossary
Applied tariff rate Estimate of the tariff rate paid by importers of a product.
Estimated by dividing customs duty paid by import value. Applied tariff rates are estimated for each bilateral trade flow included in ITAS.
Average tariff rate A simple (usually unweighted) average of the tariff rates on a
group of items.
Base tariff rate Tariff rate used as a basis for calculating a new rate.
Bound tariff rate The maximum tariff on an import to which a member
commits. This rate is legally binding under the WTO and applies on a most favoured nation (MFN) basis. WTO negotiations have been conducted on the basis of bound rates.
Compression Reductions in tariffs where high tariffs are reduced by a
greater proportion than low tariffs. Compression results in a decrease in tariff dispersion and the tariff average.
Consolidated Tariff Schedule (CTS)
Database maintained by the WTO Secretariat, which contains, among other things, members’ commitments to reduce bound rates. Commitments negotiated under the Uruguay Round are expected to be largely implemented by 1 July 2005.
Developing economies
In ITAS, mostly middle income countries (as defined by the World Bank), and least-developed countries. Includes countries in Asia (excluding Japan); Central and Eastern Europe; the Middle East and Latin America and Africa. See table A.2 for those included as importing countries in ITAS.
Dispersion The spread of tariffs in a tariff structure.
Estimated most-favoured-nation rate
In ITAS, estimated as the maximum rate applied across source countries at the 6-digit level.
XVI GLOSSARY
Final database In the current implementation, a collection of 38 files (one
for each country and set of formulas) containing initial and final tariffs on bilateral imports under each tariff reduction scenario. The final database forms the basis for the
summaries and detailed analysis of the effects of formulas.
Final tariff rate Tariff rate derived from an initial tariff by using a formula.
Formula A mathematical relationship between initial and final tariffs.
A formula frequently contains one or more parameters, each of which must be given a numerical value in order to use the formula.
Harmonisation Term used to describe the reduction in levels and dispersion
of tariffs (see compression). Also used in submissions by WTO members to refer to the convergence of tariffs to a low level within a sector.
Harmonised system (HS)
Harmonised Commodity Description and Coding System. A coded classification of traded products, managed by the World Customs Organisation.
High tariff items In ITAS, items with initial applied rates greater than 15 per
cent.
Industrial products
All products other than those classified as agricultural products in Annex 1 of the WTO Agriculture Agreement. Mostly classified in chapters 25 and above of the harmonised system (HS) of commodity classification. Industrial products include: manufactured products; mining products; timber and timber products; and fish and fish products. Excludes food processing (except fish processing). Also referred to as non-agricultural products.
Industrialised economies
WTO members that do not self-select their development status as a developing country. Typically they are economies with high per capita incomes, including most OECD
countries. See table A.2 for the industrialised economies included as importers in ITAS.
GLOSSARY XVII
Initial database In the current implementation, a collection of 19 files (one
for each country in the analysis) containing initial bound and applied ad valorem (or equivalent) tariffs on imports from each of their trading partners. For each country, tariffs are aggregated to the 6-digit level and bindings are estimated for unbound items. The estimated tariffs in the initial database form the basis for the tariff reduction scenarios.
Initial tariff rate The rate from which the new (final) rate is derived using a
formula. Also called the base rate.
Integrated Database (IDB)
Database maintained by the WTO Secretariat detailing, among other things, tariffs applied by members and corresponding import volumes and values. The data are typically kept at a disaggregated commodity level and report bilateral flows.
Least-developed countries (LDCs)
Countries that the United Nations has identified as suffering from disadvantages that have hindered their economic development.
Members Countries or customs territories that are members of the
WTO.
Most-favoured-nation (MFN)
WTO principle that a measure applied by a member affecting trade in a good (or service) should offer, and be applied in a way that offers, the same competitive opportunities to all other members.
MFN rate The rate of duty for a product originating from an MFN
supplier. A product originating from non-MFN suppliers may be subject to a different rate of duty from the MFN rate, depending on whether suppliers are from a territory outside of the WTO (may be higher), or covered by a GSP or GSTP scheme (often lower) or a customs union or free trade area (a final rate of zero for covered products). MFN rates are
imposed at the line item level, which may be more disaggregated than the 6-digit level. In these cases, a corresponding rate for the 6-digit level is estimated. See estimated most-favoured-nation rate.
XVIII GLOSSARY
Prohibitive tariff Tariff at a level that discourages the import of a product in
any quantity.
Parameter A component of a formula. The parameters in a formula must
be given numerical values to derive a final tariff from an initial tariff.
Post-Uruguay Round bound rate
Final bound rate committed to by a WTO member either under the Uruguay Round agreements or under a more recent tariff concession in relation to the product concerned,
whichever is later. Most commitments are binding by 1 July 2005, but some may be implemented as late as 2015.
Preferential rate Tariff rate below the MFN rate. Under WTO rules, such
preferential treatment can exist, for example, between countries that are part of a free-trade area or as part of the Generalised System of Preferences.
SAS Statistical Analysis System. An integrated system of
software products for data management, processing and analysis.
Unbound item Item in relation to which a WTO member has not entered
INTRODUCTION 1
1 Introduction
Part of the Productivity Commission’s mandate is to monitor trends in trade and assistance. This, along with its ongoing interest in multilateral liberalisation, has led the Commission to develop a tool to analyse patterns of tariffs and the possible effects of different approaches to reducing tariffs.
Different tariffs apply to bilateral flows of thousands of commodities that are traded between hundreds of countries. Although tariff negotiations are conducted in terms of bound rates, the economic effects of reducing tariffs are a function of changes in applied rates, which may be most-favoured-nation (MFN) or preferential rates. There are therefore many tariff rates, and analysing their structure and the possible effects of different approaches to reducing them is made difficult by the size of the datasets. Much of the data are not provided in a consistent format across countries, adding to the difficulties of analysing such data.
Aside from any limited distribution software that might be used by individual countries to support their trade negotiators, there are few publicly available means to handle the large amounts of bilateral trade and tariff data in a consistent way. The software systems that are publicly available, such as the World Integrated Trade Solution (WITS) and Market Access Map (MAcMap), are limited in their ability to produce summaries and scenario analyses. Moreover, many analyses are based on MFN rates only and do not account for the effects of preferential rates.1
To fill this gap, the Productivity Commission has developed an Integrated Tariff Analysis System (ITAS) to provide an analytical framework with which to:
• analyse current tariff structures;
• calculate effects on tariffs and prices of formula-based changes in tariffs;
• calculate shocks in tariffs to simulate trade liberalisation scenarios (for example, with the Global Trade Analysis Project (GTAP) model);
• calculate effects of tariff reductions on indicators of market access, such as average tariffs and prices; and
• calculate the effects of tariff reductions on customs revenues.
1 For example, the Global Trade Analysis Project (GTAP) database version 5 contains only MFN rates.
2 INTEGRATED TARIFF ANALYSIS SYSTEM
ITAS incorporates a systematic system for dealing with the data limitations that limit researchers’ ability to analyse possible tariff reduction scenarios in a multi-country, multi-product setting. Until the data limitations are addressed, a fully accurate representation of tariffs will not be possible, and researcher will have to rely on assumptions such as those incorporated in ITAS and similar systems.
The current implementation of ITAS covers:
• 19 importing countries (table A.1). Together these countries’ imports represent 56 per cent of world trade; and
• industrial products, which represent 93 per cent of commodity trade for these countries.
The ITAS framework consists of a suite of SAS programs that convert raw tariff data into a consistent form for analysis. The system also includes a facility to calculate the effects of various tariff reduction scenarios by using formulas to derive new tariffs from existing tariffs. Thus, subject to data availability, ITAS can be used to analyse the current structure of bound and applied tariffs and the possible effects of different tariff reduction schemes on these structures.2
The ITAS framework
ITAS relies on the World Trade Organisation’s (WTO’s) Integrated Database (IDB) and Consolidated Tariff Schedule (CTS).3 To the extent that these primary data sources are up to date, ITAS can be used to analyse current tariff structures. It is worth noting, however, that in many countries, tariffs do not change very quickly and, therefore, a tariff database a few years old can be a reasonable representation of current tariffs.4
The ITAS converts raw tariff data into three main forms (figure 1.1):
• standardised data, consisting of tariffs for each bilateral trade flow of each commodity in a consistent form (initial database);
• derived data, consisting of new tariff rates calculated from a variety of tariff reduction formulas (final database); and
2 ITAS is not designed to forecast actual outcomes of tariff negotiations. This is because the level of applied rates is at the government’s discretion, subject to the final bound rate.
3 WTO copyright of the original data is gratefully acknowledged.
4 Post-Uruguay bound rates are available in ITAS but trade and applied tariff data are available in most cases for 1999 or earlier.
INTRODUCTION 3
• extracted/summarised data, consisting of various datasets that contain sections of the standardised and derived data (for example, for particular countries or commodity sectors) or aggregations of the data for subsequent analysis.
The datasets produced by the ITAS satisfy most data requirements for standard tariff analysis using MS Excel, with no need for additional SAS programming. However, SAS is still required to run ITAS.5 Researchers experienced in the use of SAS might wish to produce other summaries and analyses. The structure of the program suite, described in appendix D, should enable these researchers to identify where they might wish to intervene. The entire system can be run from a batch file called COMBB.BAT.
Figure 1.1 Types of tariff data available from ITASa
Raw tariff data
(various levels of product category definition)
↓
Standardised tariff data (initial database)
(consistent product categories, ad valorem equivalent rates for some tariffs, no missing tariffs, applied rates consistent with post-Uruguay bound rates)
↓
Derived tariff data generated using various formulas (final database)
(final bound and applied rates under various tariff reduction scenarios)
↓
Extracted and summarised data
(individual tariffs, simple averages, trade-weighted averages, percentage changes between initial and final data)
a The processes that convert the raw data into standardised data, derived datasets and extracted or summarised datasets are accomplished using SAS programs. The structure of the programming system is set out in appendix D.
Source: Productivity Commission.
The ITAS’ detailed and disaggregated database preserves the maximum information for users who need to find out the tariff rates on a commodity exported from one country to another. In addition to the detailed data, ITAS generates standard supplementary datasets that extract and summarise the data in several ways. Examples include: tariffs on a country’s exports to specific destinations, for each commodity; average tariffs faced by a country’s exports; and tariffs averaged across
5 The basic program structure in appendix D could be implemented with another programming language. However, the size of the database may limit the choice of platform.
4 INTEGRATED TARIFF ANALYSIS SYSTEM
a country’s entire tariff schedule or across a group of commodities.6 ITAS was developed for analysis of tariffs on non-agricultural products, but can be extended to allow analysis of tariffs on agricultural products and trade flows.
Other tariff analysis software
As a result of the differing needs of users, several software applications for tariff analysis have been developed. Other systems for analysing tariffs include the World Bank’s World Integrated Trade Solution (WITS); the International Trade Centre (ITC) and Centre d’Etudes Prospectives et d’Informations Internationales’ (CEPII) MAcMap; and the WTO’s Personal Computer Integrated Database (PC-IDB).
Each of these systems complements the others by including core information (bilateral tariff data at HS6 level) and providing capabilities that are not available elsewhere.7 No single system combines all the information and analytical capabilities offered by these systems.
WITS
WITS is a windows-based software system for trade and tariff analysis. It currently allows users to combine trade and tariff data from the Commodity Trade Database (COMTRADE) compiled by the United Nations Statistical Division (UNSD); the Trade Analysis Information System (TRAINS) compiled by the United Nations Conference on Trade and Development (UNCTAD); and the IDB and CTS compiled by the WTO.8
WITS has been designed as a user-friendly way to access trade and tariff data and to examine the effects of various tariff reduction scenarios. WITS contains detailed, comprehensive tariff and trade data for over 80 countries. For many of these countries, annual data are available for 1995–2001 inclusive. Users can extract and
6 Export destinations for a given country are limited to the remaining importing countries currently included in ITAS.
7 For ease of exposition, we refer to the disaggregated level (which typically refers to tariff line items) as HSx. Many countries use an HS8 classification while others use an HS10 classification. Very few use an HS12 or more detailed classification. The lower levels of aggregation are based on classification systems that are peculiar to each country or customs territory concerned. Only the HS6 classification is consistent across countries.
8 And other protection databases, like the Agricultural Market Access Database (AMAD) for agriculture. Access to these databases is restricted and WITS users must register to use them. However, any WITS user can analyse aggregated WTO data at the 6-digit level. See WITS website for conditions of use.
INTRODUCTION 5 summarise the data by submitting data queries over the Internet and simulate the effect on bound and applied rates of various proposals made during the Doha round. Product and country groupings can be customised to suit the user’s purposes via a range of product and country classifications and concordances. Both weighted and unweighted aggregates are available.
WITS provides comprehensive tariff information for many countries in a user-friendly manner. However, several limitations currently restrict its usefulness for analysing tariff reduction scenarios.
The tariff simulation facility in WITS allows users to analyse the effects on tariffs of formulas specified in the main Doha proposals (US, EU, Korea, China, India, Girard), but users are not currently able to add new formulas or change how the formulas are implemented (for example, changing parameter values or the treatment of missing values).
Final bound and applied rates are available bilaterally for each tariff item but the system does not calculate percentage changes in tariffs and in duty-paid prices.9
Comparing the effects of different formulas requires running the simulator for each formula separately. The results must then be exported and combined using another application.
Although WITS provides initial and final tariff data at the line item level and corresponding average tariffs for groups of items, other applications such as Excel are still required to chart results, or to perform additional statistical analysis, including the production of changes in average rates and other summaries.
MAcMap
MAcMap (Bouët et al. 2004) is a joint product of CEPII and ITC (UNCTAD-WTO). It combines detailed trade and protection data for 137 importing countries (and 223 exporting partners). Data sources are: TRAINS (UNCTAD) source files; national sources; AMAD; and notifications from WTO Member Countries regarding their anti-dumping regimes. Protection data include applied tariffs, prohibitions, tariff quotas and anti-dumping duties at a detailed level. For each line item, importing country and partner, protection data are combined into an import-weighted ad valorem equivalent tariff for which trade weights are based on a reference group of countries.
6 INTEGRATED TARIFF ANALYSIS SYSTEM
MAcMap is designed to provide a detailed picture of the current state of protection. It is not designed to calculate the effects of formulas on the current state of protection because it does not include bound rates and does not include a facility to implement tariff reduction schemes.
PC-IDB
PC-IDB (WTO 2002d) combines detailed tariff and trade data for an individual reporting country from the CTS and IDB. Users can examine the latest available bound and applied tariff structures across all imported products for each WTO Member country.
PC-IDB is designed to allow users to query current and historical bound and applied tariffs at the line item level. The detailed nature of the data mean that the use of PC-IDB is restricted to WTO authorised users. Currently there is no facility for using tariff reduction formulas.
ITAS complements other systems of analysis
ITAS is designed to analyse disaggregated tariffs at various levels of sectoral aggregation and whole schedules. It complements other systems for analysing trade barriers.
ITAS includes data on both applied and bound tariffs, allowing users to gauge the relative economic significance of changes in tariffs.
A number of tariff reduction formulas are included in ITAS, allowing users to analyse effects on bound and applied rates under various scenarios. The ability to change the SAS programs means that ITAS is flexible and can be adapted to examining formula-based tariff reductions and other modality issues. For example, users can change the tariff reduction formulas, change the treatment of unbound items, add countries, include non-ad valorem tariffs or include agricultural border measures in their analysis.
As a tariff analysis system, ITAS is transparent. Users can examine the programming structure and code and see exactly how the raw data are processed, how formulas are implemented and how the effects of tariff reduction formulas are summarised.
Even with the limited number of countries in the current implementation, ITAS produces detailed tariff analysis at the bilateral level.
INTRODUCTION 7 The current implementation of ITAS caters for three types of user: those wanting ready-to-use data and results; those wanting to examine the effects of a different set of tariff reduction formulas; and those wanting to change the more fundamental aspects of the system.
Most users will be interested in either using existing results or in changing the formulas and re-running ITAS. For these users we have included: the initial database at the HS6 level; the programs required for implementing formulas and generating a full set of output; and a set of ready-to-use output files for each analysis module.
Some users may wish to modify the more fundamental aspects of the system, for example, adding importing countries, updating the data or changing how post-Uruguay applied rates are estimated. For these users, there is a supplementary CD-ROM containing the raw data required to run ITAS from the beginning. To comply with WTO restrictions on the data, this supplementary CD-ROM is only available to authorised users of WTO data.
Structure of the paper
This paper forms part of the documentation of the ITAS framework. A CD-ROM contains the SAS programs, an initial database on which the programs are based and the output files. Information is also available on the Productivity Commission web site at www.pc.gov.au.
The remainder of this paper provides an overview of ITAS and how it converts raw data into the data required for analysis and presentation. Chapter 2 describes the raw data on tariffs and explains how these data are converted into a form suitable for multi-country analysis of tariffs. Chapter 3 contains an explanation of how formulas are used to calculate final tariff rates from initial rates. Chapter 4 describes the resulting tariff data created by ITAS and the available data summaries. Chapter 5 outlines some ways in which ITAS could be extended.
Appendix A outlines the primary data sources, describes the data and explains some of the data issues that had to be addressed in order for ITAS to produce a consistent analysis. Appendix B provides a detailed explanation of the formulas currently included in ITAS. Appendix C contains estimates of the differences between results based on calculations at the HS6 level and at the line item level. Appendix D shows the structure of ITAS, provides instructions for running the system and contains a list of ITAS input and output files. Appendix E provides answers to some frequently asked questions.
PREPARING TARIFF AND TRADE DATA FOR ANALYSIS
9
2
Preparing tariff and trade data for
analysis
This chapter describes the raw tariff data available from the WTO and the procedures used in ITAS to convert the data into a consistent form that is suitable for multi-country analysis of tariffs.
Each member country is required to provide the WTO with tariff and trade data for its imports of thousands of types of commodity from about 200 trading partners.1 In ITAS, these tariff data are used to examine the level and structure of existing tariffs, and to calculate new tariffs that are likely to result from particular approaches to reducing them. Further, tariffs affecting exports can be compared. Variations between countries in data format impede inter-country comparisons and detailed analysis. A variety of other data issues (such as dealing with missing values) must also be addressed prior to any analysis.
Applied and bound tariffs
Data are available for applied and bound tariffs. An applied tariff is the actual duty on a commodity paid by an importer. An importing country can impose different tariff rates on a commodity, according to the source country: in addition to the MFN rate, there are various preferential rates that might stem from bilateral or unilateral preferential agreements or concession arrangements.
For some products, tariffs are set at a level that is high enough to discourage users in a particular country from importing that product from another country. Since the available data only cover traded products for each country, these prohibitive tariffs are not captured in the data and thus represent a limitation of ITAS.
A bound tariff is a commitment to a ceiling on the applied tariff for that item during a specified period. That is, the bound tariff is the maximum tariff that may be
1 Some WTO members do not provide bilateral trade data. Non-members do not provide trade or tariff data to the WTO, nor are they required to.
10 INTEGRATED TARIFF ANALYSIS SYSTEM
imposed on imports of a particular commodity over the period of time for which the commitment has been made. In some countries, the applied tariff for a particular commodity can be significantly lower than the corresponding bound tariff.
Tariffs become bound when binding commitments are introduced. Commitments might arise, for example, as part of a round of multilateral trade negotiations between WTO members, or as part of the accession process by which countries become members of the WTO.
Many items have bound tariffs. However, there are still some items for which no binding commitment has been made. Tariffs on these items are referred to as
unbound tariffs.
Tariff negotiations are conducted on the basis of bound tariffs. This allows some flexibility in applied rates imposed by countries while providing some certainty in trading arrangements. Negotiations include unbound items by imposing a binding that typically coincides with the current MFN applied tariff, allowing tariff reductions to be calculated for all products. ITAS adopts a similar treatment by estimating a bound rate for unbound items as the maximum applied rate for the product across all trading partners.2
Although approaches to tariff reduction focus on bound tariffs, the economic effects of tariff reductions depend on changes in prices that result from changes in applied tariff rates. That is, consumers and firms respond to the changes in duty-paid prices that occur as a result of changes in applied tariffs. For this reason, examining an approach to tariff reduction requires an analysis of effects on bound and applied rates and on prices. Further, trade flow data are required to gauge the relative economic significance of changes in tariff rates on individual items.
Raw data
Detailed, comprehensive tariff data are required to conduct tariff analysis at a disaggregated level, for example when comparing the effects of a tariff reduction formula on the structure of tariffs for different countries. The WTO’s Integrated Database (IDB) and Consolidated Tariff Schedule (CTS) provide such data for most member countries.3 Although the data are provided in a similar format for each country, some processing is required before the data are used for multi-country tariff comparisons.
2 In general. However, the implications of the Girard proposal to use twice the MFN rate were also modelled. Any other rule can be implemented in the SAS program.
PREPARING TARIFF AND TRADE DATA FOR ANALYSIS
11 The IDB contains detailed data on bilateral trade flows for a particular year. These data are provided from the importing side of the trade flow. That is, each member country submits data to the WTO on its imports of each type of commodity from each trading partner.4 Each commodity–partner combination is referred to as an item and has an import value and various tariffs associated with it. These data are then consolidated and included in the IDB, which consists of one set of files for each importing country.
The CTS contains bound tariffs (where they exist) for each type of commodity imported by each WTO member country (source country). These bound rates include those applicable before the Uruguay Round agreements came into effect (referred to as pre-Uruguay bound rates) and those that have been agreed to be put in place (mostly before 2005) as part of the Uruguay Round agreements (referred to as post-Uruguay bound rates).
Commodity definitions
All member countries classify commodities based on the 6-digit Harmonised System (HS6) (World Customs Organisation (WCO) 1996). However, most countries provide data at a more disaggregated level, which reflects the details of their individual tariff schedules. For example, Australian data follow an 8-digit classification that adds more detail to the HS6 classification. Korean data are classified at an even more detailed (10-digit) level. Nevertheless, classifications beyond the 6-digit level are not necessarily comparable across countries.
These variations between countries in the level of commodity detail mean that the raw data must be aggregated to the HS6 classification for multi-country comparisons.5 At the conclusion of negotiations, a formula will be agreed upon and used at the line item level to determine a final bound rate for each item. However, in ITAS tariff rates are aggregated to the HS6 level for ease of processing.6,7 This aggregation is achieved by taking the simple average of tariffs on items within each
4 In most cases. However, Bangladesh does not provide any export partner disaggregation.
5 In general, the order of processing is as follows: deal with missing data; estimate ad valorem equivalents (Australia only); estimate post-Uruguay applied rates; and then aggregate to HS6 level. However, Australia, Bangladesh, Japan and Thailand provide the WTO with applied tariff data at a more detailed level than their bound tariff data. For these four countries, applied tariffs are aggregated to match their HS6 bound tariff classification prior to performing other processing tasks.
6 ITAS estimates of tariff levels and binding overhang are based on aggregated data. Re-calculating these estimates at the line item level may result in different answers.
12 INTEGRATED TARIFF ANALYSIS SYSTEM
HS6 commodity group.8 Results from analysis using either HS6 aggregated data or disaggregated line item data may differ (box 2.1).
Tariffs are not always expressed in ad valorem terms (that is, as a percentage of import value). Non-ad valorem tariffs typically include at least one component that relates the amount of duty to some physical aspect of the imported product, such as the number of units, volume or weight.9 Such non-ad valorem tariffs must be
standardised to allow these tariffs to be aggregated.
Box 2.1 The cost of aggregation — average tariff levels and dispersion
In ITAS, tariff analysis is conducted at the HS6 level rather than at the more disaggregated line item level. Conducting the analysis at different aggregation levels may result in different pictures of what a tariff schedule looks like. Detailed analysis of the cost of aggregation, that is, how the aggregation affects estimates of bound and applied rates, is contained in appendix C.
Analysis at the HS6 level may introduce a bias into measures of levels and dispersion in a tariff schedule. This bias increases with the extent of disaggregation and the amount of dispersion within an HS6 category. This bias is systematic and is separate from any bias introduced by other data problems (such as old data, missing values and non-ad valorem tariffs). Appendix C describes how this systematic bias can be corrected for without knowing the line item tariff levels.
For most countries, there is little or no difference between average tariffs calculated at the HS6 level or at the line item level. For the few countries for which the averages differ by more than 5 per cent, the average tariff calculated from HSx-level data tends to be higher than the corresponding average calculated from HS6-level data. In many cases the difference occurs mainly because some HS6 categories include line items that are not subject to tariffs.
For most countries in ITAS, less than 10 per cent of estimated HS6 tariffs are affected by this bias. In the case of South African bound tariffs, this proportion is 35 per cent. In HS6 categories that include dispersed HSx tariff levels, most of the HSx tariffs are within 20 per cent of the HS6 estimates.
Source: Productivity Commission.
8 In building rates for input into economic models, the initial HS6 rates are calculated as import-weighted averages of line item rates. Corresponding final applied rates are then calculated in the usual manner.
PREPARING TARIFF AND TRADE DATA FOR ANALYSIS
13
Converting raw data into standardised data
ITAS combines import and tariff data from the IDB and the CTS in a single consistent database of bilateral tariffs and trade flows that can be used to analyse both bound and applied rates. Standardisation ensures formulas are used in the same way for all countries. Since ITAS is designed to show how formulas work using realistic tariff data, the loss of some information as a result of standardisation does not detract from the usefulness of ITAS as a tool for examining formulas.
Table 2.1 Raw data and standardised data for conducting multi-country tariff analysis
Raw data Standardised data
Post-Uruguay bound tariffs by importing country and commodity (ad valorem and non-ad
valorem)a
Post-Uruguay bound rates by importing country, exporting partner and HS6 commodity (ad valorem rates only)
Applied tariffs (including preferential tariffs) (typically 1999) by importing country, exporting partner and commodity (ad valorem and non-ad valorem)a
Post-Uruguay (estimate) of applied rates (MFN or preferential) by importing country, exporting partner and HS6 commodity (ad valorem rates only)
Value of imports (typically 1999) by importing country, exporting partner and commoditya
Post-Uruguay (estimate) of value of imports for each HS6 commodity by importing country and exporting partner
aMember countries are required to provide tariff data for imported items according to the HS6 classification system. However, most countries provide such data at a more disaggregated level using 8, 9 or 10-digit codes to identify commodities. As a result, levels of detail for raw data vary between countries.
Source: Productivity Commission.
Table 2.1 compares the raw tariff data with the standardised data that are required to conduct detailed multi-country analysis of post-Uruguay tariffs.10 Table 2.2
identifies primary data issues and the solutions adopted in ITAS.
10 Post-Uruguay applied tariffs are estimated using available data (typically for 1999). Post-Uruguay import values are proxied using available data (typically 1999).
14 INTEGRATED TARIFF ANALYSIS SYSTEM
Table 2.2 Primary data issues, solutions and comments
Primary data issue Solution adopted Comments
Item subject to specific or mixed tariff
Ad valorem equivalent (AVE) rate used if available, otherwise deleted
Analysis limited to items subject to ad valorem tariffs or for which AVE tariff data are available
Bound ad valorem tariff but specific or mixed applied tariff
Applied rate estimated as the bound rate
Applied rate likely to be converted to ad valorem rate after Uruguay round
Missing bound tariffa Use maximum applied rate for the imported commodity across affected country’s trading partners
Missing applied tariffa Use bound rate for commodity if available. Otherwise delete commodity for affected trading partners
Trade and tariff data available for different levels of
commodity disaggregation (vary from HS6 to HS10)
Aggregate to HS6 Maximum level of
disaggregation available for analysis is HS6
No import value data Item deleted Limits analysis of prohibitive
tariffs Trade and tariff data not
available for the same year
Use IDB for a different year Trade values may not be consistent with tariff data (China, Indonesia and Malaysia affected)
No bilateral data available Data not processed on a partner basis
Occurs for Bangladesh. Bilateral import analysis not possible.
a All other indications are that there is a tariff but the tariff is missing.
Source: Productivity Commission.
Missing ad valorem tariff data
Where possible, missing bound tariffs for an item are replaced with the maximum applied rate across all trading partners for that item. If applied rates are not available, the item is excluded from the initial database and subsequent tariff analysis. Items with missing applied tariffs are likewise excluded.
PREPARING TARIFF AND TRADE DATA FOR ANALYSIS
15 Conversion to ad valorem tariff rates
Most tariffs are expressed in ad valorem terms (that is, import duty as a percentage of import value). However, tariffs on some items are recorded in non-ad valorem terms, such as dollars per unit (tables 2.3 and 2.4 show the incidence of non-ad valorem bound and applied (MFN) tariffs).11 For some of these items,
ad valorem equivalent (AVE) tariffs are also available in the IDB. When AVE tariff rates are available, ITAS includes these items.
Table 2.3 Ad valorem, non-ad valorem and AVE bound tariffs, by country
Industrial productsa
Country Number of items (original aggregation, HSx b Number of items subject to ad valorem tariffs Number of items subject to non-ad valorem tariffs Australia (HS6) 4289 4284 5 Bangladesh (HS6) 141 141 0 Brazil (HS8) 8404 8404 0 Canadac (HS8) 6880 6834 21 China (HS8) 6099 6099 0 EU (HS8) 8307 8263 44 India (HS6) 3104 2835 269 Indonesia (HS9) 5913 5913 0 Japan (HS6) 4425 4421 4 Korea (HS10) 8607 8586 21 Malaysia (HS9) 6025 6017 8 Mexico (HS8) 10224 10223 1 New Zealandc (HS8) 6286 6047 236 Philippines (HS8) 2858 2858 0 Singapore (HS9) 3288 3288 0 South Africa (HS8) 11570 11570 0 Taiwan (HS8) 7260 7174 86 Thailand (HS6) 3243 2509 734 US (HS8) 8447 8090 357
a Industrial products are listed in table A.3. b Number of items subject to binding commitments. c Numbers for Canada and New Zealand do not add up due to missing tariffs for some items in the CTS.
Source: Productivity Commission based on WTO (2001).
Non-ad valorem tariffs must be converted to equivalent ad valorem rates prior to analysis. Although in many cases the required information is available to convert specific tariffs to AVE tariffs, this process is expensive. Currently, ITAS does not include items for which no ad valorem (or AVE) tariffs are available or easily proxied — both the tariff and trade value are excluded from analysis. Excluding
16 INTEGRATED TARIFF ANALYSIS SYSTEM
these items will affect summaries based on the initial and final tariffs and will affect the trade-weighted averages that are calculated for input into economic modelling. Further analysis would be required to assess how the results would vary if these data were not excluded from the analysis modules.
Table 2.4 Ad valorem, non-ad valorem and AVE MFN tariffs, by country
Industrial productsa,b
Country Number of imported items (original aggregation, HSx) Number of items subject to ad valorem tariffs Number of items subject to non-ad valorem tariffs Number of items for which
AVE tariffs are available Australia (HS8) 5203 5195 8 0c Bangladesh (HS8) 5319 5311 8 0 Brazil (HS8) 8470 8470 0 0 Canada (HS8) 6820 6802 18 0 China (HS8) 6280 6280 0 0 EU (HS8) 8307 8263 44 40 India (HS6) 4444 4436 8 0 Indonesia (HS9) 6285 6285 0 0 Japan (HS9) 7292 6993 299 0 Korea (HS10) 9611 9590 21 0 Malaysia (HS9) 9237 8870 367 0 Mexico (HS8) 10260 10243 3 0 New Zealand (HS8) 6262 6033 229 0 Philippines (HS8) 4835 4835 0 0 Singapore (HS9) 5007 5007 0 0 South Africa (HS8) 6980 5161 1819 0 Taiwan (HS8) 7194 7080 114 0 Thailand (HS10) 5844 4895 949 0 US (HS8) 8444 7901 543 538
a Industrial products are listed in table A.3. b The number of imported items typically differs from the number of items subject to binding commitments reported in table 2.3. There are three main reasons for these differences: bound and applied rates are reported at different levels of aggregation, some imported items have unbound tariffs, or some items subject to binding commitments are not imported during the year for which applied tariff data are available. cIDB data for Australia in 1999 does not contain ad valorem equivalent tariffs. However, ad valorem equivalent applied tariffs are calculated in ITAS using ABS data.
Source: Productivity Commission based on WTO (1999) (provisional data for China).
Estimating post-Uruguay Round rates
ITAS is designed to analyse the effects of formulas in reducing post-Uruguay Round rates. As part of Uruguay Round trade agreements, each bound rate is reduced to an agreed level over time according to a staging process, which will typically be completed by 2005. That is, rather than reduce bound rates to a new level in one step, they are reduced in several steps over the implementation period
PREPARING TARIFF AND TRADE DATA FOR ANALYSIS
17 until the final post-Uruguay Round level is reached (box 2.2). These post-Uruguay bound rates come from the CTS and are used in ITAS because further negotiations are based on these rates.
An applied rate cannot exceed the corresponding bound rate that is in force at the time of measurement of the applied rate. However, it is possible for a current applied rate (typically measured in 1999 in ITAS) to exceed the post-Uruguay bound rate, which will apply in 2005.
Box 2.2 Timeframe for bound and applied tariff data (part 1)
Illustrative relationship between bound and applied rates Observed bound rate - commodity A, importer 1
Observed applied rate - commodity A, importer 1, exporter 2 Observed applied rate - commodity A, importer 1, exporter 3
Pre-Uruguay (1995)
Current tariff and trade data (1999) Post-Uruguay (initial tariffs) (2005) Estimated final tariffs (2010) Tariff rate
Estimated bound rate - commodity A, importer 1
Estimated applied rate - commodity A, importer 1, exporter 2 Estimated applied rate - commodity A, importer 1, exporter 3
The diagram illustrates the relationship between the types of tariff data available for analysis and the data that must be estimated.
18 INTEGRATED TARIFF ANALYSIS SYSTEM
Box 2.2 (continued)
Bound rates
Bound rates decline to known post-Uruguay levels according to a staging process that was agreed in the Uruguay Round. As a result, we know at what levels bound rates will be in 2005. Direct application of formulas to these post-Uruguay bound rates provides estimates of what the final level of bound rates are likely to be when agreements are reached and implemented as part of the Doha round. These final bound rates are only estimates, as the calculations are not conducted at the line item level.
Applied rates
Unlike with bound rates, there is no agreed target or staging process for applied rates. Thus future applied rates are estimated based on estimated bound rates. The only constraint on applied rates at any point in time is that they be lower than the bound rate in force at that time — in fact, applied rates may be set anywhere below this level. In ITAS, post-Uruguay applied rates are estimated conservatively — they are only reduced from current levels by the minimum required to ensure that they are below post-Uruguay bound rates. That is, if a current applied rate is lower than the post-Uruguay bound rate then it is assumed that there will be no change in the applied rate. If the current applied rate is higher than the post-Uruguay bound rate then the applied rate is reduced to the level of the post-Uruguay bound rate. In this case the post-Uruguay applied and bound rates are assumed to be equal.
The same process is then used to estimate final applied rates corresponding to final bound rates — formulas are not used directly on applied rates to derive final applied rates. Again, these final applied rates are only estimates and are based on calculations at the HS6 level.
Source: Productivity Commission.
Data on post-Uruguay applied rates are not available, and are estimated on the basis of current applied rates and commitments (bound rates) recorded in the CTS.12 If
the current applied rate is greater than the post-Uruguay bound rate, the estimate of the post-Uruguay applied rate is the post-Uruguay bound rate (box 2.3). Calculating post-Uruguay applied rates in this manner implies that they represent an upper estimate of what these rates are likely to be in 2005 (post-Uruguay).
12 In the current implementation, CTS and IDB data were downloaded from the WTO in July 2004 for Brazil and Mexico, and in August 2002 for the other countries.
PREPARING TARIFF AND TRADE DATA FOR ANALYSIS
19
Box 2.3 Timeframe for bound and applied tariff data (part 2)
Bound rates
These tariff rates are agreed at WTO negotiations. Negotiated reductions in bound rates are implemented according to a ‘staging process’. Some tariffs are not bound. Post-Uruguay bound rates are the maximum tariff levels committed to under the Uruguay Round agreements. They will be in force when Uruguay Round agreements have been fully implemented (that is, at the end of the staging process). Most commitments are binding by 1 July 2005 (for example, the Agreement on Textiles and Clothing).
The WTO Consolidated Tariff Schedule (CTS) lists commitments. If a rate is not bound, it is usually estimated in ITAS as the maximum corresponding applied rate across all trading partners (usually the MFN rate).
Applied rates
Conceptually, applied tariff rates represent the customs duty actually paid on imports. The applied tariff rate is calculated as the ratio of duty paid to the value of the item traded. This method of calculation accounts for preferential rates and concessions. For many economies, 1999 data are used in ITAS.
By definition, applied rates are equal to, or below, the corresponding bound rates. However, given the difference in timing between applied rates based on 1999 information (or prior) and post-Uruguay bound rates, the relationship may not always hold in the raw data.
The maximum applied rate is assumed to be the MFN rate. This is correct if at least one bilateral trade flow is subject to the MFN tariff. Other (lower) rates are possible on other bilateral flows, reflecting preferential agreements or tariff concessions (for example on imports of inputs into production). The resulting rate is a simple average of the rates applied to the corresponding bilateral trade flow.
Source: Productivity Commission.
Master database
As a result of the treatment described in this chapter, ITAS produces a consistent set of trade flows and bound and applied rates, at the HS6 level, bilaterally for 19 members of the WTO.13,14 This initial database provides a consistent basis to
13 Bilateral data in the current implementation of ITAS refers to 19 importers and more than 200 exporters but the system can be adapted to include any number of importing countries for which data are available in the CTS and IDB.
20 INTEGRATED TARIFF ANALYSIS SYSTEM
apply various approaches to reducing tariffs. Although the ITAS is currently set up to analyse tariffs on industrial products, it is also possible to use the same framework to analyse tariffs on agricultural products (but not domestic assistance or export subsidy commitments).
14 The master (initial) database includes over 80,000 initial bound rates (importing country x HS6 product) and over 1.2 million initial applied rates (importing country x HS6 product x exporting partner). It consists of 19 files and occupies 566 Mb of disk space.
TARIFF REDUCTION SCENARIOS
21
3
Tariff reduction scenarios
This chapter outlines the formulas included in ITAS and explains how the system measures the effects of each tariff reduction scenario.
Many formulas on which to base tariff reduction scenarios were proposed in late 2002 and early 2003.1 The ITAS provides a tool for evaluating the effects of formulas on HS6 tariffs and tariff summaries and duty-paid prices (assuming no change in quantities).
ITAS is a model that contains some simplifying assumptions that are necessary to produce a sensible database from disparate data and to manage the analysis. For example, the initial rates are estimates of post-Uruguay Round rates and are consistent with the detailed commitments made by members, as recorded in the CTS. In addition, ITAS does not assume any demand responses. Finally, calculations are not implemented at the line item level but at the HS6 level. Box 3.1 explains how applying formulas to aggregated data might affect results.
The ITAS is set up to run 10 scenarios, each based on a particular formula approach to tariff reduction.2 Under each scenario, final bound and applied tariffs are calculated for each commodity, importing country and exporting partner.3
1 Formulas used in the current implantation of ITAS are further explained in appendix B. Many other formulas were considered.
2 Although other tariff analysis systems such as WITS are also set up to examine the effects of several tariff reduction formulas, these systems currently only show the results of one scenario at a time. ITAS output files include the results for all scenarios to allow direct comparison.
3 The final tariff rate is the new tariff rate calculated from applying the formula to the initial tariff rate (for bound rates) or from applying the decision rule to the initial rate (for applied rates). The final bound rate represents the (estimated) end point in the scenario, as distinguished from any intermediate rates that apply during the staging process.
22 INTEGRATED TARIFF ANALYSIS SYSTEM
Box 3.1 The cost of aggregation — effects on final rates
In ITAS, tariff reductions are simulated using aggregated data at the HS6 level. However, in practice, tariff reductions are made at the line item level. Conducting the analysis at a different aggregation level may result in ITAS estimates being different from those produced when using more disaggregated rates. A detailed analysis of the cost of aggregation is contained in appendix C.
Applying formulas at the HS6 level (rather than applying formulas at the line item level and then aggregating to HS6) may result in some differences in estimates for some items and some countries. For the countries included in the current implementation of ITAS, average final tariffs estimated at the line item level and at the HS6 level differ by less than 5.2 per cent for bound rates and less than 3.2 per cent for applied rates. For New Zealand, when applying a Swiss8 formula, the final average bound rate estimated at the HS6 level is 3.0 per cent. The final bound rate calculated at the HSx level and then aggregated to HS6 is 2.9 per cent.
The average final applied rates estimated using the two approaches for Canada are 1.6 per cent when estimated with HS6 data and 1.5 per cent with the line item (HS8) data.
Source: Productivity Commission.
Tariff reduction scenarios in ITAS
Each tariff reduction scenario uses a rule (formula) to derive a final tariff rate from an initial rate. The effects of a specific approach to tariff reduction are then summarised by examining or by aggregating the effects on individual tariffs.
In most of the ITAS, tariff averages are not weighted by trade flows. This provides a better indication of barriers to market access than averages weighted by trade flows (box 3.2). However, these averages are not consistent with duty collection and cannot be used to estimate the effects of reducing tariffs on government revenues.
TARIFF REDUCTION SCENARIOS
23
Box 3.2 Weighted and unweighted averages
Simple average tariff rates are used as indicators of tariff barriers, or the extent of market access. The average rate is calculated as the simple (unweighted) average of the rates for traded commodities (including those with zero tariffs). The use of simple averages means that high tariffs are given the same weight as low tariffs.
Trade-weighted average tariff rates, where individual tariffs are weighted by their corresponding import values, may be less appropriate than the simple average rates to measure market access. High tariffs, which inhibit market access and reduce the volume of trade in the products that they are applied to, are typically under-represented in a trade-weighted measure. At the extreme, commodities with prohibitive tariffs (and therefore not traded) are excluded from the calculation.
Prohibitive tariffs are not included in the current implementation of ITAS and estimates of the average tariff may under-estimate the overall measure of the barrier to market access.
On the other hand, trade-weighted averages account for the relative importance of trade