This is the peer reviewed version of the following article: Eren Demir,
“Classification Trees, Logistic Regression, Generalized Additive
Models, and Multivariate Adaptive Regression Splines”
Decision
Sciences
, Vol 45(5): 849-880, October 2014, which has been
published in final form at doi: 10.1111/deci.12094.
This article may be used for non-commercial purposes in accordance
with
Wiley Terms and Conditions for Self-Archiving
.
1
A DECISION SUPPORT TOOL FOR PREDICTING PATIENTS AT RISK OF READMISSION: A COMPARISON OF CLASSIFICATION TREES, LOGISTIC REGRESSION, GENERALIZED ADDITIVE MODELS, AND MULTIVARIATE
ADAPTIVE REGRESSION SPLINES
Eren Demir
Department of Marketing & Enterprise, Business Analysis and Statistics Group, Business School, University of Hertfordshire, Hertfordshire, UK
Email: [email protected]
ABSTRACT
The number of emergency (or unplanned) readmissions in the United Kingdom National Health Service (NHS) has been rising for many years. This trend, which is possibly related to poor patient care, places financial pressures on hospitals and on national healthcare budgets. As a result, clinicians and key decision makers (e.g. managers and commissioners) are interested in predicting patients at high risk of readmission. Logistic regression is the most popular method of predicting patient-specific probabilities. However, these studies have produced conflicting results with poor prediction accuracies. We compared the predictive accuracy of logistic regression with that of regression trees for predicting emergency readmissions within forty five days after been discharged from hospital. We also examined the predictive ability of two other types of data-driven models: generalized additive models (GAMs) and multivariate adaptive regression splines (MARS). We used data on 963 patients readmitted to hospitals with chronic obstructive pulmonary disease and asthma. We used repeated split-sample validation: the data were divided into derivation and validation samples. Predictive models were estimated using the derivation sample and the predictive accuracy of the resultant model was assessed using a number of performance measures, such as area under the receiver operating characteristic (ROC) curve in the validation sample. This process was repeated 1000 times—the initial data set was divided into derivation and
2
time. The mean ROC curve area for the regression tree models in the 1000 derivation samples was 0.928, while the mean ROC curve area of a logistic regression model was 0.924. Our study shows that logistic regression model and regression trees had performance comparable to that of more flexible, data-driven models such as GAMs and MARS. Given that the models have produced excellent predictive accuracies, this could be a valuable decision support tool for clinicians (health care managers, policy makers, etc.) for informed decision making in the management of diseases, which ultimately contributes to improved measures for hospital performance management.
INTRODUCTION
Since the 1980s, the United Kingdom (U.K.) health service has undergone major changes in its organization and delivery. The rising cost of care, changes in technology, pressures associated with demographic change (e.g., aging population) and different patterns of health-seeking behaviour have forced the U.K. government to adapt new strategies that encompass whole health provisions, of which hospitals seek optimal output under strict economical constraints. Improving the management of high cost patients, especially those with long term conditions, is increasingly seen as an important strategy for improving health outcomes and controlling healthcare expenditure and is a key element of the current UK National Health Service (NHS) policy (Department of Health, 2010a).
From the perspective of healthcare costs, unplanned hospital readmissions have widely been viewed as one of the most serious problems in health services. In the 5-year period between 1 April 2004 and 31 March 2010, 7% of patients discharged from a hospital in England were readmitted to hospital within 30 days (Clarke, Blunt, & Bardsley, 2012), with costs to the
3
NHS estimated at £1.6 billion each year (Billings, et al., 2012). Given the rising cost of care, Department of Health guidance for the National Health Service (NHS) proposes that
commissioners should not pay provider hospitals for emergency readmission within 30 days of an index elective (planned) admission (Department of Health, 2011b). Furthermore, the rate of readmissions also plays an important part in monitoring health system performance, as one of the new English public health ‘outcome indicators (Department of Health, 2010b).
Many different interventions have been introduced with the aim of reducing unplanned
admission rates (Purdy, 2011), the evidence for their efficacy and cost-effectiveness is limited (Hansen, Young, Hinami, Leung, & Williams, 2011). One reason why interventions may be unsuccessful is if they are offered to patients who are at insufficiently high risk of
readmission (Steventon, Bardsley, & Billings, 2011). A history of recent hospital admissions is not an accurate predictor of future admissions by itself (Roland, Dusheiko, Gravelle, & Parker, 2005), and it seems that clinicians are often unable to make reliable predictions about which patients will be readmitted (Allaudeen, Schnipper, Orav, Wachter, & Vidyarthi, 2011).
Therefore, given the importance of emergency readmissions in the UK and other countries, in relation to long term savings, health system performances, patient satisfaction and safety, there is a genuine need to accurately identify emerging risk patients, so that healthcare organisations could take a more strategic approach to their care management interventions. For example, Clinical Commissioning Groups (CCGs) will be able to design and implement interventions and care pathways along the continuum of risk, ranging from, (i) prevention and wellness promotion for relatively low risk patients, (ii) supported self-care interventions for moderate risk patients, (iii) early intervention care management for patients with emerging risk, and (iv) intensive case management for very high risk patients.Therefore, accurately
4
predicting will allow CCGs for effective patient risk stratification, thus permitting
personalised care plan in the community for vulnerable patients most at risk. CCGsare groups of General Practitioners and from April 2013 they will be responsible for designing local health services in England.
There is an increasing body of literature attempting to describe and validate hospital readmission risk prediction tools (Kansagara, Englander, Salanitro, Kagen, Theobald, Freeman & Kripalani, 2011). These models have been categorised into three:
(i) models relying on retrospective administrative data (Bottle, Aylin, & Majeed , 2006; Krumholz, et al., 2008a; Krumholz, et al., 2008b; Krumholz, et al. 2008c; Hammill, et al., 2011; Howell, Coory, Martin, & Duckett, 2009; Holman, Preen, Baynham, Finn, & Semmens, 2005; Billings, et al., 2012; Bardhan, Kirksey , Oh , & Zheng, 2011).
(ii) models using real-time administrative data (Amarasingham, et al., 2010; Billings & Mijanovich, 2007; Billings, Dixon, Mijanovich, & Wennberg , 2006), and (iii) models incorporating primary data collection (e.g. survey or chart review data)
(Coleman, Min, Chomiak, & Kramer, 2004; van Walraven, et al., 2010; Hasan, et al., 2010).
Most of these models had poor predictive ability, where the area under the receiver operating characteristic (ROC) curve ranged from 0.55 to 0.72, except Coleman et al. (2004) used administrative data on comorbidity and prior use of medical services along with functional status data and reported ROC curve value of 0.83. Here, ROC is defined to be the proportion of times the model correctly discriminates a pair of readmitted and non-readmitted patients. The area under the curve of 0.50 indicates that the model performs no better than chance;
5
0.70 to 0.80 indicates modest or acceptable discriminative ability; and a value of greater than 0.80 indicates good discriminative ability.
Logistic regression is the most commonly used method for predicting the probability of an adverse outcome in the medical literature (including the readmission prediction models mentioned above). Recently, data-driven methods, such as classification and regression trees (CART) have been used to identify subjects at risk of adverse outcomes or of increased risk of having specific diagnoses (Nishida, et al., 2005; Kuchibhatla & Fillenbaum, 2003; Avila, Segal, Wong, Boushey, & Fahy, 2000; Schwarzer, Nagata, Mattern, Schmelzeisen, & Schumacher, 2003; Hasford, Ansari, & Lehmann, 1993; Stewart & Stamm, 1991; Sauerbrei, Madjar, & Prompeler, 1998; El-Solh, Sikka, & Ramadan, 2001; Tsien, Fraser, Long, & Kennedy, 1998; James, White, & Kraemer, 2005; Long, Griffith, Selker, & D’Agostino, 1993; Nelson, Bloch, Longstreth, & Shi, 1998; Lemon, Roy, Clark, Friedmann, & Rakowski, 2003). Decision rules generated by CART could easily be interpreted and applied in clinical practice. Furthermore, CART methods are versatile at identifying important interactions in the data and in identifying clinical subgroups of subjects at very high or very low risk of adverse outcomes (Lemon et al., 2003).
There are a number of studies that compared the performance of regression trees and logistic regression for predicting outcomes (Austin, 2007). Austin (2007) grouped these studies into three broad categories. First, studies that compared the significant predictors found by logistic regression with the variables identified by a regression tree analysis as predictors of the outcome. Second, studies that compared the sensitivity and specificity of logistic regression with that of regression trees. Third, studies that compared the predictive accuracy, as measured by the area under the ROC curve, of logistic regression with that of regression
6
trees. Among these studies, the conclusions were found to be inconsistent. Six studies concluded that regression trees and logistic regression had comparable performance; five studies concluded that logistic regression had superior performance to regression trees. The objective of this paper is to validate the variables derived from prior medical services consumptions such as outpatient and A&E attendances and inpatient admissions which have not been used extensively in prior models, and compare several different predictive models on readmission, and test if there is a consensus across different validation measurements of predictive performances. We compare the predictive ability of conventional logistic
regression and regression tree methods with that of two other-data driven methods known as generalized additive models (GAMs) and multivariate adaptive regression splines (MARS) models. Predictive models tend to assume that continuous independent variables (such as age and length of stay) have a linear effect on risk of readmission, which may not always be true. For instance, the risk of readmission for ages 50-64 may decrease and gradually increase for the 65+ population. In this context, assuming a linear effect may produce inaccurate and unstable results. GAM and MARS are versatile approaches and relax this assumption by fitting a non-linear smooth arbitrary function (e.g. lowess and smoothing splines) on continuous variables.
Note that the purpose of this paper is to predict patients who are known to the system, that is, it consists of all readmitted patients and does not predict patients who are not readmitted, simply because these are the cohort of patients that are costly, have an impact on key performance indicators including mortality, waiting lists, cancellation of planned care, etc. For this reason we have not included patients who are not known to the system.
7
Given that the existing literature on patient readmissions has produced poor prediction accuracies, there is a dire need for accurate and robust models with high predictive accuracies. This has serious practical implications, simply because incorrectly identifying patients at risk (or not at risk) of readmission can lead to poor use of resources (hence very costly) at a time when health services around the world including the NHS in England are struggling to provide care efficiently and effectively under severe financial constraints. Fulfilling these objectives could possibly enable us to develop reliable models for practitioners and managers for improving service delivery, achieve key targets (through reduction in emergency readmissions) and cost savings.
These objectives have never been investigated within the readmission phenomenon. The novelty of this paper will primarily be based on these objectives and the new insights offered from key findings.
We used a large sample of patients hospitalised with chronic obstructive pulmonary disease (COPD) and asthma in a primary care trust in England. COPD and asthma is known to be one of the leading causes of emergency readmission in the UK (Roland, Dusheiko, Gravelle, & Parker, 2005). For the first time ever, four well established methodologies are rigorously evaluated and compared using newly derived variables (that have never being tested before) for the purpose of predicting patients at risk of readmission. Given that the NHS faces an unprecedented resource challenge: net savings of £20 billion must be achieved over the coming 3-4 years, representing a productivity challenge of around 4% a year (Hamm, 2010); the NHS policy documents stress the importance of measuring outcomes (i.e. patient
readmissions) (Department of Health, 2011a), and the Government’s initiative towards expanding case management (i.e. managing patients in the community) (Department of
8
Health, 2005), this research will make a timely contribution.
The development of models that are capable of accurately predicting patients at risk of readmission will inevitably enable clinicians, practitioners and senior managers’ to improve clinical outcomes and increase effective budgeting. Even without monetary incentives, knowledge of readmission risk could still be useful to clinicians for focusing their discharge planning efforts and post discharge support on high-risk patients. This research will also support positive patient centred outcome for the local population through more timely and effective and cost effective interventions (reduction in waiting lists, mitigating financial risks, hence cost saving). Therefore, this could be a valuable decision support tool for clinicians (health care managers, policy makers, etc.) for informed decision making in the management of diseases, which ultimately contributes to improved measures for hospital performance management.
METHODS
Data Sources
The data provided by a primary care trust (PCT) in England comprised three key sources of data: inpatient care, outpatient care, and accident & emergency (A&E). The inpatient care dataset provides a wide variety of information on admissions to NHS hospitals including patient details, when and where they were treated, care period, diagnosis, discharge, and geographical data. The Outpatient dataset contains information on outpatient appointments to NHS hospitals (day cases). It includes appointment dates, attendance types and
non-attendances, waiting times, clinical and geographical data, patient details, socio economic factors, referral source and outcome results. The A&E dataset provides information on patient accident and emergencies to NHS hospitals including reason for and location of accident,
9
hospital arrival, diagnosis, disposal, type of department attended, waiting times, and referral source. A full list of variables can be obtained from the hospital episodes statistics website (Hospital Episode Statistics, 2012).
The data was provided in Microsoft Access and Excel format and necessary steps were taken to import the data into MySQL version 5.0, so that database programming could be carried out to prepare the data for analysis. Initial checks were made to ensure that the data sets provided contained encrypted NHS numbers for matching purposes. The data period is from 01/04/08 to 31/12/10 (approximately 2.75 years). The total number of observations in the A&E dataset is 275,366 records, 122,446 inpatient care admissions, and 1,022,113 outpatient attendances. The first two years is used to develop the predictive models (derivation sample) and the third year (validation sample) to evaluate the observed vs. predicted results.
The inpatient data captures all the consultant episodes of patients during their stay in hospital. During a hospital stay a patient might encounter several successive episodes (i.e. consultant treatments), collectively known as a spell. So, 122,446 episodes are made up 96,448 spells or in other words, visits. Out of 96,448 visits 19,750 readmissions were observed (see Table 1 for details).
The inpatient data is the focus dataset where all readmissions are captured. We use the outpatient and the A&E datasets (in addition to the inpatient data) to observe if there is a prior use of medical services which are then used as explanatory variables. Out of over 100 key articles based on emergency readmissions (Demir E. , 2008) we found that prior use of medical services were highly associated with emergency readmission. No research has considered the footsteps of patients in other services, i.e., outpatient and A&E. For example,
10
if a patient had two or more A&E admissions in the last 90 days prior to next readmission, this may have an impact on next readmission. Similarly, a sick patient would normally visit his/her consultant in outpatient services on a regular basis. So, if a patient had 6-10 out-patient visits in the last 730 days (prior to next readmission) this may also have an impact on next readmission. What about if they had an X-ray taken or arrived by an ambulance in the last 90 days. We derived just over 60 explanatory variables from the inpatient, outpatient and A&E datasets (variables listed in Table 2). Therefore, the outpatient and the A&E datasets were used to extract information about individual patient’s footsteps in other services.
To model a representative subset of patients, we select patients according to either primary diagnosis or main specialty. We focus on patients with COPD and asthma as these are known to be the leading causes of early readmission in the UK (Roland et al., 2005). Readmission time is the time (in days) from the date of discharge to next emergency admission. In the literature, the definition of readmission varies according to the purpose of the study, generally from 30 to 90 days (Kemper, Kennedy, Dechert, & Saint, 2005; Moloney, Bennett, & Silke, 2004), but some studies have used readmissions following certain surgeries, for shorter (14 days) (Reed, Pearlman, & Buchner, 1991) or longer time window (1 year) (Datar & Sood, 2011). The chosen time windows are generally subjective. Instead of relying on a subjective definition based on an arbitrarily chosen time window (e.g. 30 days), we objectively defined the time window for COPD and asthma as 45 days (Demir & Chaussalet, 2011). We capture the readmission process from the community using a special case of a Coxian phase-type distribution, expressed as a mixture of two generalized Erlang distributions. Using the Bayes theorem, we compute the optimal time windows in defining readmission. Therefore,
readmission is defined to be all emergency admissions within 45 days after discharge from hospital for the same primary diagnosis (i.e. patient level analysis). Readmissions within 45
11
days were restricted according to the provisions of the 2011–2012 NHS operating framework by excluding non-emergency admissions and admissions where a national tariff was not applicable. Patients readmitted within 45 days after discharge (respectively, greater than 45 days) are classified as high risk group of readmission (respectively, low risk group), hence a binary response variable.
Patients who had the primary diagnosis codes corresponding to COPD (ICD-10 codes J40– J44) and asthma (ICD-10 code J45) were extracted. The 122,446 inpatient episodes account for 96,448 spells (or visits) with 19,750 patient readmissions (all clinical conditions), so almost 20% of visits to inpatient care were readmissions. COPD and asthma readmissions accounted for 1110 readmissions (approximately 5.6% of all readmissions). After data cleansing process (e.g. removing missing values and outliers) the total number of readmitted COPD and asthma patients during the 2.75 year period reduced to 963 (413 and 550 in the high risk and low risk group of readmission, respectively). Furthermore, the first two years of the data was used as the derivation sample (725) and the remaining for validation purposes (238). From the derivation sample there were 323 and 402 high risk and low risk group of readmission, respectively, whereas 90 and 148 respectively for the validation sample (see Table 1 for a breakdown of the datasets and readmissions).
--- Insert Table 1 here ---
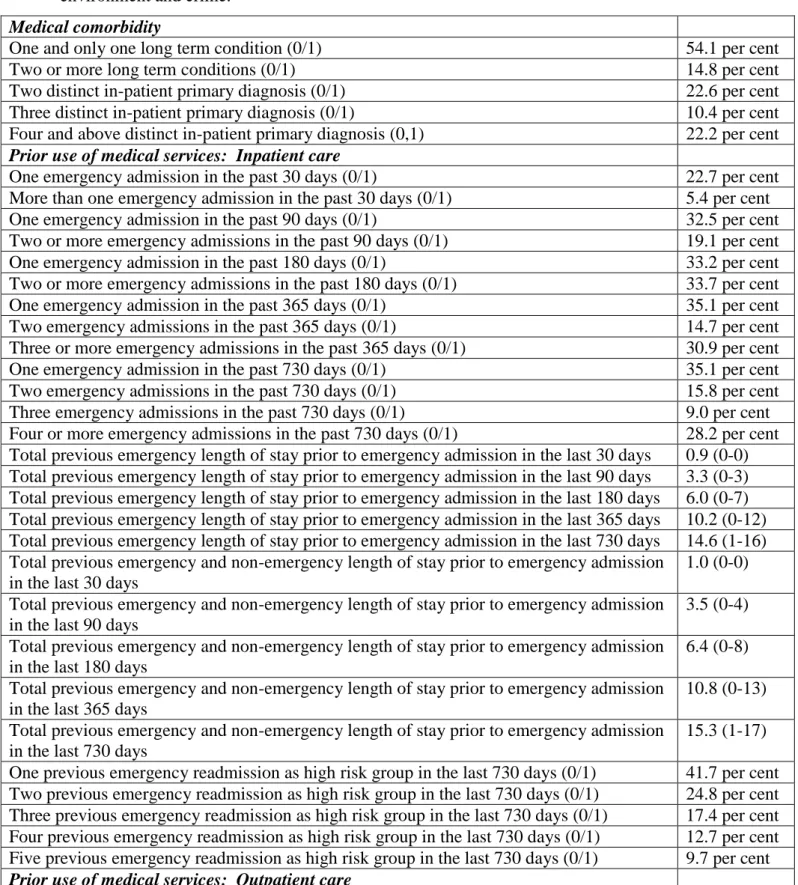
All variables listed in Table 2 were derived through database programming. The variables are categorised into three areas: medical comorbidity, prior use of medical services, patient characteristics, socio demographic and social determinants. Around 14.8% of patients were diagnosed with two or more long term conditions (LTCs) (Table 2). A LTC is defined to be COPD, asthma, coronary artery disease, congestive heart failure, hypertension and cancer.
12
Note that all explanatory variables were derived based on the admission date prior to
readmission, for example, if a patient is readmitted on 01/06/2009, then the derived variables for this particular patient is based on the data prior to 01/06/2009. Approximately 22.7% of patients had one emergency readmission in the past 30 days, whereas 30.9% had three or more emergency admissions in the past 365 days. The average total previous length of stay prior to emergency admission in the last 30 days is around six days (25th and 75th percentile is 0 and 7 days, respectively). Interestingly, almost a fifth of patients had 6-10 outpatient
attendances in the past two years. Furthermore, fifty five per cent had three or more A&E visits in the past one year. ---
Insert Table 2 here ---
Initial Model for Predicting Patients at Risk of Readmission
A parsimonious model for predicting patients at risk of readmission was implemented based on the univariate logistic regression method using repeated bootstrap resampling approach. This model was developed by drawing repeated bootstrap samples from the sample of COPD and asthma patients. Those variables that were identified as significant predictors of risk of readmission in at least 75 per cent of the bootstrap samples were retained for inclusion in the final predictive model. The resultant model comprised thirty eight variables (listed in Table 3), that is, 38 were found to be significant in at least 75 per cent of the bootstrap samples out of the 79 variables listed in Table 2. This model will be used as the basis for some of the regression models that we will consider in this study.
--- Insert Table 3 here ---
13 Predictive Models for Risk of Readmission
In this section, we describe the four different classes of predictive models that were used to predict patients at risk of readmission. All model fitting and model validation was done using the R statistical programming language (R Core Development Team, 2005).
Logistic regression
Three separate logistic regression models were developed to predict patients at risk of readmission. The first model consisted of the thirty eight variables described in section 2.2, known as the reduced model. The second model was constructed using backwards variable elimination. This consisted of all the 38 variables along with all two-way interactions, with the thirty eight main effects being forced to remain in each model. The third model was also constructed using backwards variable elimination. However, in this instance, the initial model consisted of the 79 variables listed in Table 2. The logistic regression models were fitted using the glm function in R.
Backwards variable elimination was done using the step function in R. This implementation of backwards variable elimination is based upon sequentially eliminating variables from an initial model. At each step the variable is removed from the current model that results in the greatest reduction in the Akaike Information Criterion (AIC). The process of eliminating variables terminates either when a pre-specified boundary model is achieved or when no step will cause a further reduction in the AIC criterion (Hastie & Pregibon, 1993).
Classification trees
Binary recursive partitioning methods are rarely used to construct regression trees to predict patients at risk of readmission. Classification tree based models are conceptually simple yet
14
powerful (Hastie, Tibshirani, & Friedman, 2009) and is known to be a data intensive
approach and generally works very well with large datasets (large in terms of the number of observations and the number of independent variables). The R implementation of regression tree only allows for binary partitions (or splits). In addition, the R implementation only allows for splits on individual variables and does not allow for splits on linear combinations of predictor variables. At each node, classification tree partitions the input variables into a set of homogeneous regions. The splits should divide the observations within a node so that the class types within a split are mostly of one kind (i.e. readmitted or not readmitted).
One advantage of this approach is that it does not require the parametric specification of the nature of the relationship between predictor variables and the outcome. In addition, the assumptions of linearity that are frequently made in linear and generalized linear models are not required for tree-based regression methods. Furthermore, tree-based methods are adept at identifying important interactions between predictor variables.
An initial tree was grown using all 79 candidate predictor variables listed in Table 2. Once the initial regression tree had been grown, the tree was pruned. A cross validation was used on the derivation data set to determine the optimal number of leaves on the tree (Faraway, 2006). Predictions were obtained on the validation data set using the pruned tree. The regression tree models were fit using the rpart function in the rpart package for R.
Generalized additive models
A generalized additive model (GAM) is an additive regression model of the form
15
where the fj are smooth arbitrary functions (e.g. lowess and smoothing splines) (Hastie & Tibshirani, 1990). Additive models are more flexible than the linear model, but still
interpretable since the functions fj can be plotted to give a sense of the marginal relationship between the predictors and the response. Categorical variables can be easily accommodated within the model using the usual regression approach. For example,
y = β0+ ∑pj=1fj(Xj) + 𝑍𝛾+ ϵ (2)
where 𝑍 is the design matrix for the variables that will not be modelled additively, where some may be quantitative and others qualitative. The 𝛾 are the associated regression parameters.
In the current study, we considered three separate GAMs for predicting patients at risk of readmission. First, we considered the reduced model described above (variables listed in Table 3). Total length of stay variables and age at admission were modelled using smoothing splines. A second model was fitted that consisted of the above GAM, along with all two-way interactions. The third model contained all 79 variables, while the 12 continuous variables were modelled using smoothing splines. The GAMs were fitted using the gam function in the MGCV package in R.
Multivariate adaptive regression spline models
Multivariate adaptive regression splines (MARS) is an adaptive regression procedure well suited to problems with a large number of predictor variables (Friedman, 1991; Hastie, Tibshirani, & Friedman, 2001). The basic principle of MARS is that it divides the data into
16
several regions, and fits a regression model to each region. MARS uses an expansion based on linear spline functions. For a given predictor 𝑋j and a given value c taken by the predictor variable, one can define two linear spline functions: (𝑋𝑗− 𝑐)+ and (𝑐 − 𝑋𝑗)+ , where ‘+’ refers to the positive part. For example, suppose 𝑋j is ‘age at admission’ and the best split is at age 55 (i.e. c = 55), then (𝑋𝑗− 55)+ and (55 − 𝑋𝑗)+ refers to the region greater and lower than 55, respectively.
We examined three separate MARS models. Each used the 79 variables described in Table 2. The first model was an additive model that did not allow interactions between the predictor variables. The second model allowed for the inclusion of two-way interactions, while the third model allowed for the inclusion of all possible interactions, including 79-way
interactions. MARS models are constructed using generalized cross-validation to determine the optimal number of terms in the model (Hastie, Tibshirani, & Friedman, 2001). This use of generalized cross-validation helps protect against over-fitting the model in the derivation sample. Thus, while the third MARS model allowed for the potential inclusion of all possible interactions, the use of generalized cross-validation minimizes the likelihood that the final model will be over-fit to the derivation sample. The MARS models were fit using the earth
function in the EARTH package.
Evaluating the predictive powers of models
Motivated by Austin (2007), repeated split-sample validation was used to compare the predictive accuracy of each statistical method. The data were divided into derivation and validation components. The first two years of data were used for model derivation and the remaining nine months of data was used for model validation. Each derivation sample
17
consisted of 725 patients, while each validation sample consisted of 238 patients. This
process was repeated 1000 times. Chi-square tests and t-tests were carried out on a number of focal variables (medical comorbidity, prior use of medical services, and other characteristics) to examine whether the samples (derivation and validation) are equal. A total of twenty variables were selected of which two thirds were found to be equal (i.e. p-value > 0.05). Each model was fitted on the derivation sample. Predictions were then obtained for each patient in the validation sample using the model derived on the derivation sample. The predictive accuracy of each model was summarized by the area under the ROC curve, which is equivalent to the c-statistic (Harrell Jr, 2001). In medical literature, ROC is the most widely used statistic to assess the predictive power of models related to predicting adverse events. The area under the ROC curve was obtained for both the derivation and validation samples.
In addition to ROC, Austin (2007) used a number of other measures (suggested by Harrell Jr (2001)), such as the generalized 𝑅𝑁2 index (Nagelkerke, 1991) and Brier’s score (Harrell Jr, 2001). Brier’s score is defined as
𝐵 =1𝑛∑𝑛𝑖=1(𝑃̂𝑖 − 𝑌𝑖)2 (7)
where 𝑃̂𝑖 is the predicted probability and 𝑌𝑖 is the observed response for the i th patient. We computed the generalized 𝑅𝑁2 index and Brier’s score in each of the validation samples. The area under the ROC curve, the generalized 𝑅𝑁2 index, and Brier’s score were computed using the val.prob function from the RMS package for R. We also report the sensitivity score and specificity score for the validation samples. Sensitivity score is the proportion of correctly classified readmitted patients, whereas specificity score is the proportion of correctly classified non-readmitted cases. These two measures are well known by clinical and managerial staff in the National Health Service.
18
The above methods were repeated 1000 times: the initial data were divided into derivation and validation components 1000 times. Each predictive model was fitted using the derivation data set and predictions were then obtained on the validation data set. Results were then summarized over the 1000 validation data sets. By using 1000 different derivation/validation samples, we were able to assess the robustness of our results under different derivation and validation samples. This process was carried out using the boot function from the BOOT package for R.
It is highly recommended that predictive models should be evaluated using more than one performance metrics (ROC, sensitivity, specificity, Briers Score and generalized 𝑅𝑁2 index) and see if there is an agreement between these measures. In addition, each of these measures have a unique interpretation, for instance, generalized 𝑅𝑁2 index is very similar to the
coefficient of determination (or adjusted R2) in multiple linear regression, i.e., the proportion of variability explained by the covariates, hence the generalized 𝑅𝑁2 index has a direct
statistical relevance. High ROC statistic, sensitivity and specificity may have a direct
relevance in predictive analytics (that is the proportion of cases correctly identified) however it does not mean that the proportion of variability explained is also high, hence additional performance measures complements the traditional ones (ROC c statistics, sensitivity, specificity).
19 RESULTS
Predictive Performance
The mean area under the ROC curve for each model in both derivation and validation samples are reported in Table 4.
--- Insert Table 4 here ---
In the validation sample, the mean ROC curve area for the regression tree model was 0.924, while the mean ROC curve area for the stepwise logistic regression model was 0.928. The difference in ROC curve areas for the regression tree method and the stepwise logistic regression model ranged from a low of zero to a high of 0.137 across the 1000 validation samples (mean difference: 0.026). The ROC curve areas for the other modelling methods in the validation samples ranged from a low of 0.824 (MARS model with all interactions) to a high of 0.924 (GAM and MARS with all variables, i.e., full model). As both models included all variables (i.e. 79) this may mean that the full models were over fitted on the derivation samples.
The mean ROC curve area for the regression tree decreased from 0.948 in the derivation samples to 0.924 in the validation samples – a very small decrease of 0.024. The decline in the mean ROC curve area between the derivation and validation samples was negligible for the logistic regression with the backwards elimination from the full model (0.049). Similarly, the drop in ROC curve area from the derivation sample to the validation sample was identical and small for the GAM (full model: 0.978 to 0.924) and the MARS full model. The highest difference in ROC curve areas between the derivation and validation samples was observed to be in the MARS model with all interactions (0.171), followed by MARS with two-way
20
interactions (0.131) and the logistic regression with two-way interactions (0.122). The greater decline in ROC curve area for the MARS models compared to the simpler logistic regression and regression tree may be indicative of a tendency of the more complex MARS models to over-fit on the derivation samples. For most models, the decrease in ROC curve area from the derivation sample to the validation sample was relatively modest.
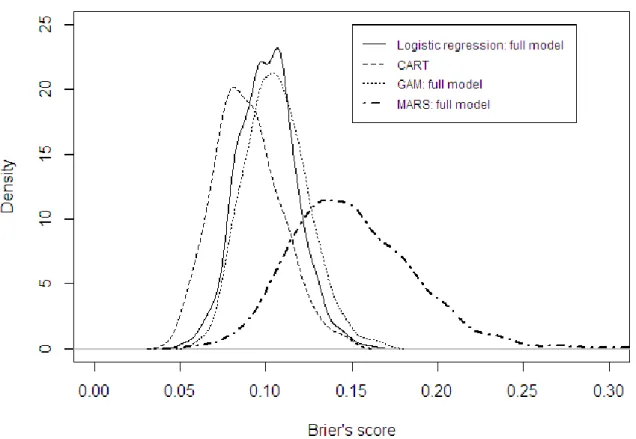
The distribution of the area under the ROC curve, the generalized 𝑅𝑁2 index, Brier’s score, sensitivity and specificity score in the 1000 validation data sets for promising models are described in Figures 1-3. Judging by the performance criteria’s from Table 4 the promising models are logistic regression (backwards elimination from full model), regression tree, GAM (full model) and MARS (full model). The distribution of ROC curve areas for the MARS model with way interactions and all interactions, logistic regression with two-way interactions, and GAM with two-two-way interactions shifted downwards (and to the left) compared to that of the promising models (i.e. greater variability in ROC curve areas). This clearly demonstrates that models with two way interactions (or higher) had consistently poor performance than the other models. We notice that the distributions of the area under the ROC curve for promising models are very similar (Figure 1).
--- Insert Figure 1 here ---
The generalized 𝑅𝑁2 index is reported in Table 4 for each of the modelling strategies. The index ranged from a low of 0.701 for MARS with all interactions (and logistic regression with two-way interactions) to a high of 0.859 for the logistic regression model obtained from the full model using backwards elimination, that is, this model explained substantial
proportion of the observed variation. The Brier’s score is also reported in Table 4 for each of the modelling strategies. Of note is the fact that there isn’t too much variability in the
21
estimated Brier’s score for all the modelling strategies except logistic regression and GAM with two-way interactions and MARS with all interactions. The distribution of the
generalized 𝑅𝑁2 index and Brier’s scores in the 1000 validation data sets for the promising models are described in Figures 2 and 3, respectively.
--- Insert Figure 2 here --- ---
Insert Figure 3 here ---
The distribution of the generalized 𝑅𝑁2 index (Figure 2) in the validation samples shows that logistic regression (full model) and GAM (full model) has lower variability (and shifted to the right), which means that these two models have explained higher variability of the observed variation compared to the other two promising models (regression tree and MARS full model). In the case of the distribution of Brier’s score (Figure 3) regression tree exhibited the least variability with the most effective predictive ability, whereas MARS (full model) shifted the most to the right (i.e. the least effective model) with high variability. The remaining two promising models can be considered to be comparable (0.137 to 0.151). Sensitivity and specificity scores are also reported in Table 4. The highest mean sensitivity and specificity scores over the 1000 validation samples is from the regression tree model (0.862 and 0.904, respectively) and logistic regression based on backwards elimination from the full model (0.821 and 0.897, respectively).
Miscellaneous results
The best modelling strategy is selected from each method and key findings are presented here. Judging from the predictive performance measures from Table 4, the stepwise logistic
22
regression, GAM (full model) and MARS (full model) are selected. The results from the analysis have four important cases of interest for key decision makers (clinicians, managers). The number of correctly identified readmitted cases; the number of cases observed to be readmitted but predicted to be readmitted; the number of correctly identified
not-readmitted cases, and the number of cases observed to be not-not-readmitted but predicted to be readmitted. Table 5 shows these figures for each of the selected models, where the figures are based on the validation sample (238 cases in total of which 90 were readmitted and 148 were non-readmitted). Regarding the purpose of this research (i.e., reducing readmissions through tailored cares for patients at a high risk), correct predictions for readmission, and predicted non-readmitted but observed to be readmitted are important.
Considering effective budgeting, a predicted readmission, but no readmission is a critical factor, because it makes a hospital pay additional costs, which are not actually necessary. Note that the predictions in Table 5 are very similar where they slightly differ in relation to other performance measures (see Table 4).
--- Insert Table 5 here ---
--- Insert Figure 4 here ---
The regression tree obtained using one of the derivation samples is illustrated in Figure 4 which has seven terminal nodes. Six variables were used in creating the tree which are all related to prior use of medical services (e.g. length of stay, previous history of readmissions). If a patient had experienced one previous emergency readmission (as a high risk group patient) in the last 30 days then there is a 100% chance that this patient will be readmitted again within the next 45 days. Here, previous readmission is a prior use of medical services
23
(the explanatory variable), whereas next readmission is part of the response variable. Note that the 30 days is not inclusive in the 45 day time window. This can be considered to be clinically relevant, as patient’s short previous history is related to risk of adverse outcomes (e.g. readmission, mortality). Similarly, there is a 90% chance of a patient being readmitted if their previous length of stay in hospital (emergency and non-emergency) was greater than half a day and had two or more emergency admissions in the past 90 days (N = 80).
From the logistic regression obtained from backwards elimination, twenty three variables (out of a total of 79) were included in the final model, of which nineteen had a p-value less than 0.05. Patients who had four or more distinct in-patient primary diagnosis (i.e. clinical conditions) were eight times more likely to have been readmitted. Interestingly, those who had two or more emergency readmissions in the last 90 days were 65 times more likely to be readmitted.
Figure 5 describes the relationship between log odds of readmission and “total emergency and non-emergency length of stay in the past 90 days” and “total emergency length of stay in the past 90 days” from the GAMs full model. Note that these two variables are not the same, where the latter takes into account length of stays based on emergency admissions only, whereas the former includes non-emergency admissions as well (e.g. planned surgeries). For each value of a given variable, we determined the predicted log-odds of readmission, holding the other continuous variables fixed at the sample average and the binary predictor variables set to absent.
--- Insert Figure 5 here ---
24
non-linear up-to 30 days of length of stay and approximately linear thereafter. The risk of readmission increases with an increasing total emergency length of stay in the past 90 days prior to next readmission. Conversely, the cumulative LoS of patients who were previously admitted as an emergency and non-emergency admission reduces the risk of being
readmitted. One explanation for this phenomenon is that these patients are cared by clinicians and nurses on a regular basis (as an emergency and elective admissions via appointments) and when a patient is cared and treated for a prolonged period of time, our findings may suggest that increasing length of stay in hospital lowers future risk of readmission.
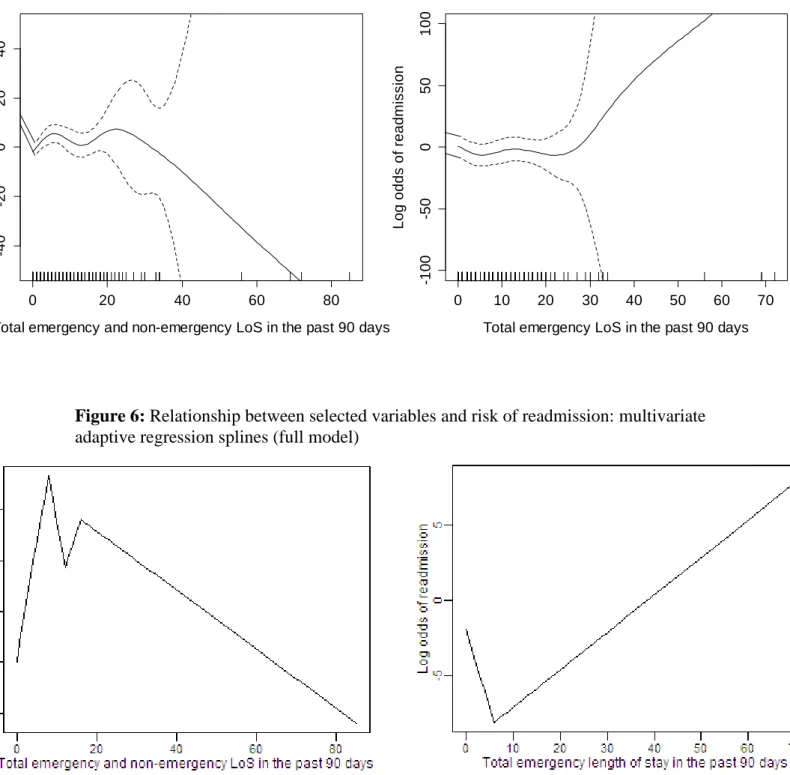
Figure 6 describes the relationship between the log-odds of readmission and the two LoS variables used above from MARS full model. One observes that up-to a total of 10 LoS days (emergency and non-emergency LoS) log odds of readmission increase rapidly, where this risk gradually decreases after a LoS greater than 20 days. In relation to emergency LoS only, the log-odds of readmission are low for patients who stayed in hospital for less than six days (in the last 90 days prior to next readmission) and gradually increases thereafter.
Rapid patient discharge to free beds for incoming patients is a controversial debate in the UK. Some argue that patients may have been discharged too soon, raising the issue that patients are being discharged ‘sicker and quicker’ (Capewell, 1996). As a result, early discharges may generate high levels of readmissions, which could possibly be seen as patients being
discharged inappropriately. Although there is no evidence to indicate that higher LoS reduces patient readmissions (or vice versa), Figures 5 and 6 gives us some insights to the issues surrounding LoS, that is, when a patient is cared and treated for longer periods of time (as an emergency and non-emergency LoS) the risk of future readmission may decrease. This finding should not be considered to be conclusive and needs to be further investigated.
25
--- Insert Figure 6 here ---
DISCUSSION
In the National Health Service, changes to commissioning arrangements have increased the focus and drive to reduce hospital admissions. Approximately 35% of hospital admissions in England are emergency admissions costing £11 billion per annum (2010/11), which represent 36.7% of hospital admissions in England (5.3 million admissions in 2010/11). Given that the tough economic conditions are expected to be with us for quite a while in the future, the UK Government’s target is to provide personalised care plan for vulnerable people most at risk. Managing emergency readmissions will inevitably reduce the burden on non-emergency health care and resource use, which may lead to substantial amount of cost savings, reduction on waiting lists, and more importantly positive patient centred outcomes for patients and carers. Therefore, an appropriate toolkit is needed to aid clinical commission groups in their intervention policies to provide treatment in the community to those patients who are at high risk of readmission. There has been an increasing interest in developing statistical models to identify patients at increased risk of readmission within a short period of time after discharge (e.g. 45 days). Many models have been developed in the UK and other countries where these studies produced conflicting findings, resulting in poor predictions.
In the current study, we have demonstrated, using a large sample of patients with chronic obstructive pulmonary disease and asthma that conventional logistic regression and
regression trees produced comparable results to that of modern flexible regression methods such as GAMs and MARS models. The mean ROC curve area for conventional logistic regression with no interactions and regression trees was 0.928 and 0.924, respectively in the
26
validation sample, while the corresponding value for GAMs and MARS was 0.854 and 0.721, respectively. The highest observed ROC curve area was for the logistic regression model obtained from the full model using backwards elimination. In addition to comparing the predictive accuracy of regression methods from different families of methods, we also compared the predictive accuracy of models with differing complexity from the same family of models. We found that more complex models from the same family had lower predictive accuracy (GAMs and MARS). Similar results were observed when the generalized 𝑅𝑁2 index, Brier’s score, sensitivity score and specificity score were used to quantify the predictive accuracy of different regression models.
It is rather difficult to provide a guideline as to which performance measure to rely on when choosing a predictive methodology. We expect the optimal model to have an agreement between the performance measures, for instance, if the model performance has an ROC c-statistic greater than 0.85 (similar scores for sensitivity, specificity and generalized R2 index) and a Brier’s score less than 0.15, then this model would be considered to be a reliable, robust and an effective model (Austin, 2007; Harrell Jr, 2001). However, in the case that all model performance measures are similar then the simplest method should be selected for practical purposes, e.g. logistic regression or the classification tree.
GAMs and MARS provided very useful insights. First, analyses conducted using GAMs indicated that the relationship between log-odds of readmission (within 45 days after discharge) and “total emergency length of stays in the past 90 days” was non-linear up-to a LoS of 30 days and approximately linear thereafter. One can observe that the risk of
readmission increases after patients having spent above 30 days as an emergency admission. Clinicians, nurses and key decision makers for COPD and asthma patients could pay
27
particular attention to those patients who have been in emergency care for a total of 30 or more days. Note that thirty or more days refer to the cumulative length of stays in the past 90 days as emergency admissions only. This finding was also confirmed by the MARS full model (additive model).
The conventional logistic regression model was able to exploit the strong underlying linear relationships in the data. For example, commissioning managers (and the clinical team) would need to be extra cautious on patients who had two or more emergency admissions in the past 90 days prior to next readmission, simply due to the fact that this group of patients are 65 times more likely to be readmitted. The regression tree model partitioned the sample using binary decision rules and one useful partition was that if a patient had one previous emergency readmission in the last 30 days, then there is a 100% chance of being readmitted again. A closer look at this particular node revealed that out of the 166 patients that were assigned to this node, approximately 88% of patients were correctly identified in the validation sample.
A limitation of this study is that we have only considered those patients who are known to the system, that is, it consists of all readmitted patients and does not predict patients who are not readmitted. This may therefore restrict the generalization of the results since it is limited to patients with already highly significant medical resource consumptions. Future work will be directed towards the inclusion of the non-readmitted cohort of patients.
We offer the following three suggestions to researchers and practitioners assessing the predictive accuracy of regression models to predict patients at risk of readmission. First, the data should be split into a derivation sample and validation sample, so that the predictive
28
accuracy of regression models can be assessed using a summary measure such as the area under the ROC curve. Second, do not just rely on sensitivity and specificity scores (the proportion of correctly identified readmitted and non-readmitted cases, respectively), as this approach has been criticised for a variety of reasons (Harrell Jr, 2001). Third, repeated split-sample validation should be employed to assess the variability in the performance measures across the 1000 validation samples. To the best of our knowledge, no study has ever
compared CART and logistic regression with other data driven methods (GAMs and MARS) using repeated split sample validation approach to examine the robustness of the findings to predict patients at risk of readmission within forty five days after discharge.
From the review of the literature, some of the risk factors examined were dependence, age, severity of illness, length of stay, number of previous hospital admissions, mobility status and care after discharge (Demir E. , 2008). Although there were many variables considered, no single factor could be used as a predictor of risk of readmission, except the number of prior hospital admissions was found to be a significant predictor (23 out of the 25 reviewed
articles). Motivated by this finding, we tracked individual patient’s footsteps in other services (outpatient, A&E and inpatient) and derived many new variables (listed in Table 2) based on prior use of medical services. Judging by the results we found that these variables were the only predictors of risk of readmission and that none of the patient characteristic variables are listed as significant predictors. Furthermore, we found similar set of variables as predictors of readmission for other long term care conditions, such as cancer, congestive heart failure, stroke, coronary artery disease and hypertension, and thus our results are conclusive and in line with the literature, except with new variables offered for researchers and practitioners to utilise for risk prediction purposes. The inclusion of the new variables increased the
performance dramatically. For instance, we tested the existing predictive tool (developed by the King’s Fund and Nuffield Trust (Billings, Dixon, Mijanovich, & Wennberg , 2006)) with
29
the same set of variables excluding the new ones and produced a ROC statistics of 0.65, whereas based on our model (including all new variables) the ROC statistics was greater than 0.9, hence a massive difference. Furthermore, the results were very promising for other disease categories as well including cancer, congestive heart failure, stroke, coronary artery disease and hypertension).
In conclusion, we demonstrated that logistic regression had superior predictive ability compared to modern data-driven methods. Furthermore, regression trees had comparable predictive ability to the conventional logistic regression. A message to key decision makers in the NHS (and other countries) is that to the best of our knowledge this particular research has produced the highest predictive accuracies that have ever been published to predict the risk of readmission (within 45 days after discharge) for patients that are already known to the
system. Therefore, the methods outlined in this study will enable practitioners and managers in the NHS to develop a robust decision support toolkit to provide treatment in the
community to patients at high risk of readmission. This can be a valuable tool in helping to tailor community care to local needs and ultimately contribute to improved measures in reducing readmissions.
CONCLUSION
One of the most difficult and challenging aspects of predictive modelling is been able to identify the key sets of variables that are likely to have an impact on the prediction of
readmissions and in most cases relevant data may not be available. A number of authors have investigated the impact of using administrative data (i.e. routinely collected) versus clinical data in profiling coronary artery by-pass grafting mortalities in New York hospitals, and
30
found that models based upon clinical data provided better discrimination and accuracy in explaining variations in patient mortality (Hannan, Kilburn, Lindsey, & Lewis, 1992). Unfortunately the data found in almost all national healthcare databases tends to be highly administrative, and given that the data provided to us by a clinical commissioning group (CCG) is administrative, substantial amount of time was dedicated towards deriving new set of variables (over 100) through database programming, where each variable was tested for its significance and the impact it had on the predictive power of models. Therefore, without clinical data, the newly derived variables have made a significant improvement on model performance and above all contributed towards the development of robust and reliable predictive models.
The existing literature highlights the lack of models that are able to correctly identify patients at risk of readmission. In this respect, incorrect identification of patients at risk (or not at risk) of readmission can lead to poor use of resources (hence very costly) at a time when health services around the world including the NHS in England are struggling to provide care efficiently and effectively under severe financial constraints. This paper will therefore inevitably enable many researchers around the world to use these new variables in their predictive modelling exercises (and the development of robust decision support tools). Furthermore, these variables are not just for predicting patient readmissions but could also be utilized for other adverse outcomes, such as mortality, risk of heart failure, disease
progression, etc.
A number of clinical commissioning groups in England (payers of care) have started to incorporate the predictive algorithms shown in this article as part of their analytical toolkit to ensure the following: 1) readmission is used as a performance indicator in England, so the
31
lower the rate of readmission the better for the provider (i.e. hospital), hence implementing the optimal model within a decision support systems framework will certainly enable
hospitals to achieve key targets; 2) cost savings, that is, the more patients are treated for care in the community the less likely these patients will be readmitted back to hospital, and 3) reduction in waiting lists, i.e., release beds for elective admissions. Furthermore, we have developed similar models for cancer, coronary artery disease, stroke, congestive heart failure and hypertension (the main chronic diseases) and the results are very similar. All the results have been rigorously evaluated, providing robust and accurate sets of findings.
Many published papers have compared logistic regression with classification trees, neural networks and support vector machines, however no attempt has been made to compare the traditional approaches with more sophisticated data driven approaches (GAM and MARS). Predictive models tend to assume that length of stay (LoS) has a linear effect on log odds of readmission, which may not always be true, as it is in our case here. GAM and MARS are versatile approaches and relax this assumption by fitting a non-linear smooth arbitrary function (e.g. lowess and smoothing splines) on LoS. This is more flexible than the logistic regression model and is still interpretable since the functions fj can be plotted to give a sense of the marginal relationship between the predictors and the response (Figure 5 and 6). These approaches have provided some interesting insights, which can be beneficial for senior decision makers (clinicians, commissioners), e.g., the issues surrounding emergency and non-emergency LoS.
Amongst all the models developed so far there have also been no attempts to assess the predictive power of these models. Using the repeated bootstrap resampling approach, we generated 1000 validation samples and investigated the distribution of key performance measures, clearly showcased the sensitivity of these measures based on many validation
32
samples. Furthermore, the majority of studies have only used ROC statistics, sensitivity and specificity scores, whereas in this paper, we have considered other well-known performance measures (generalized R2N index, Brier’s score) and examined if there is a consensus amongst the measures to select the most appropriate model.
For these reasons the paper should be considered a major contribution to the literature filling in a major gap in the literature.
33 REFERENCES
Allaudeen, N., Schnipper, J. L., Orav, E. J., Wachter, R. M., & Vidyarthi, A. R. (2011). Inability of providers to predict unplanned readmissions. Journal of General Internal Medicine, 26, 771-776.
Amarasingham, R., Moore, B. J., Tabak, Y. P., Drazner, M. H., Clark, C. A., Zhang, S., . . . Halm, E. A. (2010). An automated model to identify heart failure patients at risk for 30-day
readmission or death using electronic medical record data. Medical Care, 48(11), 981-988. Austin, P. C. (2007). A comparison of regression trees, logistic regression, generalized additive
models, and multivariate adaptive regression splines for predicting AMI mortality. Statistics in Medicine, 26, 2937-2957.
Avila, P. C., Segal, M. R., Wong, H. H., Boushey, H. A., & Fahy, J. V. (2000). Predictors of late asthmatic response. Logistic regression and classification tree analyses. American Journal of Respiratory and Critical Care Medicine, 161, 2092-2095.
Bardhan, I., Kirksey, K., Oh, J. & Zheng, E. (2011). A predictive model for readmission of patients with congestive heart failure: a multi-hospital perspective. Proceedings of the Thirty-second International Conference on Information Systems, Shanghai, December 2011, 1-39.
Billings, J., & Mijanovich, T. (2007). Improving the management of care for high-cost Medicaid patients. Health Affairs (Millwood), 26(6), 1643-1654.
Billings, J., Blunt, I., Steventon, A., Georghiou, T., Lewis, G., & Bardsley, M. (2012). Development of a predictive model to identify inpatients at risk of re-admission within 30days of discharge (PARR-30). British Medical Journal. doi:10.1136/bmjopen-2012-001667
Billings, J., Dixon, J., Mijanovich, T., & Wennberg , D. (2006). Case finding for patients at risk of readmission to hospital: development of algorithm to identify high risk patients. British Medical Journal, 333(7563), 327.
Bottle, A., Aylin, P., & Majeed , A. (2006). Identifying patients at high risk of emergency hospital admissions: a logistic regression analysis. Journal of the Royal Society of Medicine, 99(8), 406-414.
Capewell, S. (1996). The continuing rise in emergency admissions. British Medical Journal, 312, 991–992.
Clarke, A., Blunt, I., & Bardsley, M. (2012). Analysis of Emergency 30-Day Readmissions in England Using Routine Hospital Data 2004-2010. Is there Scope for Reduction? Journal of Epidemiology and Community Health. doi:10.1136/jech-2012-201753.117
Coleman, E. A., Min, S. J., Chomiak, A., & Kramer, A. M. (2004). Post hospital care transitions: patterns, complications, and risk identification. Health Services Journal, 39(5), 1449-1465. Datar, A., & Sood, N. (2011). Impact of postpartum hospital-stay legislation on new-born length of
stay, readmissions, and mortality in California. Pediatrics, 118, 63-72.
Demir, E., & Chaussalet, T. J. (2011). Capturing the re-admission process: a focus on time window.
Journal of Applied Statistics, 38, 951-961.
Department of Health. (2005). Case management competences framework for the care of people with long term conditions. Retrieved August 23, 2012, from
http://www.dh.gov.uk/en/Publicationsandstatistics/Publications/PublicationsPolicyAndGuida nce/DH_4118101
Department of Health. (2010a). White Paper: Equity and Excellence-Liberating the NHS. Retrieved from
http://www.dh.gov.uk/prod_consum_dh/groups/dh_digitalassets/@dh/@en/@ps/documents/d igitalasset/dh_117794.pdf
Department of Health. (2010b). Healthy Lives, Healthy People: transparency in outcomes, proposals for a public health outcomes framework. London.
Department of Health. (2011a). Health and Social Care Bill. Retrieved August 23, 2012, from http://www.publications.parliament.uk/pa/cm201011/cmbills/132/11132.pdf
Department of Health. (2011b). Payment by Results Guidance for 2011–12. London.
34
predicted by recursive partitioning. Journal of the American Geriatrics Society, 49, 1614-1621.
Faraway, J. J. (2006). Extending the linear model with R: Generalized Linear, mixed effects and nonparametric regression models. Chapman & Hall.
Friedman, J. H. (1991). Multivariate adaptive regression splines. The Annals of Statistics, 19, 1-67. Hamm, C. (2010). The coalition government's plans for the NHS in England. British Medical Journal,
341, c3790.
Hammill, B. G., Curtis, L. H., Fonarow, G. C., Heidenreich, P. A., Yancy, C. W., Peterson, E. D., & Hernandez, A. F. (2011). Incremental Value of Clinical Data Beyond Claims to Predict 30-Day Outcomes Following Heart Failure Admission. Cardiovascular Outcomes Research, 4(1), 60-67.
Hannan, E. L., Kilburn, H. J., Lindsey, M. L., & Lewis, R. (1992). Clinical versus administrative databases for CABG surgery. Does it matter? Medical Care, 30, 892-907.
Hansen, L. O., Young, R. S., Hinami, K., Leung, A., & Williams, M. V. (2011). Interventions to reduce 30-day rehospitalization: a systematic review. Annals of Internal Medicine, 155, 520-528.
Harrell Jr, F. E. (2001). Regression Modeling Strategies. New York: Springer.
Hasan, O., Meltzer, D. O., Shaykevich , S. A., Bell, C. M., Kaboli, P. J., Auerbach, A. D., . . . Schnipper, J. L. (2010). Hospital readmission in general medicine patients: a prediction model. Journal of General Internal Medicine, 25(3), 211-219.
Hasford, J., Ansari, H., & Lehmann, K. (1993). CART and logistic regression analyses of risk factors for first dose hypotension by an ACE-inhibitor. Therapie, 48, 479-482.
Hastie, T. J., & Pregibon, D. (1993). Generalized linear models. New York: Chapman & Hall. Hastie, T. J., & Tibshirani, R. J. (1990). Generalized Additive Models. London: Chapman & Hall. Hastie, T., Tibshirani, R., & Friedman, J. (2009). The Elements of Statistical Learning: Data Mining,
Inference and Prediction (2nd ed.). New York: Springer.
Holman, C. A., Preen, D. B., Baynham, N. J., Finn, J. C., & Semmens, J. B. (2005). A mutipurpose comorbidity scoring system performed better than the Charlson index. Journal of Clinical Epidemiology, 58(10), 1006-1014.
Hospital Episode Statistics. (2012). HES online: Understanding the Data. Retrieved August 24, 2012, from http://www.hesonline.nhs.uk/Ease/servlet/ContentServer?siteID=1937&categoryID=289 Howell, S., Coory, M., Martin, J., & Duckett, S. (2009). Using routine inpatient data to indentify
patients at risk of hospital readmission. BMC Health Services Research, 9(96).
James, K. E., White, R. F., & Kraemer, H. C. (2005). Repeated split sample validation to assess logistic regression and recursive partitioning: an application to the prediction of congnitive impairment. Statistics in Medicine, 24, 3019-3035.
Kansagara, D., Englander, H., Salanitro, A., Kagen, D., Theobald, C., Freeman, M., & Kripalani, S. (2011). Risk Prediction Models for Hospital Readmission. Journal of the American Medical Association, 306(15), 1688-1698.
Kemper, A., Kennedy, E., Dechert, R., & Saint, S. (2005). Hospital readmissions for bronchitis.
Clinical Pediatrics, 44, 509-513.
Krumholz, H. M., Normand, S.-L. T., Keenan, P. S., Desai, M. M., Lin, Z., Drye, E. E., . . . Schreiner, G. B. (2008a). Hospital 30-Day Acute Myocardial Infarction Readmission Measure:
Methodology. Retrieved August 20, 2012, from
http://www.qualitynet.org/dcs/ContentServer?c=Page&pagename=QnetPublic%2FPage%2F QnetTier3&cid=1219069855841
Krumholz, H. M., Normand, S.-L. T., Keenan, P. S., Desai, M. M., Lin, Z., Drye, E. E., . . . Schreiner, G. C. (2008b). Hospital 30-Day Acute Myocardial Infarction Readmission Measure:
Methodology. Retrieved August 20, 2012, from
http://www.qualitynet.org/dcs/ContentServer?c=Page&pagename=QnetPublic%2FPage%2F QnetTier3&cid=1219069855841
Krumholz, H. M., Normand, S.-L. T., Keenan, P. S., Desai, M. M., Lin, Z., Drye, E. E., . . . Schreiner, G. C. (2008c). Hospital 30-Day Pneumonia Readmission Measure. Retrieved August 20, 2012, from
35
QnetTier3&cid=1219069855841
Kuchibhatla, M., & Fillenbaum, G. G. (2003). Alternative statistical approaches to identifying dementia in a community-dwelling sample. Aging and Mental Health, 7, 383-389.
Lemon, S. C., Roy, J., Clark, M. A., Friedmann, P. D., & Rakowski, W. (2003). Classification and regression tree analysis in public health: methodological review and comparison with logistic regression. Annals of Behavioral Medicine, 26, 172-181.
Long, W. J., Griffith, J. L., Selker, H. P., & D'Agostino, R. B. (1993). A comparison of logistic regression to decision tree induction in a medical domain. Computers and Biomedical Research, 26, 74-97.
Moloney, E., Bennett, K., & Silke, B. (2004). Patient and disease profile of emergency medical readmissions to an Irish teaching hospital. Postgraduate Medical Journal, 80, 470-474. Nagelkerke, N. J. (1991). A note on a general definition of the coefficient of determination.
Biometrika, 78, 691–692.
Nelson, L. M., Bloch, D. A., Longstreth, J. W., & Shi, H. (1998). Recursive partitioning for the identification of disease risk subgroups: a case-control study of subarachnoid hemorrhage.
Journal of Clinical Epidemiology, 51, 199-209.
Nishida, N., Tanaka, M., Hayashi, N., Nagata, H., Takeshita, T., Nakayama, K., . . . Shizukuishi, S. (2005). Determination of smoking and obesity as periodontitis risks using the classification and regression tree method. Journal of Periodontology, 76, 923-928.
Purdy, S. (2011). Avoiding hospital admissions: what does the research evidence say? Retrieved from King's Fund: http://www.kingsfund.org.uk/publications/avoiding_hospital.html
R Core Development Team. (2005). R: A Language and Environment for Statistical Computing.
Vienna: R Foundation for Statistical Computing.
Reed, R., Pearlman, R., & Buchner, D. (1991). Risk factors for early unplanned hospital readmission in the elderly. Journal of General Internal Medicine, 6, 223-228.
Roland, M., Dusheiko, M., Gravelle, H., & Parker, S. (2005). Follow up of people aged 65 and over with a history of emergency admissions: analysis of routine admission data. British Medical Journal, 330, 289-292.
Roland, M., Dusheiko, M., Gravelle, H., & Parker, S. (2005). Follow up of people aged 65 and over with a history of emergency admissions: Analysis of routine admission data. British Medical Journal, 330, 289-292.
Sauerbrei, W., Madjar, H., & Prompeler, H. J. (1998). Differentiation of benign and malignant breast tumors by logistic regression and a classification tree using Doppler flow signals. Methods of Information in Medicine, 37, 226-234.
Schwarzer, G., Nagata, T., Mattern, D., Schmelzeisen, R., & Schumacher, M. (2003). Comparison of fuzzy inference, logistic regression, and classification trees (CART). Prediction of cervical lymph node metastasis in carcinoma of the tongue. Methods of Information in Medicine, 42, 572-577.
Steventon, A., Bardsley, M., & Billings, J. (2011). An evaluation of the impact of community-based interventions on hospital use. London: Nuffield Trust. Retrieved from
http://www.nuffieldtrust.org.uk/sites/files/nuffield/an-evaluation-of-the-impact-of-community-based-interventions-onhospital-usefull_report.pdf
Stewart, P. W., & Stamm, J. W. (1991). Classification tree prediction models for dental caries from clinical, microbiological, and interview data. Journal of Dental Research, 70, 1239-1251. Tsien, C. L., Fraser, H. S., Long, W. J., & Kennedy, R. L. (1998). Using classification tree and
logistic regression methods to diagnose myocardial infarction. Medinfo, 9, 493-497.
van Walraven, C., Dhalla, I. A., Bell, C., Etchells, E., Stiell, I. G., Zarnke, K., . . . Forster, A. (2010). Derivation and validation of an index to predict early death or unplanned readmission after discharge from hospital to the community. Canadian Medical Association Journal, 182(6), 551-557.