A
A
m
m
b
b
i
i
e
e
n
n
t
t
A
A
i
i
r
r
M
M
o
o
n
n
i
i
t
t
o
o
r
r
i
i
n
n
g
g
P
P
r
r
o
o
t
t
o
o
c
c
o
o
l
l
F
F
o
o
r
r
P
P
M
M
2
2
.
.
5
5
a
a
n
n
d
d
O
O
z
z
o
o
n
n
e
e
C
C
a
a
n
n
a
a
d
d
a
a
-
-
w
w
i
i
d
d
e
e
S
S
t
t
a
a
n
n
d
d
a
a
r
r
d
d
s
s
f
f
o
o
r
r
P
P
a
a
r
r
t
t
i
i
c
c
u
u
l
l
a
a
t
t
e
e
M
M
a
a
t
t
t
t
e
e
r
r
a
a
n
n
d
d
O
O
z
z
o
o
n
n
e
e
PN 1456
ISBN 978-1-896997-99-5 PDF
Ambient Air Monitoring Protocol for PM2.5and Ozone i
The Canadian Council of Ministers of the Environment (CCME) is the major intergovernmental
forum in Canada for discussion and joint action on environmental issues of national,
international and global concern. The 14 member governments work as partners in developing
nationally consistent environmental standards, practices and legislation.
Canadian Council of Ministers of the Environment
123 Main St., Suite 360
Winnipeg, Manitoba R3C 1A3
Telephone: (204) 948-2090
Fax: (204) 948-2125
www.ccme.ca
PN 1456
ISBN 978-1-896997-99-5 PDF
Ce document est également publié en français.
This Monitoring Protocol responds to the commitment by the Canadian Council of Ministers of the Environment (CCME) in the Canada-wide Standards (CWS) for Particulate Matter (PM) and Ozone to establish and maintain a monitoring protocol to ensure the comparability of monitoring data.
This Monitoring Protocol is intended as a reference tool for jurisdictions and the public on the operation and coordination of ambient monitoring programs in support of the CWS for PM and Ozone. Such coordination allows for the analysis of ambient air quality trends, the assessment of regional source-receptor relationships, the analysis of transboundary air quality and the design of implementation plans. This document was prepared through an open and transparent process by the Working Group on Monitoring and Reporting. The Working Group included representatives from federal, provincial and regional governments as well as participants from health and environmental groups and industry. Following the completion of Joint Actions Implementation and Coordination Committee’s (JAICC) mandate in 2005, the responsibility for completion of the Monitoring Protocol was assigned to the National Air Pollutant Surveillance (NAPS) program. Assistance in document preparation was also provided under contract by ORTECH Environmental.
Ambient Air Monitoring Protocol for PM2.5and Ozone iii
TABLE OF CONTENTS
List of Tables and Figures... v
Executive Summary... vi
Acronyms and Abbreviations... viii
1.0 Introduction... 1
1.1
Purpose and Application ...1
1.2
Background to Canada-wide Standards for PM and Ozone ...2
2. Pollutants of Interest... 4
3. Ambient Air Quality network... 7
4. Network Design... 9
4.1
Monitoring Network Objectives ...9
4.2
Spatial Representativeness...10
4.3
Site Classification ...10
4.3.1 CWS Achievement Reporting Stations... 10
4.3.2 Regional Transport/Background Stations ... 12
4.3.3 Chemical Speciation/Precursor Stations ... 13
4.3.4 Special Studies Stations ... 13
4.4
Site Selection ...13
4.4.1 Urban Networks... 14
4.4.2 Rural Networks ... 18
4.5
Sampling System ...19
4.5.1 Shelter Requirements... 19
4.5.2 Probe Siting Criteria ... 19
4.5.3 Manifold Design ... 23
4.5.4 Site and Analyzer Operation... 23
4.5.5 Background Siting Aspects... 23
5. Data Quality Objectives... 25
5.1
Purpose of Data Quality Objectives...25
5.2
Data Quality Objectives for PM
2.5and Ozone...26
5.3
Equivalency Criteria for Continuous PM
2.5Instruments ...27
6. Measurement Methods... 29
6.1
Methods for Measuring PM
2.5Concentration ...29
6.1.1 Manual Methods for Measuring PM2.5... 30
6.1.2 Continuous Methods for Measuring PM2.5Concentration... 33
6.1.3 PM2.5Speciation Monitoring ... 36
6.2
Continuous Methods for Measuring Ozone...37
6.3
Methods for Measuring Coarse Particulate Mass ...38
6.4
Methods for Measuring Sulphur Dioxide ...39
6.5
Methods for Measuring Nitrogen Oxides ...40
6.6
Methods of Measuring Ammonia ...41
6.8
Methods for Measuring Volatile Organic Compounds...42
7. Quality Assurance Requirement... 43
7.1
Field Procedures...43
7.2
Shipping Procedures ...43
7.3
Laboratory Procedures ...44
7.4
Data Management Procedures ...44
8. Data Management... 45
8.1
Data Format ...45
8.2
Data Submission ...45
8.3
Data Access...45
9. Protocol Revisions... 46 Glossary... 47 References... 48Ambient Air Monitoring Protocol for PM2.5and Ozone v
LIST OF TABLES AND FIGURES
Figure 1: Simplified Secondary Particle Formation Processes... 5
Figure 2: Acceptable Zone for Siting Particulate Monitors... 22
Figure 3: U.S. EPA Performance Criteria for Approval of PM
2.5FEMs ... 28
Table 1: Monitoring strategy for the CWS for PM and ozone ... vii
Table 2: General Urban Parameter Trends and Temporal Features ... 6
Table 3: Spatial Scales of Representativeness ... 10
Table 4: NAPS Network Station Classification and Distribution Criteria ... 15
Table 5: NAPS Network Sample Probe Siting Criteria ... 20
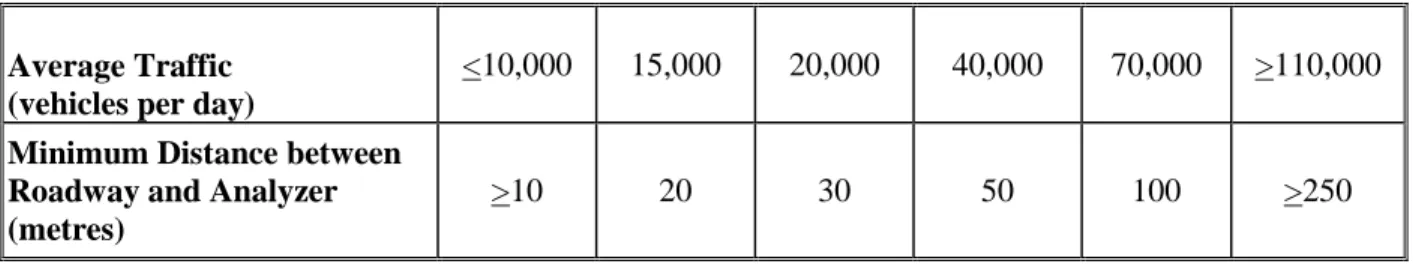
Table 6: Minimum Distance from Roadways for O
3and NO
2Analyzers ... 23
Table 7: Summary of NAPS Station Work Activities ... 23
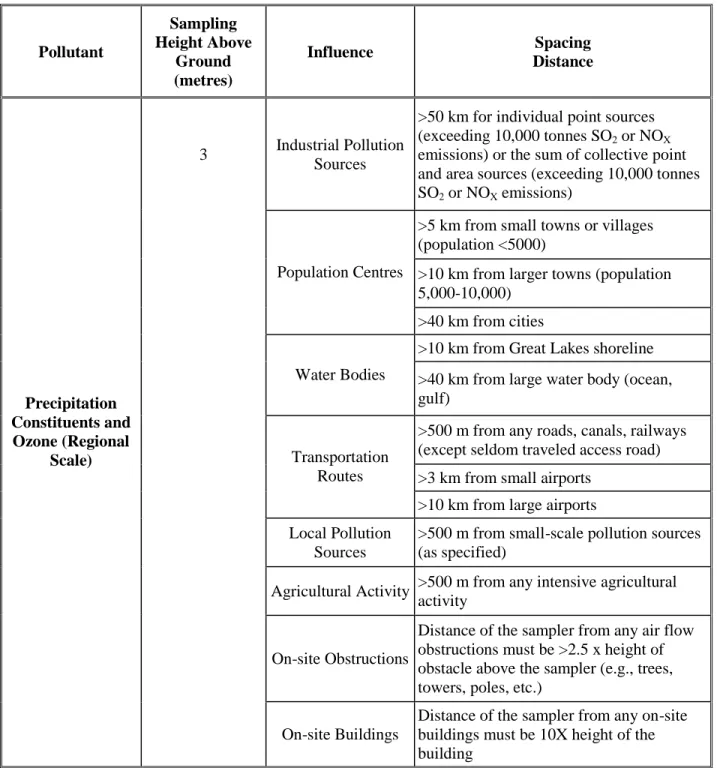
Table 8: CAPMoN Station and Probe Siting Criteria... 24
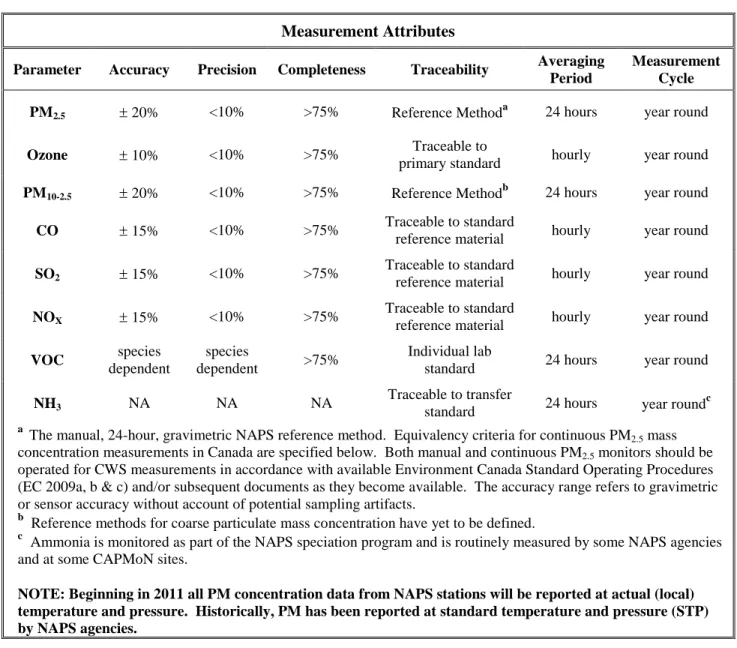
Table 9: Data Quality Objectives... 26
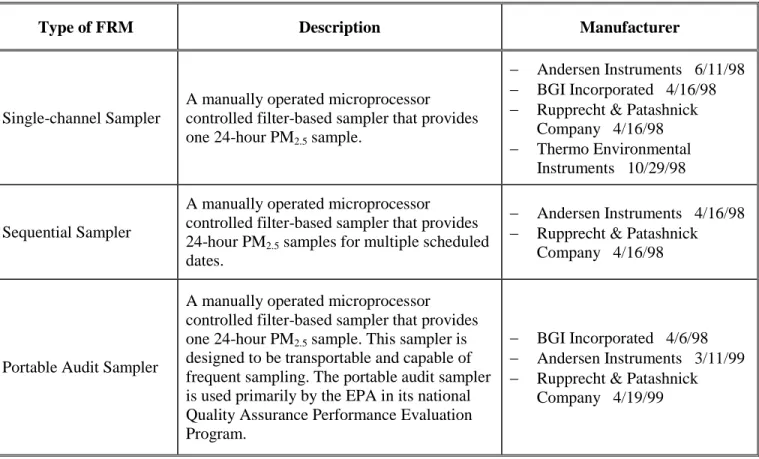
Table 10: FRM Sampler Types... 32
Table 11: Summary of Real-Time Particle Monitoring Techniques Deployed in Canada... 34
Table 12: Sampling Modules and Target Analyte Groups ... 37
EXECUTIVE SUMMARY
The Ambient Air Monitoring Protocol for the Canada-wide Standards (CWS) for PM2.5 and Ozone (Monitoring Protocol) should be read in the context of at least two other documents: the Guidance Document on Achievement Determination (GDAD), and the Guidance Document on Keeping Clean Areas Clean and Continuous Improvement(CCME 2007a and b).
The primary purpose of the Monitoring Protocol is to ensure comparability of data across the various ambient monitoring networks in Canada (refer to Section 3) that will be used to achieve the following objectives for the CWS:
measure representative PM and ozone concentrations in populated areas across the country;
measure the highest representative ozone concentrations in metropolitan areas;
measure background concentrations and transport of PM and ozone into areas impacted by transboundary levels;
support the development of appropriate management strategies on a regional basis;
track and report attainment progress;
ensure measurements are reliable and inter-comparative across all regions.
The Monitoring Protocol presents guidelines that will serve as a minimum requirement for networks collecting ambient data in support of the CWS. Adoption of common standards across the country ensures that data collected by networks in different jurisdictions can be analyzed as a consistent dataset, thus increasing the power of statistical methods and gaining maximum scientific return from resources invested. The adoption of national data quality objectives (DQOs) also allows individual networks to exceed those standards where technology and resources permit.
In this document, DQOs are defined as “measurable attributes of the monitoring data that will allow program objectives and measurement objectives to be met.” These performance-based objectives have been defined to allow new and emerging technologies to be incorporated into monitoring activities as they are shown to meet network DQOs.
This Monitoring Protocol identifies four types of monitoring stations:
Ambient Air Monitoring Protocol for PM2.5and Ozone vii
Table 1: Monitoring strategy for the CWS for PM and ozone
Monitoring Station Type Main Purpose of Monitoring Station
CWS achievement reporting Tracking and reporting of progress toward meeting the CWS for PM and Ozone.
Regional transport/background
Demonstrating transboundary influence and influence from background levels and natural events for
achievement determination.
Chemical speciation/precursor
Characterizing air quality and trends, developing and evaluating emission control strategies, estimating health related exposure risks, evaluating source-receptor relationships, providing data for input to run and evaluate models and measuring overall progress of air pollution control programs.
Special studies
To gain a better understanding of the causes of high PM2.5and ozone concentrations in the ambient air for the development of abatement strategies and conduct health studies, but short term, and may be mobile.
Additional information on the selection of CWS Reporting sites and procedures for determining achievement of CWS target levels is contained in the GDAD.
Quality Assurance/Quality Control (QA/QC) and data management standards are important elements of any monitoring program. The Monitoring Protocol identifies National Air Pollution Surveillance (NAPS) procedures as the standards to be applied to ambient monitoring of PM2.5 and ozone. As a minimum, participating networks should meet NAPS Quality Assurance and Quality Control Guidelines (EC, 2004). Jurisdictions are free to exceed national standards where technology and resources permit.
The field of ambient air monitoring is complex, and technology is evolving rapidly. The Monitoring Protocol identifies national standards. The guidelines associated with these standards may need to be revised or supplemented from time to time. The National Air Pollution Surveillance (NAPS) Mangers group is recognized as the appropriate body to revise ambient air monitoring protocols for CWS.
ACRONYMS AND ABBREVIATIONS
AAQS Analysis and Air Quality Section (Environment Canada) ARM approved regional methods (U.S.)
BAM beta attenuation mass
CAPMoN Canadian Air and Precipitation Monitoring Network CCME Canadian Council of Ministers of the Environment CFR code of federal regulations (U.S.)
CO carbon monoxide
CWS Canada-wide Standards
14
C carbon-14 or radiocarbon (radioactive isotope) DQOs data quality objectives
EDXRF energy dispersive X-ray fluorescence EPA Environmental Protection Agency (U.S.)
ETSC Environmental Science and Technology Centre (Environment Canada) FDMS® filter dynamic measurement system
FEM federal equivalent method (U.S.)
FR federal registrar (U.S.)
FRM federal reference method (U.S.)
GDAD Guidance Document on Achievement Determination (CWS) HAMN Hamilton Air Monitoring Network
HNO3 nitric acid
IMPROVE Interagency Monitoring of Protected Visual Environments (U.S.) KCAC/CI Keeping Clean Areas Clean – Continuous Improvement (CWS)
Kpa kilopascal
MARS Measurement and Analysis Research Section (Environment Canada)
MeV mega electron-volt
MSC Meteorological Service of Canada
MnO2 manganese dioxide
MOE Ministry of the Environment (Ontario)
MRWG Monitoring and Reporting Working Group (CCME) NAAQO National Ambient Air Quality Objectives (Canada) NAAQS National Ambient Air Quality Standards (U.S.) NAPS National Air Pollution Surveillance
NARSTO formally North American Research Strategy for Tropospheric Ozone
NH4NO3 ammonium nitrate
NH3 ammonia
NIST National Institute of Standards and Technology (U.S.)
NO3- nitrate
NAPS RM NAPS reference method
nm nanometre
NO nitric oxide
NO2 nitrogen dioxide
NOy total reactive oxidized nitrogen species
PAMS photochemical assessment monitoring stations (U.S.)
PAN peroxyacetyl nitrate
PBMS
performance-based measurement systemAmbient Air Monitoring Protocol for PM2.5and Ozone ix PM10 particulate matter less than or equal to 10 microns in diameter
PM10-2.5 particulate matter in the size range 2.5 to 10 microns in diameter (aka PM coarse fraction)
ppb parts per billion
QA/QC quality assurance/quality control
RH relative humidity
SCC sharp cut cyclone
SHARP synchronized hybrid ambient real-time particulate SLEA Sarnia Lambton Environmental Association SOP standard operating procedure
SO2 sulphur dioxide
SSI size selective inlet
STP standard temperature and pressure SVOC semi-volatile organic compounds SVPM semi-volatile particulate matter
TEOM™ tapered element oscillating microbalance™ TSP total suspended particulate
VSCC™ very sharp cut cyclone
VOC volatile organic compounds
WINS well impaction ninety-six
1.0
INTRODUCTION
1.1 Purpose and Application
This document provides guidance for the federal, provincial and territorial governments to ensure the coordination of monitoring data. The Ambient Air Monitoring Protocol for PM2.5 and Ozone allows for better coordination of the design and operation of monitoring programs, analyses of ambient air quality trends, assessments of regional source-receptor relationships, analyses of transboundary air quality impacts, and design of implementation plans. For brevity, this document is hereafter referred to as the Monitoring Protocol.
Other ambient air monitoring-related documents specifically prepared for the Canadian Council of Ministers of the Environment (CCME) to support the management of the Canada-wide Standards for PM and Ozone (CWS) include:
Guidance Document on Achievement Determination (GDAD);and
Guidance Document on Keeping Clean Areas Clean and Continuous Improvement.
The primary purpose of the Monitoring Protocol is to ensure comparability of data across the various ambient monitoring networks in Canada (refer to Section 3) that will be used to achieve the following objectives of the CWS for PM and Ozone:
measure representative PM and ozone concentrations in populated areas across the country;
measure the highest representative ozone concentrations in metropolitan areas;
measure background concentrations and transport of PM and ozone into areas impacted by transboundary levels;
support the development of appropriate management strategies on a regional basis;
track and report progress on achievement of the numerical targets;
ensure measurements are reliable and inter-comparative across all regions.
Quality Assurance/Quality Control (QA/QC) and data management standards are important
elements of any monitoring program. The Monitoring Protocol identifies National Air Pollution
Surveillance (NAPS) procedures as the standards to be applied to ambient monitoring of PM
2.5and
INTRODUCTION
Ambient Air Monitoring Protocol for PM2.5and Ozone 2 Guidelines (EC, 2004).
Jurisdictions are free to exceed national standards where technology and
resources permit.
Participating ambient air monitoring networks should operate in a manner consistent with the methods and practices described in this Monitoring Protocol at all sites from which data will be used to address the CWS objectives described above. Data comparability is essential for analyzing ambient air quality trends, assessing regional source-receptors and analyzing transboundary air quality. Adherence to Monitoring Protocol specifications is particularly important at sites specifically designated for tracking and reporting, as described in Section 4. The Monitoring Protocol follows, and supersedes, Appendix B of the Ambient Air Monitoring Working Group’s Ground-Level Ozone and Precursor Monitoring Guidelines and Implementation Report. (Canadian – Monitoring, 1997).
1.2 Background to Canada-wide Standards for PM and Ozone
On June 5, 2000, the CCME, except Quebec, endorsed the CWS for PM and Ozone. The CWS Agreement recognizes that PM and ozone negatively affect human health and the environment in a significant way, and it establishes the need for a nationally coordinated, long-term management toward minimizing risks from these pollutants.
In agreeing to the CWS, federal, provincial and territorial jurisdictions across Canada have made strong commitments to implement the CWS, to share information respecting implementation, and to be accountable to their respective publics.
The CWS Agreement consists of several parts:
Part 1 establishes numerical targets and timeframes for achieving the goals within each jurisdiction.
Part 2 establishes the steps each jurisdiction will take toward implementation of plans, programs and actions to meet the standards within agreed-to timeframes, sets out provisions for subsequent reviews of the standards, and prescribes substance and timing for jurisdictions to report on their progress in meeting the standards.
Annex A acknowledges the need to take preventative action in many areas of the country, with provisions for developing strategies such as Continuous Improvement and Keeping Clean Areas Clean.
Annex B provides direction for jurisdictional reporting on all aspects of the CWS, from management plans and actions to achievement of the numerical targets.
Standards to be Achieved by 2010
Under the CWS, jurisdictions defined ambient Standards for fine particulate matter (PM2.5) and ozone to be achieved by 2010. The Standards are recognized as an important first step toward the long-term goal of minimizing the risks that PM and ozone pose to human health and the environment. The Standards and their statistical forms are as follows:
PM2.5CWS – 30μg/m 3
as a 24-hour average
Theform of the Standardis the3-year averageof the annual 98th percentile 24-hour average PM2.5levels.
Ozone CWS–65 ppb as an 8-hour average
Theform of the Standardis the3-year averageof the annual 4th highest of the daily maximum 8-hour average ozone levels.
At the time the CWS were endorsed, these Standards represented a balance between a desire to achieve the best health and environmental protection possible in the near term, and the feasibility and costs of reducing the smog-producing emissions.
The PM2.5 and ozone Standards can be viewed as consisting of two parts. The first part expresses the numerical values themselves, that is 30 µg/m3for PM2.5 and 65 ppb for ozone, and the second part is the
formof the Standards. The form of the Standards states how the measured PM2.5and ozone levels are to be expressed for evaluating whether the Standards are being achieved or not. These forms are the specified 3-year averages.
The reporting provisions in Part 2 of the CWS Agreement commit jurisdictions to report as follows on progress towards meeting the numerical targets and timeframes, implementation of emission reduction plans and programs, and review of the standards:
(a) to the respective publics of each jurisdiction on a regular basis, the timing and scope of reporting to be determined by each jurisdiction;
(b) to Ministers and the public, with comprehensive reports at 5-year intervals beginning in 2006, and reports on achievement and maintenance of the CWS annually, beginning in 2011, in accordance with guidance provided in Annex B.
Annex A applies to those parts of Canada that do not exceed the CWS targets. The annex describes the goals of Continuous Improvement and Keeping Clean Areas Clean and encourages jurisdictions to apply pollution prevention and best management practices to achieve these goals.
Annex B, the Reporting Protocol, contains provisions designed to help jurisdictions ensure consistency and comparability in their reporting, and to help the public better understand how jurisdictions plan to track and report on progress. To help meet these objectives, the CCME committed to the preparation and update, as required, of aGuidance Document on Achievement Determination(GDAD) for the PM and Ozone CWS. The Reporting Protocol also commits jurisdictions to maintain their own data on ambient measurements of PM2.5, PM10 and ozone and to make the data accessible to the public. Ambient air monitoring experts in Canada are to establish and maintain a Monitoring Protocol (this document) to ensure the national comparability of such monitoring data. This allows for better coordination of monitoring program design and operation, ambient air quality trends analyses, regional source-receptor assessments, transboundary air quality analyses and implementation plan design.
Ambient Air Monitoring Protocol for PM2.5and Ozone 4
2. POLLUTANTS OF INTEREST
The Canada-wide Standards for PM and Ozone focus specifically on the measurement of ambient concentrations of PM2.5and ground-level ozone in air, primarily for the purpose of determining achievement of the CWS numerical targets. Another important objective for monitoring is to develop improved source-receptor relationships and a better understanding of the causes of high ambient concentrations of PM2.5and ozone for abatement strategy development. This not only requires monitoring of PM2.5and ozone, but must also include their precursors and the chemical composition of PM2.5.
Ozone is formed as a secondary pollutant in the atmosphere whereby concentrations are highly dependent on solar radiation and ambient concentrations of nitrogen oxides (NOX), volatile organic compounds (VOC), and carbon monoxide (CO). In rural areas, NOXgenerally makes up only a small fraction of total reactive oxidized nitrogen species (generally referred to as NOYand including peroxyacetyl nitrate (PAN), HNO3 and NO3- aerosol along with NO and NO2). Speciated VOC measurements provide information on the contribution of the principal VOC emissions sources to ambient concentrations which may in turn be used to verify emissions inventories and photochemical modelling results. Carbon monoxide is an important component in oxidant photochemistry and ground-level ozone formation. In urban areas, CO measurements provide an index of anthropogenic emissions and, when linked with NOX and VOC measurements, can provide important information related to emissions verification and the efficiency of emissions controls, especially as they relate to the transportation sector. In rural settings, CO provides an index of the level of anthropogenic influence on air mass chemistry and, to some degree, the age of the air mass.
PM2.5 is composed of a mixture of primary and secondary particles, which have long lifetimes in the atmosphere (days to weeks) and can travel long distances (hundreds to thousands of kilometers). Sulphate, nitrate, organic and elemental carbon, trace elements, ammonium and water are often the major constituents of PM2.5. Primary particles are emitted directly into the atmosphere and include soil-related particles and carbon particles from fossil fuel combustion and biomass burning. Combustion processes also emit primary particles consisting of mixtures of many trace metal compounds. The principal types of secondary aerosols are ammonium sulphate and nitrate, formed from gaseous emissions of SO2 and NOX that react with ammonia (NH3), as well as organics formed from volatile and semi-volatile organic compounds. While the inorganic precursor gas relationships are more predictable, the extent to which VOCs contribute to PM2.5 formation is not well understood and additional measurement data are needed to quantitatively link specific source types to ambient PM2.5concentrations.
The coarse inhalable particle size fraction, PM10-2.5, consists of more localized fugitive dust which usually travels lesser distances than finer particle sizes and represents an important urban air quality parameter. Periodic natural events (e.g., dust storms, forest fires) can also contribute to elevated background levels.
POLLUTANTS OF INTEREST
This parameter differs in origin, composition and atmospheric behaviour with respect to the other more diffusive precursor constituents, but has linkages since potential carbonaceous constituents and light scattering properties of coarse particles can be relevant to changes in solar radiation.
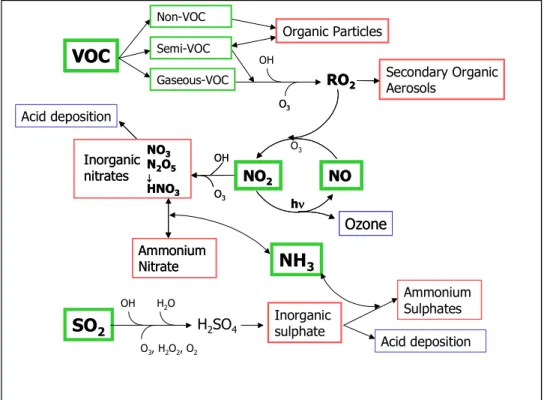
Figure 1, taken from Chapter 6 of Precursor Contributions to Ambient Fine Particulate Matter in Canada
(EC, 2001), is a simplified schematic of the processes that lead to formation of secondary PM2.5. The diagram is helpful in identifying the importance of carrying out complementary and collocated measurements in addition to PM2.5mass concentrations and ozone mixing ratio at a subset of sites.
Figure 1: Simplified Secondary Particle Formation Processes
As documented by NARSTO (a public/private partnership dedicated to improving management of air quality in North America) and elsewhere, both climatology and meteorology affect essentially all of the processes related to particulate matter formation, dispersive transport and deposition losses. Accordingly, the understanding of PM2.5 and precursor compound relationships requires associated measurements of meteorological parameters: wind speed, wind direction, temperature, relative humidity and solar radiation at pertinent locales. Seasonal concentration differences amongst the various parameters are often evident from monitoring data but not always readily explainable from available emissions data. It is known that large-scale PM2.5 episodes are caused mainly by unusual meteorological conditions such as the accumulation of precursor emissions associated with summer high pressure systems characterized by high temperatures, low wind speeds and stable conditions. Stagnating air masses during winter, in conjunction with lower temperatures, also facilitates the formation of secondary inorganic nitrate particle components. General concentration trends and temporal distributions, for specific parameters in Canada, are noted in Table 2. Temporal patterns may sometimes differ spatially depending on contributions of local and transported pollutants and meteorological variations.
Acid deposition
SO
2 H2SO4 Acid deposition Ammonium Sulphates Inorganic sulphateNH
3 OH O3, H2O2, O2 H2OVOC
Semi-VOCRO2 Secondary OrganicAerosols
Inorganic nitrates Ammonium Nitrate OH O3 NO3 N2O5 HNO3 OH O3 NO2 NO Ozone h
VOC
Gaseous-VOC Organic Particles RO2 Inorganic nitrates Ammonium Nitrate OH O3 NO3 N2O5 HNO3 O3 O3 NO2 NO Ozone h Non-VOCAmbient Air Monitoring Protocol for PM2.5and Ozone 6
Table 2: General Urban Parameter Trends and Temporal Features
Parameter Annual Mean (or other) Concentration
Trend
Trend Period Seasonal Distribution Diurnal or Daily Features References PM2.5 minor decrease to no apparent change in some cities 1986-1998 typically higher in summer but not all regions typically highest on weekday mornings EC 2001 EC 2005a NARSTO 2003 O3 variable but minor
increases in Ontario 1980-2003 higher in spring and summer highest in late afternoon and lowest in morning MOE 2004 CCME 2005 SLEA 2006 PM10-2.5 generally decreasing
1984-2000 higher in summer highest on weekdays CCME 2003 SO2 generally decreasing 1984-2003 generally highest in winter typically highest in mid-afternoon EC 2001 MOE 2004 SLEA 2006 NOX generally decreasing 1987-1998 generally highest in winter highest in morning EC 2001 MOE 2004 SLEA 2006 CO maximum concentrations generally decreasing in Ontario 1990-2003 generally highest in winter highest in morning and late afternoon at urban sites
MOE 2004 EC 2005b VOC species dependent,
some aromatics decreasing 1992-1999 aromatic species generally highest in winter but variable in East highest aromatics in morning and lowest at mid-day for single urban (continuous monitor) site EC 2001 MOE 2004 SLEA 2006 NH3 NA NA highest in spring, summer and autumn NA EC 2001
3. AMBIENT AIR QUALITY
NETWORK
Ambient air quality monitoring is conducted by both government and industry in Canada. All three levels of government (federal, provincial/territorial, regional/municipal) have monitoring programs established. At the federal level, Environment Canada is the department responsible for measuring pollution levels in the air. The Department has established several ambient air quality monitoring networks that focus on separate air issues.
The National Air Pollution Surveillance (NAPS) Network is a federal–provincial/territorial/regional government program that manages a national network of air pollution monitoring stations primarily located in Canadian urban centres. The federal government is responsible for coordinating the activities in the network, providing instrumentation, standardizing methods and procedures, ensuring quality assurance, carrying out audits and publishing NAPS data. The provinces and participating regional governments provide on-site operation and maintenance of the stations, quality assurance and quality control, data collection and data validation.
The NAPS network collaborating agencies are the following:
Newfoundland and Labrador Department of Environment and Conservation
Prince Edward Island Department of Environment, Energy and Forestry
Nova Scotia Environment and Labour
New Brunswick Department of the Environment / Ministère de l'Environnement du Nouveau-Brunswick
Ministère du Développement durable, de l'Environnement et des Parcs du Québec
Ville de Montréal
Ontario Ministry of Environment
Manitoba Conservation
Saskatchewan Ministry of Environment
Alberta Environment
British Columbia Ministry of the Environment
Metro Vancouver
Government of Yukon
Government of the Northwest Territories
Government of Nunavut / Gouvernement du Nunavut
Environment Canada
AMBIENT AIR
QUALITY NETWORK
Ambient Air Monitoring Protocol for PM2.5and Ozone 8 While NAPS is the most prominent network, Environment Canada has also established or takes part in other networks. The Canadian Air and Precipitation Monitoring Network (CAPMoN) is a non-urban air quality monitoring network with siting criteria designed to ensure that the measurement locations are regionally representative and are not affected by local sources of air pollution. CAPMoN has been in operation for more than 20 years. Its initial focus was on acid rain, but now some sites also measure smog pollutants (NOX, PM and ozone). Data from the CAPMoN are used to assess regional background levels and long-range transport of pollutants.
The provinces have legislative authority to control air pollution, and therefore most have established monitoring sites to measure both ambient air quality as well as acid deposition.
Alberta has several airshed associations responsible for monitoring and reporting on air quality within a designated area. Airshed associations are comprised of industry, government and non-government organizations using a consensus model to make decisions.
Some regional/municipal governments have established monitoring networks as well such as: Metro Vancouver (formerly the Greater Vancouver Regional District (GVRD)) in British Columbia and the Ville de Montréal in Quebec who both measure ambient air pollutants.
Industry also conducts ambient air quality monitoring in Canada. These sites are established close to their facilities and are usually required under provincial operating permits. Community monitoring networks, operated by local industry groups, include the Sarnia Lambton Environmental Association (SLEA) network, the Hamilton Air Monitoring Network (HAMN) and the Sudbury monitoring network.
4. NETWORK DESIGN
The number and distribution of air quality monitoring stations required in a network depend on the area to be covered, the spatial variability of the pollutants being measured, and the required data usage.
Monitoring networks including NAPS are generally designed to help assess the primary integrated air quality influences pertaining to population exposure and/or ecological effects; these influences include emission source contributions and atmospheric processes. In most instances, a subset of existing NAPS or CAPMoN network sites should be applicable to CWS requirements. For CWS implementation, jurisdictions will review the current monitoring networks to determine and designate the most applicable sites for reporting as well as define any necessary modifications or additional monitors that are needed to meet the monitoring requirements for CWS achievement determination. From an effects perspective, it is relevant to note that network monitoring data trends can be used, with reasonable accuracy, to evaluate associated potential trends in effects, but it is ultimately more difficult to quantify concentration thresholds related to specific effects (Sajani et al 2004).
4.1 Monitoring Network Objectives
The most important consideration in designing or implementing any monitoring system is defining its overall objectives. Although similar measurement methods and protocols can be used to collect PM2.5and ozone data from all sites, the location of sites and their proximity to sources, population centres and political boundaries will vary, depending on the proposed use of the data.
The primary purpose of the Monitoring Protocol is to ensure comparability of data across the various ambient monitoring networks in Canada (refer to Section 3) that will be used to achieve the following objectives of the CWS for PM and Ozone:
measure representative PM and ozone concentrations in populated areas across the country;
measure the highest representative ozone concentrations in metropolitan areas;
measure background concentrations and transport of PM, ozone and their precursors into areas impacted by background/transboundary sources;
support the development of appropriate management strategies on a regional basis;
track and report on air quality trends and the effectiveness of management strategies;
NETWORK DESIGN
Ambient Air Monitoring Protocol for PM2.5and Ozone 10
4.2 Spatial Representativeness
To satisfy different monitoring objectives, stations are sited by both geographical and physical location. Physical location is defined by the concept of spatial scale of representativeness and is described in terms of the physical dimensions of the air parcel nearest to a monitoring station throughout which actual pollutant concentrations are reasonably uniform. The goal in siting stations is to match the spatial scale represented by the sample of monitored air with the spatial scale most appropriate for the monitoring objective of the station.
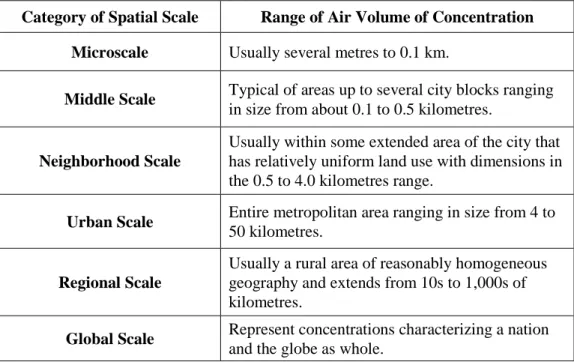
Six categories of spatial scales of representativeness have been defined for monitoring station siting purposes (U.S. EPA, 1997)
Table 3: Spatial Scales of Representativeness
Category of Spatial Scale Range of Air Volume of Concentration Microscale Usually several metres to 0.1 km.
Middle Scale Typical of areas up to several city blocks ranging
in size from about 0.1 to 0.5 kilometres.
Neighborhood Scale
Usually within some extended area of the city that has relatively uniform land use with dimensions in the 0.5 to 4.0 kilometres range.
Urban Scale Entire metropolitan area ranging in size from 4 to
50 kilometres.
Regional Scale
Usually a rural area of reasonably homogeneous geography and extends from 10s to 1,000s of kilometres.
Global Scale Represent concentrations characterizing a nation
and the globe as whole.
4.3 Site Classification
To address the broad application of data described in the CWS, the following four types of monitoring stations are identified:
1. CWS achievement reporting 2. Regional transport/background 3. Chemical speciation/precursor 4. Special studies
4.3.1 CWS Achievement Reporting Stations
Population or community-oriented monitoring sites are used to determine the representative area-wide public exposure levels of PM2.5and ozone. These stations measure PM2.5and ozone for comparison with the
CWS and should be located in residential, commercial, industrial or other areas where people spend significant amounts of time. Neighbourhood or urban scale stations are typically appropriate for this objective.
Measurement at neighbourhood or urban spatial scales should be generally appropriate for PM2.5 achievement determination purposes when sub-regional conditions for the dimensional area are reasonably homogeneous with respect to PM2.5concentrations, land-use and land-surface characteristics. Although the highest PM2.5concentrations within communities might be expected to occur near major emission sources, the levels measured close to individual sources may not necessarily represent concentrations to which the majority of the community population is exposed. Selection of associated PM2.5monitoring sites requires careful consideration (guidance is provided in subsequent sections of this document) in order to account for both collective community and other source contributions to the measured levels. Properly sited community-oriented measurements should then facilitate the development of control strategies to reduce broader community-wide exposure to PM.
Ozone is formed in the atmosphere by reactions between its precursor substances, VOC and NOX. It is also depleted by reactions with numerous substances including scavenging by NO.
Spatial and Temporal Variation of Ozone Concentrations
Given the complexities of ozone distribution in metropolitan areas, there is a need to determine areas of maximum ozone concentrations by conducting an ozone analysis that considers local sources of precursors, ozone sinks, regional concentrations and meteorology, site elevation and topography.
Following below are several factors known to influence large-scale spatial variation of ozone distribution in metropolitan areas; these factors can also help to identify locations where human health and natural resources could be at risk. This information can be used to optimize future monitoring networks.
Because ozone is a secondary pollutant, maximum ozone concentrations usually occur 3 to 5 hours after maximum precursor emissions and under conditions of light winds, usually downwind of the urban region. Average wind speeds of 5 km/hr would mean the greatest ozone concentrations would typically show up 15 – 25 km downwind to the major sources of ozone precursors
.
Higher ozone concentrations can occur at upwind sites when regional concentrations are greater than urban concentrations, at higher elevation sites, and in areas where topography and synoptic meteorological conditions are conducive to intrusion of stratospheric ozone into the troposphere.
Lowest ozone concentrations in a metropolitan area typically occur in the urban centre and in locations near ozone precursor sources. Mid-range concentrations typically occur in neighbourhoods and locations surrounding the urban centre.
Community-oriented measurements are best suited to characterize area-wide exposure levels and the associated population health impacts. Control strategies designed to achieve CWS levels should be aimed at the highest ozone concentrations in a metropolitan area. Therefore, stations designed to measure the maximum ozone concentration in metropolitan areas should be located downwind of precursor source locales on days when the ozone CWS is exceeded or days when conditions are expected to be conducive to ozone formation. For some communities maximum ozone levels may be recorded upwind of the urban core due to ozone scavenging. Neighbourhood or urban-scale stations are appropriate for this objective.
It is important to determine the siting requirements to measure the highest representative ozone concentration in metropolitan areas. Although maximum ozone concentrations, due to the urban sources,
Ambient Air Monitoring Protocol for PM2.5and Ozone 12 ozone concentrations within the urban boundaries to which highly populated areas may be exposed. This is particularly relevant to communities in which only one station is used for CWS achievement determinations.
4.3.2 Regional Transport/Background Stations
There are two significant regional influences that may be taken into account when determining CWS achievement. First, some areas of Canada are highly impacted by transboundary air pollution; second, high background levels of PM and ozone from natural sources and events occur occasionally throughout the year.
Regional transport/background monitoring is used to determine the upwind concentration of PM2.5 and ozone for communities that may be significantly influenced by pollution from transboundary source regions or high background levels. Regional scale stations are typically appropriate for this objective. The GDAD provides the following recommendations regarding the siting of regional transport and background monitors for demonstrating transboundary influence and high background levels.
Transboundary Influence
Jurisdictions should identify one or more monitoring sites upwind of the non-compliant community in question, located between the community and the major source area that may be affecting it.
In the case of a community adjacent to the Canada – U.S. border or a border with another province/territory, the measurement site may have to be at a near-border location within the community, upwind of the community core. Similarly, for a community on the shores of a border water body, the measurement site should be sited within the community near the shoreline, upwind of the community core.
Jurisdictions should measure PM2.5 (including chemical speciation for major inorganic ions as a minimum), ozone and local winds at this site using standard methods accepted by the National Air Pollution Surveillance (NAPS) Monitoring Network or the Canadian Air and Precipitation Monitoring Network (CAPMoN).
If it is likely that precursor pollutants are being transported from the upwind jurisdiction and are contributing to PM2.5 or ozone levels in the community, then jurisdictions should measure ambient concentrations of NO, all oxidized nitrogen compounds (NOY), NH3, SO2 and VOC (including speciation).
Influence from Background or Natural Events
Jurisdictions should identify one or more monitoring sites upwind of the non-compliant community in question and in a location that is not downwind of any major anthropogenic source area.
Depending on the pollutant in question, jurisdictions should measure PM2.5 (including chemical speciation for major inorganic ions as a minimum), ozone and local winds at this site using standard methods accepted by NAPS or CAPMoN.
Jurisdictions should also measure ambient concentrations of VOC, including isoprene and terpenes. Isoprene is a primary precursor of ozone, and terpenes are important precursors of the organic component of PM2.5.
Additional regional or background monitors may also be sited to extend the geographical coverage beyond the areas represented by CWS reporting sites for both the transboundary region between Canada and the United States and for background/trends information.
4.3.3 Chemical Speciation/Precursor Stations
The goals of chemical speciation/precursor monitoring are to:
assess trends in PM mass components and gaseous precursor concentrations;
identify specific source contributions in airsheds;
track the effectiveness of control strategies;
provide input to air quality models and analyses;
improve PM and ozone sampling and monitoring strategies;
provide information for health impact studies.
measure overall progress of air pollution control programs.
Stations will normally be collocated with PM2.5and/or ozone monitors; the scale of representativeness will therefore vary accordingly.
4.3.4 Special Studies Stations
In general, Special Studies sites are sites where intensive monitoring is done across a wide range of atmospheric constituents. The goal of such monitoring is to further develop the science and technology underpinning of the CWS. These sites contribute additional information that could strengthen policy development and program management for PM and ozone.
Special Studies sites can encompass a wide variety of measurement programs and might focus on characterizing emission sources and transformation products, validating model outputs, improving or inter-comparing measurement methods, or understanding health and environmental impacts. These sites would likely undertake speciation of PM2.5samples.
Spatial representativeness of Special Studies sites could vary considerably, depending on specific issues being investigated, and sites may not necessarily be community-oriented.
Vehicle traffic emissions, including exhaust components and re-suspended road dust, can represent an important and sometimes predominant local source contributor of CWS-related parameters in large urban areas. This can affect both the magnitude and variability of urban air pollutant levels, particularly near high traffic routes. Associated assessments are likely best accomplished by special studies, whereas long-term CWS siting, which maintains a distance from specific roadways, should strive to account for collective contributions from this and other urban sources.
4.4 Site Selection
The selection of sites to meet the network objectives is based on the requirements for distribution, location, separation and spatial scale of representation (refer to Section 4.2).
Ambient Air Monitoring Protocol for PM2.5and Ozone 14 sites. Rural monitoring networks include background and regional transport sites that may also comprise chemical species and gaseous precursors, and special studies sites.
Along with addressing the overall monitoring objectives, the site selection process needs to take the following practical factors into consideration:
reliable electric power source
accessibility throughout the year
security of the site from unauthorized access and vandalism
specifications for sampling shelter and inlet probe installation
possible interference from local sources and plume dispersion effects
4.4.1 Urban Networks
Distribution
The CWS achievement determination requires that the reporting areas (RA) be based on the census metropolitan areas (CMA) and census agglomerations (CA). Larger CMAs (populations >500,000) may be further divided into reporting sub-areas (RSA). Guidance for establishing RA and RSA boundaries is detailed in Section 2 of the GDAD. Although some reporting areas may select more than one monitoring station to report average concentrations of particulate matter, most communities may select a single urban station to report maximum ozone concentrations.
Location
For specific monitoring requirements, a site is selected to provide the most representative air quality information to the population of a given RA or RSA. When a small number of monitoring stations are planned for a community or reporting area, subjective methods are often employed such as: the selection of one site each in industrial, commercial and residential neighbourhoods; or the NAPS (EC, 1988) Station Classification and Distribution Criteria (see Table 4 below). The NAPS criteria were used initially to select urban monitoring locations. Many of these locations remain as monitoring sites today. New or additional NAPS sites are now selected on the basis of the NAPS Quality Assurance and Quality Control Guidelines (2004) in consultation with network agencies to produce air quality data representative of the geographic area of interest. For larger networks, a more objective method of design may be required. Munn (1981) defines two basic methods for network design: a statistical method and a modelling method.
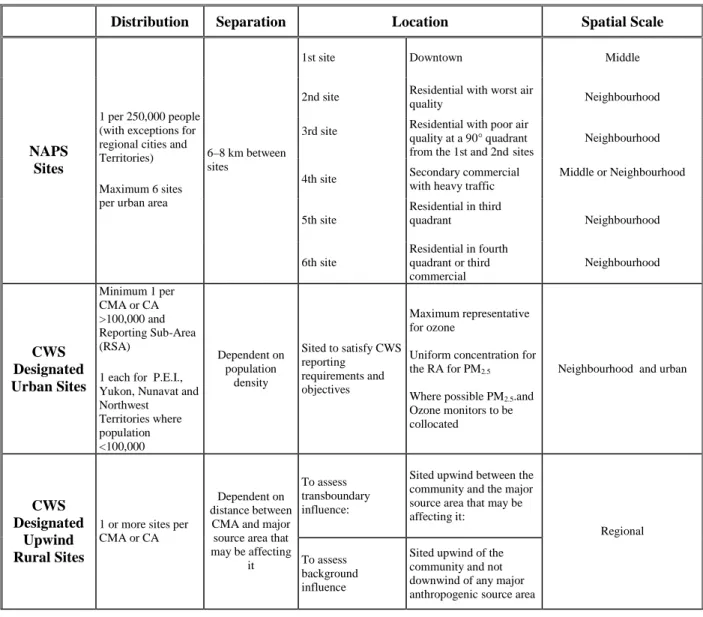
Table 4: NAPS Network Station Classification and Distribution Criteria
Distribution Separation Location Spatial Scale
1st site Downtown Middle
2nd site Residential with worst air
quality Neighbourhood
3rd site Residential with poor air quality at a 90° quadrant from the 1st and 2nd sites
Neighbourhood
4th site Secondary commercial with heavy traffic
Middle or Neighbourhood 5th site Residential in third quadrant Neighbourhood NAPS Sites 1 per 250,000 people (with exceptions for regional cities and Territories)
Maximum 6 sites per urban area
6–8 km between sites 6th site Residential in fourth quadrant or third commercial Neighbourhood CWS Designated Urban Sites Minimum 1 per CMA or CA >100,000 and Reporting Sub-Area (RSA)
1 each for P.E.I., Yukon, Nunavat and Northwest Territories where population <100,000 Dependent on population density Sited to satisfy CWS reporting requirements and objectives Maximum representative for ozone
Uniform concentration for the RA for PM2.5
Where possible PM2.5.and Ozone monitors to be collocated
Neighbourhood and urban
To assess transboundary influence:
Sited upwind between the community and the major source area that may be affecting it:
CWS Designated
Upwind Rural Sites
1 or more sites per CMA or CA
Dependent on distance between CMA and major source area that may be affecting
it To assess background influence
Sited upwind of the community and not downwind of any major anthropogenic source area
Regional
The basis of the statistical method is that urban air pollution measurements are correlated either in time at the same location, or in space with other monitors in the network. Networks are optimized by examining time series correlations from long measurement records, or spatial correlations among measurements from nearby monitors. This method presupposes the existence of a monitoring network from which the time and space correlation fields can be estimated.
The basis for the modelling method is that dispersion of pollution can be predicted, to a certain extent, from knowledge of emission characteristics and the meteorological fields. Modelling results can be used to site monitors in locations that meet specific criteria such as the location of maximum concentration or the location of the most frequent exceedance of threshold values. This method requires a reasonable knowledge of the spatial variation of sources and meteorology.
NAPS Guidelines for locating monitors in an urban area identify sites as residential, commercial and industrial. In many instances, existing NAPS sites should be applicable to CWS monitoring objectives and
Ambient Air Monitoring Protocol for PM2.5and Ozone 16
Urban PM
2.5Locations
For urban PM2.5 monitoring, a CWS reporting station or stations should preferably be located within the populated community area and with consideration of conditions and/or surroundings (see also Table 4) such as:
residential or commercial locales where outdoor activities typically exist (e.g., vicinity of school, park, etc.);
at least one centralized site in the vicinity of the populated downtown and/or suburban area;
generally open flat area(s) with structural similarity and absence of nearby multiple high-rise buildings in at least three relevant directional quadrants;
appropriate distances from heavy industrial activity, major arterial traffic routes and other major primary particulate emission sources.
It is recognized that such site areas may not necessarily coincide with maximum particulate concentrations within the urban area (which typically occur closer to specific emission sources), but should reflect airshed concentration ranges and temporal trends to which widespread populated areas may be exposed in conjunction with the community activities. Since even small nearby sources can inordinately affect measured levels, it is important to ensure adequate distances from localized sources.
For confirming the suitability and satisfactory positioning of an existing NAPS station, the site location and associated data should be reviewed with considerations such as:
the existing site is located within the confines of the CMA spatial domain (based on map overlays) and in the vicinity of a major population centroid (as a means to examine the extent of any urban changes since original monitor installation);
the site continues to meet NAPS siting criteria (to address any changes in obstructional encroachment such as new buildings or nearby tree growth);
the site is generally downwind of urban activities based on long-term prevailing wind conditions and pollutant roses;
the particulate concentration data are not disproportionately affected by very localized source emission rates. This can generally be assessed by determining inter-station statistical correlations, and examining the consistency of diurnal patterns and pollution roses, as well as other site data evaluations, where available (e.g., intercomparative particulate species information).
The designated site data should be, as much as possible, representative of the collective urban source particulate contributions, as well as concentrations transported into the reporting area, as opposed to reflecting emission rate influences from a single stationary source and/or a specific roadway (which could change over time). In designating sites for some areas, it may be useful to consider applying a site acceptance criterion that has been used as a screening procedure in a U.S. monitoring network (U.S. EPA 1994), but with specific modifications. For example, consideration should be given to either additional site evaluations or a site move in cases where an individual upwind local source, within a defined radius (e.g., 3 km) and predominant wind direction (e.g., 30% frequency) contributes more than 10% of the measured average PM2.5concentration at the existing site. Since used in a different type of application, this type of approach would require knowledge or an estimate of the local source emission rates as well as an evaluation of the numerical coefficients for the screening criterion. It must be recognized that very limited information is currently available to consider siting requirements addressing potential locally generated secondary particulate matter.
In areas where existing NAPS sites are considered by jurisdictions to be unsuitable for CWS reporting requirements and/or new sites might be desired, site selection should be done using information such as:
finely gridded or otherwise spatially-resolved primary particulate emission inventory data for the urban area, including point source data (e.g., NPRI or other information) and estimated area, mobile and open source data (allowing for location of relevant emission sources and gridded emissions with temporal resolution, where necessary);
projected land use information for the urban area, especially for major traffic routes;
application of dispersion models, and/or wind rose data in conjunction with relevant long-term meteorological data, to identify a monitoring locale within a populated area that may be subject to predicted elevated daily concentrations.
As an alternative, short-term monitoring within the community could be considered for comparison of resulting data with the existing NAPS site. One approach might be to use portable particulate monitors (e.g., GRIMM or other) to determine spatial concentration patterns within the community over appropriate time intervals, achieving sufficient duration to allow for statistical comparisons. This would facilitate site selection, provided local source influences and pertinent meteorological conditions were also accounted for in the short-term monitoring design.
Similar considerations apply for ozone monitoring but at least one monitor in large metropolitan areas should be located at the representative maximum concentration locale of a CWS reporting area within the urban perimeter. Usually this location is at the downwind location of the reporting area. Wherever appropriate, ozone and PM2.5monitors for CWS reporting should be collocated.
Urban Ozone Locations
There are several factors to consider in siting ozone monitors that are intended to capture maximum urban ozone concentrations within population centres, including:
the locations of precursor source emissions within the community that can locally generate as well as scavenge ozone;
general directions from which transported ozone (generated from external source emissions) may enter the community;
the prevailing morning and afternoon wind vectors for the locale in relation to source areas, especially on high temperature humid days, during both the smog and other seasons;
the presence of a large water body bordering the urban area (over which transported ozone may tend to accumulate) in conjunction with a populated shoreline;
highest ozone concentrations might be expected during synoptic stagnation conditions when both local and distant sources contribute to the levels.
Consideration should be given to reviewing data for the existing NAPS sites, which may be designated for CWS ozone reporting in each CMA, including aspects such as:
wind directions, from long-term meteorological data and/or wind roses for the specific CMA areas, in relation to NOX/VOC source locations and site alignment, especially for afternoon periods on days that are conducive to ozone formation. The site should be considered acceptable if located somewhat downwind of the urban sources, including the perimeters of the urban boundary, provided it also meets other relevant criteria noted below;
examine average diurnal patterns for the site ozone concentrations to evaluate consistency and/or any abnormal features (e.g., traffic influence);
verify the site is within populated areas of the CMA boundaries using map overlays including land use planning maps, where available;
Ambient Air Monitoring Protocol for PM2.5and Ozone 18
records of NO and O3 concentrations for the site with consideration of further site evaluations if ozone levels are consistently <30 ppb (i.e., as a reported indicator of local source O3scavenging such as NO titration) (U.S. EPA 1998);
site acceptance criterion, with respect to ensuring minimized local source influences, such as that used in a U.S. photochemical air monitoring network site selection guideline (U.S. EPA, 1998). For example, further evaluations of the existing site acceptability should be considered if individual localized upwind source precursor emissions contribute greater than 10% of the measured annual average ozone concentration.
In instances where an alternative ozone station is considered necessary, site selection could consider additional information such as:
finely gridded or otherwise spatially-resolved NOXand speciated VOC emission inventory data for the urban area with seasonal and diurnal temporal resolution;
a compilation of identified or expected days when high ozone concentrations are either known or likely to occur in conjunction with a wind rose for afternoon hours (1:00-4:00 pm) on the high O3days. The site should then be positioned within a populated section of the reporting area which is downwind of the highest precursor emission area;
computerized photochemical air quality modelling could also be considered, where feasible, to predict the maximum downwind ozone concentrations, but would likely require significant resources to compile both the emission and meteorological inputs;
alternative methods could be used such as short-term O3 monitoring (e.g., passive sampling and analysis) at multiple locations within the community during a series of high ozone concentration days for comparison with the existing station data (U.S. EPA, 1998).
Separation
Separation distances between stations are dependent on population density of the area. Stations are deployed to give the most accurate measurements representing the air quality of the area. Usually this is in the order of 6 to 8 kilometres for urban locales. Such spatial scales and separation distances are more applicable to gaseous and very fine particulate matter, which are often relatively homogenously distributed and spatially dispersed within airsheds, than some other parameters. This type of fairly uniform distribution is recognized by rationalization of sites for some components within the U.S. national ambient air monitoring strategy (U.S. EPA 2005). However, greater variability between sites often occurs for the coarser fractions of particulate matter due to the presence of more localized source impacts. This might require either middle-scale measurements or special study characterizations to accurately represent urban coarse particle distributions.
4.4.2 Rural Networks
Distribution
Regional transport/background monitoring is used to determine the upwind concentration of PM2.5 and ozone from communities that may be significantly influenced by pollution from transboundary source regions or high background levels. Factors such as prevailing meteorology, geography and proximity to transboundary source regions will be used by jurisdictions to determine the number of upwind monitoring stations required.
Rural monitoring sites should be located upwind of the non-compliant community in question. In addition, for assessing the transboundary influence these sites should be located between the community and the major source area that may be affecting it. For assessing the background influence, rural sites should not be downwind of any major anthropogenic source area. Analytical tools such as back trajectory models, pollution roses and modelling can be used to select the most appropriate areas for locating these monitors.
4.5 Sampling System
The proper design of the sampling system in a monitoring station is crucial. The temperature stability of the shelter, the location of the sampling probe, the design of the manifold system, the length and material of transfer lines, and the filters and fittings all affect the integrity and true representation of the air sample and the resulting data quality.
4.5.1 Shelter Requirements
Analyzers are housed inside secured buildings or shelters with restricted access to the public. The shelter must be ventilated, heated and cooled to maintain a stable temperature in the range of 20 to 30°C throughout the year. It must have good lighting and a reliable electric power supply. Telecommunication service should be available for telemetry and voice communications. An ABC class fire extinguisher and a first aid kit must be furnished in the shelter for emergency situations.
4.5.2 Probe Siting Criteria
The siting of air sample inlet probes strongly influences the quality of monitoring data. Table 5 summarizes the NAPS requirements according to the class designation of the monitoring stations and their scale of representation. Table 6 specifies the minimum distance from roadways for O3and NO2analyzers. The site criteria specified are to be followed as closely as possible to ensure uniform data collection. The following considerations apply to the siting of probes:
1. Probe height
2. Probe distance from roadways and other sources 3. Probe distance from airflow restrictions
4. Probe distance from trees
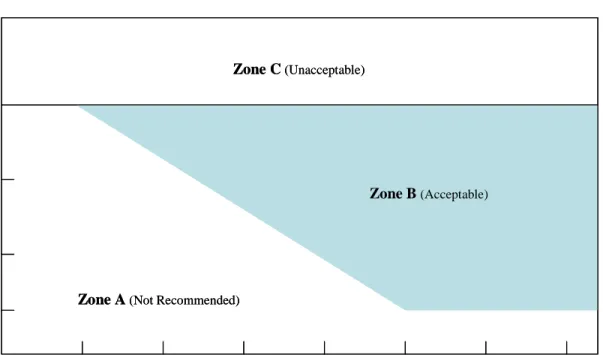
Sites must meet the criteria for probe height for each pollutant being monitored. For PM2.5monitoring, the probe (sample inlet) height should be positioned within the range of 2-15 metres above ground level and in accordance with specifications, pertaining to distance from roads, indicated in Figure 2. Although actual inlets will physically differ, a similar probe height range is applicable to O3monitoring along with roadway distance specifications related to traffic volume. Deviations from the road distance criteria are examined individually in relation to the monitoring objectives for the site. It should be recognized, however, that for neighbourhood and urban scale of representation, all probe location criteria must be met. This requirement would include all CWS reporting sites.
Once the general station siting is selected, specific location criteria applicable to ambient air quality monitoring probes and monitoring paths need to be determined. The specific siting criteria are pollutant-specific and may vary based on the spatial scale of representativeness. Some of the key considerations in determining specific site selection include the following (Table 5).
Ambient Air Monitoring Protocol for PM2.5and Ozone 20
Table 5: NAPS Network Sample Probe Siting Criteria
Distance from Supporting Structure (metres) Pollutant (Scale) Height Above Ground (metres) Vertical Horizontal1
Other Spacing Criteria
2 to 15 >2 a. > 20 m from trees
b.
Distance from the sampler to any air flow obstacle (i.e. buildings) must be >2 × height of obstacle above the sampler
c. Unrestricted air flow in 3 of the 4 wind quadrants d. No nearby 2 furnace or incineration flues Particulate Matter: TSP, PM10, PM2.5 (Middle, Neighbourhood and Urban Spatial Scales) e.
Distance of sampler from roads varies with the height of the sampler from the ground as depicted in Figure 2
a. 15–100 km from large city b.
100 m from nearest major highway (50,000 v/d)
40 m from nearest traffic c. 20 km from tree canopy
Particulate Matter (Regional Scale)
d. Avoid low-lying areas subject to drainage flows.
3 to 15 >1 >1 a. >20 m from trees
b.
Distance from the sampler to any air flow obstacle (i.e. buildings) must be >2 × height of obstacle above the sampler
c. Unrestricted air flow in 3 of the 4 wind quadrants d. No nearby 2 furnace or incineration flues. SO2 (Middle, Neighbourhood and Urban Spatial Scales) e.
Probe height must be >0.8 of the mean height of surrounding buildings
3 to 5 >1 >1 a. >10 m from street intersections or at mid-block location
CO (Middle Scale)
b. 2–10 m from roadway 3 to 10 >1 >1 a. >35 m from street curb side
CO
(Neighbourhood and
Urban Scale) b.
Unrestricted air flow in 3 of 4 wind directions
Distance from Supporting Structure (metres) Pollutant (Scale) Height Above Ground (metres) Vertical Horizontal1
Other Spacing Criteria
b.
Distance from the sampler to any air flow obstacle (i.e. buildings) must be >2 × height of obstacle above the sampler
c. Unrestricted air flow in 3 of the 4 wind quadrants
O3
(Neighbourhood and Urban Spatial
Scales)
d. Spacing from roadway varies with road traffic as specified in Table 4 a. 30–100 km from large city b.
250 m from nearest major highway (10,000 v/d)
20 m from nearest roadway (1,000 v/d)
c. 20 km from tree canopy d. Avoid NOXsources
e. Avoid low lying areas subject to drainage flows
O3
(Regional Scale)
f. Location on top of a small hill is desirable
3 to 5 >1 >1 a. >20 m from trees
b. 10 m from street intersection or at mid-block location NO2 (Middle Scale) c. >2–10 m from roadway 3 to 15 >1 >1 a. >20 m from trees b.
Distance from the sampler to any air flow obstacle (i.e. buildings) must be >2 × height of obstacle above the sampler
c. Unrestricted air flow in 3 of the 4 wind quadrants
NO2
(Neighbourhood Scale)
d. Spacing from roadway varies with road traffic as specified in Table 4 Notes:
1. When a probe is located on a rooftop, this separation distance is in reference to walls, parapets, or penthouses located on the roof.
2. Distance depends on the height of furnace or incinerator flues, type of waste or fuel burned, and quality of fuel (sulphur and ash content). This is to avoid undue influences from nearby sources.
Horizontal and Vertical Placement of the Probe
Criteria such as population exposure, spatial scales of representativeness, location of the supporting structure, protection from vandalism and prevailing wind direction need to be considered in determining the