TOWARDS A WEB BASED SIMULATION ENVIRONMENT Peter Lorenz Heiko Dorwarth Klaus-Christoph Ritter Thomas J. Schriber Faculty of Informatics
Institute for Simulation and Graphics (ISG) Otto von Guericke University of Magdeburg (UMD)
D-39106 Magdeburg, GERMANY
School of Business Computer and Information Systems
The University of Michigan Ann Arbor, Michigan 48109-1234, U.S.A.
ABSTRACT
Existing Simulation and Animation (S&A) software tools are typically platform dependent and do not particularly lend themselves to cooperative work within either the Internet or an Intranet. This paper describes:
• Basic approaches toward achieving Web compliance for S&A software; and
• Specific components for potential use in an open, platform independent simulation environment for the Internet or for corporate Intranets.
Requirements for a Web Based Simulation Environment (WBSE) are also discussed.
1 INTRODUCTION
The current information technology (IT) revolution is dominated by the Internet. Global and intra-corporate access, platform independence, maintenance minimiza-tion, reusability and interoperability are among the sig-nificant aspects and requirements. These present chal-lenges for all fields of IT application.
How will the simulation community take advantage of these developments? When will S&A systems become available within Web browsers? Can we expect to find complete S&A environments in the Web? Does the Web offer new opportunities for S&A applications? Do we have new ideas for including S&A models in a Web based cooperative work environment? When will the first virtual S&A modeling school and the first virtual S&A service provider incorporate and appear in the Web?
These are some questions for which no one currently has definitive answers. An objective of this paper is to provide partial answers to some of these questions.
In section 2 we present some contexts for platform independent S&A Web applications. In section 3 we classify several alternative S&A approaches to the Web. Section 4 describes the embedding of simulation software into the Web, using GPSS/H as an example. Section 5 reports on using a business graphic tool for presentation
of simulation results in the Web. Finally, Section 6 pres-ents the architecture and the user interfaces for the Java based 2D Animation tool, Skopeo.
2 S&A WEB APPLICATION CONTEXTS
In the following subsections we present two existing and two hypothetical contexts for S&A Web applications. 2.1 Web Support for an S&A Course
Since 1995 the students attending an S&A course at the University of Magdeburg (UMD) have been provided with complete Internet-based information support. This support includes:
• Lecture Notes with hypertext functionality;
• Executable GPSS/H (Henriksen and Crain 1998) simulation models; and Skopeo (see the Web site ref-erence given in Section 6) and Proof Animation (Wolverine Software, 1996) animation models; and • Assignments and Quizzes.
The advantages of this support system are its global availability and its platform independence. The students have easy access to the Web-based information and can do their homework on any Web client. For details, see:
http://isgnw.cs.uni-magdeburg.de/~pelo/sim1d/sim1.htm.
2.2 Canal and Lock System in the Web
The Canal-and-Lock system is a “challenge” simulation problem published in the Comparison series of
EUROSIM (Schriber 1996). Its objective is to force use of various simulation techniques and tools for modeling complex logic and control structures. Furthermore, vari-ance reduction methods are to be implemented to support statistical analysis of system performance. The Canal-and-Lock problem can be found at:
http://eurosim.tuwien.ac.at/sne/.
Figure 1 (lower left hand corner) shows a static snap-shot from a simulation of the Canal-and-Lock system, which consists of a left canal, the lock, and a right canal
1338
and is used by barges moving from left to right or vice versa. This reference problem and the corresponding model provide the basis for our initial WBSE study: The study has the objective of implementing Web support for various phases of a simulation project. The phases in-clude these:
• Input data acquisition; • Control strategy selection; • Model experiment definition; • Control parameter optimization; • Storing and presentation of results; and • Process visualization through 2D Animation.
Details about the current state of the study can be found at:
http://www.cs.uni-magdeburg.de/~seibt/labor/parameter.html.
2.3 Providing Simulation Service
Web compliant S&A software can support various modes of cooperation between a simulation service provider and a simulation customer.
1. In one mode, the service provider can offer an S&A software warehouse (models and tools) on his Web server(s). Customers can work with modified models or models of their own, prepared on their Web cli-ent(s). The models can run applets on the client ma-chine or on the service-provider’s server (with the re-sults then being pushed to the client).
2. In an alternative mode, the service provider can build a customized model and carry out a complete simula-tion study. The customer has Web-based access to the
model at all steps of the simulation study. He partici-pates actively in the model design, in the debugging and the validation stage and uses Web-based anima-tion tools for evaluaanima-tion purposes. He is able to exe-cute his own model experiments by changing pa-rameter values in an HTML data-entry form and starting experiments on the provider’s Web server. He has Web-based access to a database containing all re-sults of the experiments.
2.4 Cooperative Problem Solving
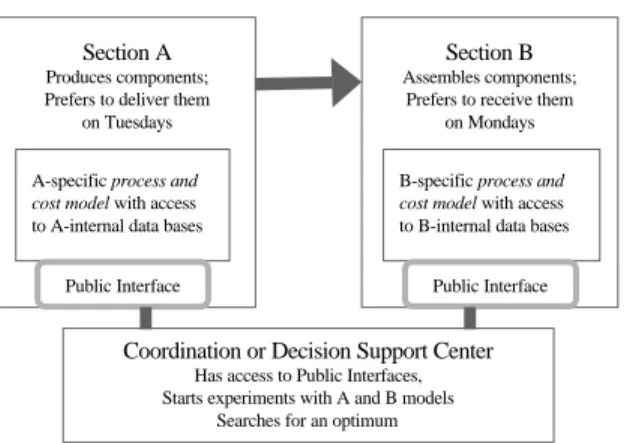
This hypothetical scenario illustrates possibilities for a cooperative undertaking in modeling a manufacturing chain. Figure 2 describes the relationship between two sections in a factory that provides the basis for the sce-nario.
In the scenario, section B produces final products, using parts delivered by section A. If A delivers to B too early, additional storage costs arise in B. If A delivers to B too late, B has to pay a lateness penalty to the final customer. There is usually a delivery date that would be optimal for section A but not section B, and vice versa. Section A incurs additional costs for meeting an earlier Figure 1: Skopeo Animation with its Control(left side, embedded into the WWW-browser) and Visualization (right
delivery date and incurs storage costs for using a later delivery date.
Section A Produces components; Prefers to deliver them
on Tuesdays
Section B Assembles components;
Prefers to receive them on Mondays
Coordination or Decision Support Center Has access to Public Interfaces, Starts experiments with A and B models Searches for an optimum A-specific process and
cost model with access to A-internal data bases
B-specific process and cost model with access to B-internal data bases
Public Interface Public Interface
Figure 2: Decision support with distributed models This seems to be a classic warehousing problem. The traditional solution is to work with a common model for both sections. A network based solution allows experi-ments with two internal section-specific models with public interfaces and hidden, private data bases that can only be viewed by each section internally. In this example a coordination center with access to the public interfaces can run experiments and look for a compro-mise.
3 BASIC APPROACHES
This section describes three approaches for simulation and animation in the Web.
3.1 Remote S&A
In remote S&A (see Figure 3), the user specifies values of parameters for a simulation model in an HTML data-entry form, submits the form to a server and starts the simulation by pushing the START-button on the form. A Common Gateway Interface (CGI) is used to transfer the data to the server. A CGI script starts the simulation after the data have been received.
Internet WWW-Server WWW-Client Simulator 1. Parameters 2. Simulatio n start 3. Results 3 3 1 2
Figure 3: Remote S&A and data transfer
When the simulation has finished, the CGI-script prints the results (including the URL of files that have been created to show results) in a new HTML page and trans-mits it back to the client. This technique is called dy-namic document generation.
The remote S&A approach is suitable for existing S&A software. It is not well qualified for observing dynamic processes at work and does not allow the user to interrupt a running simulation, because the server sends the results only at completion, or at predetermined points in time. 3.2 Local S&A Based on Loading Applets
In local S&A based on loading applets (see Figure 4), the user loads a Java simulation applet into the Web-browser, which then runs the simulation on the client machine. This approach supports the incorporation of user interaction and animation into the simulation applet. Existing simulation and animation tools are not suitable for this approach. Suitable tools should be able to create S&A models as applets.
Internet
WWW-Server
WWW-Client
1. Call for a n applet
2. Downloa d th e applet
3. Run th e apple t and sho w results
2
1
3
Figure4: Client-Site simulation with loaded applets
3.3 Animation and Manipulation using a Java Data Server
This S&A approach, pictured in Figure 5, was introduced by Berger and Leiner (1997). It uses a WWW- and-Java server. Internet WWW- and JAVA-Server WWW-Client
Simulator 1.2. Callin g the WWW-Server Configuratio n and downloa d applets 3. Server - clien t connection
4. Simulatio n contro l and results 3
1
2 4
Figure 5:Remote Simulation and Local Visu-alization
The simulation runs remotely on a simulation server. The results are transferred to the client and visualized locally. The user begins by loading some applets. After these applets have started, a connection to the Java server is built and simulation data are transmitted to the Web browser. The data can change continuously, delayed only by the executing simulation model and transmission time on the Internet.
The user can interact with the model by using buttons on the HTML page or by clicking into a graphical repre-sentation of the model.
4 SIMULATORS IN THE WEB
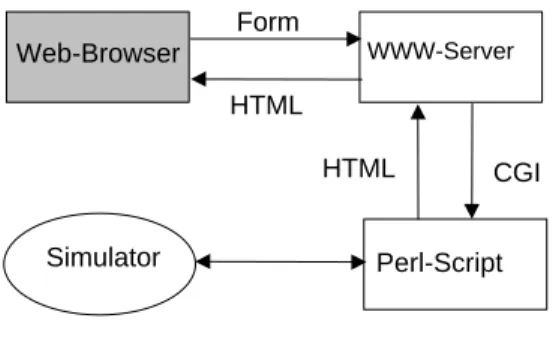
Among the central components of a Web-Based Simula-tion Environment are interfaces to simulators. Figure 6 shows how one such interface, the Common Gateway Interface (CGI), can be used to support the transfer of data from an HTML-page across the network and the starting of a CGI-script on a server. CGI scripts using the transferred data are commonly written in PERL, as sug-gested in Figure 6, but other programming languages could be used, too.
Using a simulator with the CGI-interface for simulation on the Web is possible only if the simulator supports two properties:
1. It must be possible to start the simulator from a com-mand line. PERL scripts can not “simulate” the “pushing of a button” in a GUI. The simulator must support com-mand lines like:
system(’gpssh modelfilename’) 2. The simulator has to be able to accept the simulation model and simulation parameters as a file and has to be able to write simulation results into a file, which the CGI interface can return to a Web-page. The user puts his model or model parameters into a FORM container on an HTML page. A FORM usually provides some INPUT and TEXTAREA containers. For example,
<INPUT NAME=“time” VALUE=“0” SIZE=“8”>
Web-Browser WWW-Server Simulator Perl-Script Form HTML CGI HTML
Figure 6: CGI-based Web Connection for a Simulator
describes an data input field with a default value of zero and a size of 8 characters. If the user writes the number
333 in this field and presses the START button the CGI interface transfers the data to the server in the form
name=value&name=value ... or in our example
time=333
Then the script is started on the server. The ACTION at-tribute in the FORM tag tells the server which script is to be used:
<FORM METHOD=POST
ACTION="http://simsrv.cs.uni-magdeburg.de/cgi-bin/test">
The first part of the script splits the name/value pairs and puts the simulation model or parameters into a file.
For each $pair (@pairs) { ($name,$value) = split(/=/,$pair); $FORM{$name} = $value; } $arriveTime = $FORM{'time'}; chdir "/tmp"; open(PFILE,">params"); select(PFILE); printf("%f",$arriveTime); close(PFILE);
After this is done, the script starts the simulator: system ("/usr/local/bin/gpssh model.gps");
Now it is possible to generate the resulting HTML page. It will be sent to standard output, from which it is deliv-ered by the CGI interface to the WWW client. It is possible to show graphical representation of the results using Gnuplot or external programs. The follow-ing section describes a way to include professional busi-ness graphics into a Web-page.
5 PRESENTATION OF GRAPHICAL RESULTS
This section discusses a proposed prototype for an S&A environment component that uses a special approach for presentation of information graphically. This prototype is part of the GraphIt tool that has been developed by Marco Schumann, a PhD student at the ISG. (See the Web site reference further below in this section).
The intention of the GraphIt project is to investigate opportunities for using existing business graphics tools on the Internet. Using existing tools significantly reduces development time because complex business graphics capabilities do not need to be reinvented or repro-grammed. The currently implemented prototype takes advantage of the LightLib business graphics library for Borland Delphi developed by DFL Software Inc.
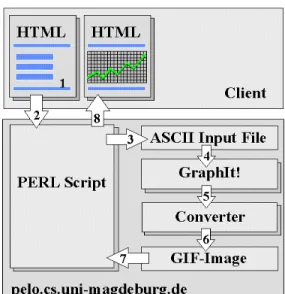
Figure 7: Business Graphics for Simulation Results The solution corresponds to the remote S&A concept discussed in section 4 and can be explained in terms of the following steps, using numbers that correspond to those in Figure 7:
1.
The user enters the data to be graphed in a text area of an HTML form.2.
The data is submitted to the web server using the CGI technique.3.
The Perl script extracts the data from the form and creates an ASCII input file.4.
The GraphIt! utility processes the input file.5.
The results are saved as a TGA (TARGA) image.6.
A converter generates a GIF image.7.
The Perl script generates a resulting HTML page with the embedded image.8.
The HTML page is sent to the client's web browser. The currently implemented version of the visualization component runs independent of any simulator. A detailed description of GraphIt! is available athttp://www.cs.uni-magdeburg.de/~maschuma/GraphIt /GraphIt.html
The data to be graphed have to be written in a TEXTAREA
of an HTML form. The following text gives an impres-sion of the Graphit!-interface which is used in this
TEXTAREA:
Title: Distributions’ Frequencies Dimension:3D Grid:10,2 Legend:OnBest,Uniform,Normal Type:Bar X-Axis:Class Y-Axis:Frequencies Data:1,9,0 ...
This description can be generated by a simulation pro-gram:
http://isgnw.cs.unimagdeburg.de/~pelo/sim1d/sa3/sa39/sa39.htm
6 JAVA-BASED 2D ANIMATION
Skopeo is a Java-based, platform-independent 2D-Animation system. It is currently under development by K.-C. Ritter (ISG). Some examples of Java-based 2D animation can be found at:
http://simos2.cs.uni-magdeburg.de/Skopeo/Ani.html.
Various aspects of Skopeo are discussed in the following subsections.
6.1 The Reference System vs. Skopeo
The reference system for web-based Skopeo is Proof AnimationTM. Like other trace driven animation systems, Skopeo uses a Layout File to describe the animation background and a Trace File to define object movement.
In the current version of Skopeo, an enlarged set of Proof Layout commands is used to describe the layout. The Trace command-set format of Skopeo is more com-pact than in Proof.
Skopeo extends Proof in some ways, however, in-cluding the following:
• In addition to Proof's Layout elements (Lines, Arcs, Messages, Text), Skopeo supports true color back-ground bitmaps and ellipses.
• Skopeo uses Hershey fonts to provide platform-independent textual output. These fonts have the ad-vantage of an identical look on each platform and a great variety of available fonts.
• Skopeo supports accelerated object movement. The local coordinate system concept of Proof has been enhanced. This enables the system to support relative object movement and Paths as Class components. • Existing Proof Animation Layout and Trace files can
be translated into Skopeo files by using special REXX
based scripts.
• Because of its modularity, Skopeo is open for differ-ent Trace command sets and Trace sources. By using this Skopeo feature it is possible to adapt animations from alternative animation sys-tems.
• A real-time data collection capability is under devel-opment for Skopeo.
• VRML-based 3D Animation for simulation models and simulated processes is a natural extension of Skopeo as described above. A prototype is under construction.
6.2 Architecture of Skopeo
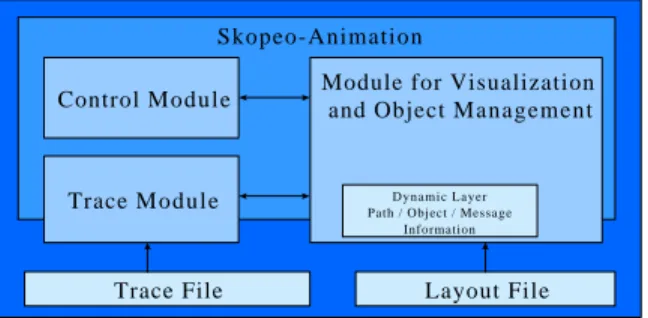
Skopeo is built in a strictly modular form, as shown in Figure 8. The modularity is encouraged by the object oriented attributes of Java. During the implementation of Skopeo, Java's multithread capabilities have been used.
Java provides support for multiple threads of execution that can handle different tasks.
Today's architecture of Skopeo is a compromise with respect to the runtime problems of recent Java environ-ments. To compensate for the runtime problems on the client side, Skopeo initiates an animation-specific code optimization before loading to the server. This shifting permanently saves resources on the client side by using resources on the server side. To enable this optimization, Skopeo's structure contains three components or layers: • The static layer (including a user defined or standard
Control Module, a Module for Visualization and Object Management, and a Trace Module for differ-ent Trace languages);
• The dynamic layer (including Animation Class in-formation, which is loaded by Skopeo at runtime be-cause a previous code optimization on the server side improves performance.); and
• The animation files (including Layout files, Trace files and background bitmaps).
Trace File Layout File Skopeo-Animation
Control Module
Trace Module
Module for Visualization and Object Management
Dynamic Layer Path / Object / Message
Information
Figure 8: Architecture of Skopeo with Control- and Data Flows
The components are defined by their characteristics. The static layer is not subject to variation and has to be loaded with each animation. The dynamic layer depends on the specific animation model. It contains model-specific information about Classes, Paths and Messages. 6.3 Inserting an Animation into HTML Pages Skopeo can be started as a local application or in the Web, but its primary use is in the setting of integration into Web pages.
The typical method for running Skopeo is to do so from an HTML page. In this case the HTML page must con-tain the following lines:
<applet code=SkopeoControl.class width=550 height=170>
<param name=bundleid value=Canal&Lock> </applet>
These lines link a standard or a user defined control module to the page in the form of an individual applet. The module contains all control elements that the user needs to control the animation. The parameter
Bun-dleid guarantees that if more animations are on the same HTML page, every control module finds the corre-sponding visualization module.
The following lines link a visualization module to the page.
<applet code=Skopeo.class width=300 height=200>
<param name=bundleid value=Canal&Lock> <param name=model value=canal>
<param name=modelURL
value=http://simos2.cs.uni-magdeburg.de/Skopeo/canal/> </applet>
The model parameter determines the name of the
model that is loaded at Skopeo runtime. The home URL of the model is named by the modelURL parameter. 7 CONCLUSION
The Web-Based Simulation Environment is an idea rather than a project. A WBSE should promote and spread simulation and animation techniques, tools and models thanks to platform independence and global ac-cess. It should support all the traditional steps making up a simulation study. It should promote and support dis-tributed, simulation-supported cooperative problem solving.
Some prototypes of WBSE components presented here illustrate both opportunities and difficulties that lie along the road leading to a Web-Based Simulation Environ-ment.
REFERENCES
Berger, M., and U. Leiner. 1997. Remote Visualisieren und Manipulieren von Simulationen im Internet. In Proceedings of Simulation and Animation ’97 Mag-deburg, 1-11. Society for Computer Simulation Europe, Ghent, Belgium.
Fishwick, P.A. 1996. Web-Based Simulation: Some Personal Observations. In Proceedings. of the 1996 Winter Simulation Conference, 772-779. Society for Computer Simulation, La Jolla, California.
Henriksen, J.O. and R.C. Crain. 1998. GPSS/H Refer-ence Manual, 4th Edition. Wolverine Software Corpo-ration, Annandale, Virginia.
Lorenz, P., and K. C. Ritter. 1997 Skopeo: A platfor-Independent System Animation for the W3. In Pro-ceedings of Simulation and Animation ’97 Magde-burg, 12-23. Ghent, Belgium: Society for Computer Simulation Europe
Lorenz, P., and T. J. Schriber. 1996. Teaching Introduc-tory Simulation in 1996. In Proceedings. of the 1996 Winter Simulation Conference, 1379-1386. La Jolla, CA Society for Computer Simulation
Schriber, T. J. 1996. Comparison 8: Canal-and-Lock-System. In EUROSIM - Simulation News Europe, 16, 29-32. ASIM, Vienna, Austria.
Wolverine Software Corporation. 1996. Getting Started with Proof Animation. Wolverine Software Corpora-tion, Annandale, Virginia.
AUTHOR BIOGRAPHIES
HEIKO DORWARTH works as a graduate research assistant in the Institute for Simulation and Graphics at the Otto von Guericke University of Magdeburg. His areas of research include the modeling of manufacturing systems and applications on the World Wide Web. PETER LORENZ is a Professor in the Institute for Simulation and Graphics. He teaches discrete simulation, computer animation, and graphics. His research interests include layout-based simulation model generation, ad-vanced Web supported teaching concepts and applica-tions of simulation and animation in manufacturing, logistics and traffic.
KLAUS-CHRISTOPH RITTER is a Ph.D. student in the Institute for Simulation and Graphics. His current research area is platform independent animation and simulation supported by the use of World Wide Web technologies.
THOMAS J. SCHRIBER is a Professor of Computer and Information Systems at The University of Michigan. He is a Fellow of the Institute of Decision Sciences and is the 1996 recipient of the INFORMS College of Simula-tion distinguished Service Award. He teaches decision analysis and discrete-event simulation in Michigan’s MBA program.