i
Mining Time-aware Actor-level Evolution Similarity
for Link Prediction in Dynamic Network
Faculty of Engineering and Information
technology
Nazim Ahmed Choudhury
Submitted in fulfilment of the requirements of the degree
Doctor of Philosophy August 2018
iii
Abstract
Background
Topological evolution over time in a dynamic network triggers both the addition and deletion of actors and the links among them. A dynamic network can be represented as a time series of network snapshots where each snapshot represents the state of the network over an interval of time (for example, a minute, hour or day). The duration of each snapshot denotes the temporal scale/sliding window of the dynamic network and all the links within the duration of the window are aggregated together irrespective of their order in time. The inherent trade-off in selecting the timescale in analysing dynamic networks is that choosing a short temporal window may lead to chaotic changes in network topology and measures (for example, the actors’ centrality measures and the average path length); however, choosing a long window may compromise the study and the investigation of network dynamics. Therefore, to facilitate the analysis and understand different patterns of actor-oriented evolutionary aspects, it is necessary to define an optimal window length (temporal duration) with which to sample a dynamic network.
In addition to determining the optical temporal duration, another key task for understanding the dynamics of evolving networks is being able to predict the likelihood of future links among pairs of actors given the existing states of link structure at present time. This phenomenon is known as the link prediction problem in network science. Instead of considering a static state of a network where the associated topology does not change, dynamic link prediction attempts to predict emerging links by considering different types of historical/temporal information, for example the different types of temporal evolutions experienced by the actors in a dynamic network due to the topological evolution over time,
iv
known as actor dynamicities. Although there has been some success in developing various methodologies and metrics for the purpose of dynamic link prediction, mining actor-oriented evolutions to address this problem has received little attention from the research community. In addition to this, the existing methodologies were developed without considering the sampling window size of the dynamic network, even though the sampling duration has a large impact on mining the network dynamics of an evolutionary network. Therefore, although the principal focus of this thesis is link prediction in dynamic networks, the optimal sampling window determination was also considered.
Method
Considering the trade-offs in selecting the time scale with which to sample a dynamic network, as described above, this thesis developed a novel approach to determine an optimal sliding window by considering a variance analysis of network positional evolutions experienced by the actors in the dynamic network. The determination of an optimal time-scale was followed by calculations of three different actor-level dynamicities (structural, neighbourhood and community) in an optimally sampled dynamic network. Computing the similarity between a pair of actors is an intuitive and dominant solution to the problem of link prediction. Therefore, similarities between the actor-level evolutions experienced by a pair of actors were computed to measure the likelihood of future link formation between them. Three methods were used to compute evolutionary similarity: dynamic time warping, cross-correlation and the Bray-Curtis ecological similarity). Another dynamic feature was developed by considering evolutionary community-aware network structural information in dynamic networks. In a supervised dynamic link prediction setup, a total of nine dynamic similarity metrics/dynamic features were used for
v
the purpose of dynamic prediction to determine if evolutionary similarity between actor-pairs can measure the likelihood of future link formation between those pairs.
Result
By exploiting actor-level evolutionary network-positional information, this study developed a novel algorithm to discretise dynamic networks. The rationale behind using actor-level measures was that choosing an actor-level measure would create an equilibrium distribution of actor-level network activities over time. The algorithm developed could work in the absence of any actor-level attributes, was applicable to any size of network regardless of size and actor count and was also computationally inexpensive. Different validation methods were proposed to test the optimality of the identified window. The algorithm was found to be effective in all types of networks with any kind of candidate temporal window sizes.
The dynamic features constructed by computing the similarities of micro- and meso-level evolutionary aspects of actors were also found persuasive in the dynamic link prediction task. Considering a list of evolutionary similarity-based features, it was observed that they perform better than the existing prediction methodologies used in static networks and time series-based dynamic link prediction methods. Further, it was found community-aware evolutionary information is advantageous in the task of predicting dynamic links. Furthermore, although both similar and dissimilar actors participate in future links in regard to their evolution similarity, actors with a positive correlation between their evolutionary aspects have better chances of forming emerging links. In relation to the different performance metrics used in this thesis, it was found that these features are not only suitable for the dynamic link prediction task (for example,
vi
predicting the purchasing patterns of online customers, the growth of terrorist networks, etc.) but that they can also be used to understand the underlying network growth effectively.
Conclusion
In network science, it is intuitively presumed that similar actors form links among themselves. Considering the impact of similarity on link formation, this study computed the evolutionary similarities between different types of actor-level dynamicity measures. Since the rate of evolutions depends on optimal sampling of the corresponding dynamic network irrespective of network structure, neighbourhood and community, it is imperative to define the optimal sampling duration for the dynamic network. It was also observed that dynamic similarity metrics/dynamic features constructed in optimally sampled network snapshots perform well in prediction tasks when used in a supervised link prediction model for dynamic networks.
vii
Acknowledgement
With this lodgment of my Ph.D. thesis, my doctoral research journey is about to reach its endpoint after years of relentless work, hustling days and sleepless night. I start by thanking my almighty Allah, the most merciful and most gracious. I am thankful to HIM for not only giving me the opportunity to pursue a research degree but also, giving me the strength and patience to enduring and finally reaching a destination. In this inexorable journey, I remember to miss my daughter, Tazmia’s birthdays, my son, Hassan’s birthdays, failed to accompany them during their overseas visit and support their mother in all related issues. I am grateful to them for their patience and perseverance during these years and hope one day I can repay my debt and make them happy.
Although, it was not easy for me, and at times, I was about to leave it being demoralized; however, few people encouraged me a lot. Among them, I should first express my sincere gratitude towards Dr Pierre Rognon and Dr Shahadat for their support, motivation, and cooperation that they have extended. Along with them, I am also indebted to Dr. Li Liu and Dr. Mahendra Piraveenan, head and panel member of my annual Ph.D. performance review panel, for their valuable support and constructive feedback. My gratitude to A/Professor Javid Atai, the associate dean of research education, knows no bounds for his support during the review process. I am simultaneously grateful not only to those who inspired me but also to those who dissuade me on this journey. I wish to acknowledge the editing service provided by Dr. Nicole Smits, a research scientist at the Norris Cotton Cancer Center, Geisel school of medicine at Dartmouth and Ms. Belinda Glynn (MA Grad Dip Editing & Publishing). Their quick and prompt proof-editing services and important feedback are highly appreciable.
viii
I want to thank all the office staffs at the University of Sydney - Maria, Daniela, Lorraine, and Jinping for their tremendous support. I also met few fellow researchers and cheerful friends during my doctoral journey. Nazmul, Navid, Abdullah, Nur and Fattha were to name a few in my regular contacts and it was a pleasant experience for all of us to share the positive and negative sides of our research life together. In the end, I want to thank my family – my mother, father, sister, and brother for their constant support. I am also thankful to my extended family members, my uncles, aunties, cousins, and in-laws, especially my sister-in-law Shanu who provided excellent assistance during the time of this thesis writing. This Ph.D. thesis would not be possible without all of your support and inspiration. To my wife, daughter, and son, words will fail to express my gratitude; however, big thank you from the core of my heart for all you have gone through in the last six months. To all my friends and families, wish you many happy returns for your love and support!
Nazim Ahmed Choudhury 1st August, 2018
ix
Articles published arising from this thesis
1. Choudhury. N, Uddin. S, (2017) Evolution Similarity for Dynamic Link Prediction in
Longitudinal Networks. In: Gonçalves B., Menezes R., Sinatra R., Zlatic V. (eds) Complex Networks VIII. CompleNet 2017. Springer Proceedings in Complexity. Springer, Cham, pp 109-118.
2. Choudhury, N., & Uddin, S. (2017). Mining Actor-level Structural and Neighborhood
Evolution for Link Prediction in Dynamic Networks. Paper presented at the Proceedings of the 2017 IEEE/ACM International Conference on Advances in Social Networks Analysis and Mining 2017 ASONAM, Sydney, Australia.
3. Choudhury N., Uddin S. (2018) Evolutionary Community Mining for Link Prediction in
Dynamic Networks. In: Cherifi C., Cherifi H., Karsai M., Musolesi M. (eds) Complex Networks & Their Applications VI. COMPLEX NETWORKS 2017. Studies in Computational Intelligence, vol 689. Springer, Cham
4. Uddin, S., Choudhury, N., Farhad, S. M., & Rahman, M. T. (2017). The optimal window size for analysing longitudinal networks. Scientific Reports, 7(1).
5. Choudhury, N., Uddin, M. (2016). Time-aware link prediction to explore network effects on temporal knowledge evolution. Scientometrics, 108(2), 745-776
x
Book Chapter published related to this thesis
1. Uddin, S., Choudhury, N., Piraveenan, M., & Chung, K. S. K. (2017). Exploring Actor-level Dynamics in Longitudinal Network: The State of the Art. In R. Alhajj & J. Rokne (Eds.), Encyclopedia of Social Network Analysis and Mining (pp. 1-17). New York: Springer
xi
Posters presented related to this thesis
1. Time-aware Network Structural Similarity Measured for Link Prediction in
Longitudinal Networks, 1st Australian Social Network Analysis Conference’ 2016, Swinburne University of Technology, Victoria, Australia.
2. Evolution Similarity for Dynamic Link Prediction in Longitudinal Networks. Paper presented at the 8th Workshop on Complex Networks CompleNet, Duvrovnik, Croatia 3. Complex Knowledge Networks for Scientific Foresight, Research Conversazione’ 2015,
Faculty of Engineering and Information Technology, The University of Sydney, Sydney, Australia
xii
Other articles and abstract not related to this thesis
1. Khan, M., Uddin, M., Choudhury, N., (2015). Fear, Criticism and Awareness – Understanding Sentiment Propagation during the 2014 Ebola Outbreak from Social Media Data, in the 6th International Conference on Social Media and Society (Abstract Only)
2. Khan, M., Choudhury, N., Uddin, M., Hossain, L., Baur, L. (2016). Longitudinal trends in global obesity research and collaboration: a review using bibliometric metadata. Obesity
Reviews, 17(4), 377-385
3. Ahmed, M., Choudhury, N., & Uddin, S. (2017). Anomaly Detection on Big Data in
Financial Markets. Paper presented at the Proceedings of the 2017 IEEE/ACM International
Conference on Advances in Social Networks Analysis and Mining 2017 ASONAM, Sydney, Australia
4. Shahbazi, M., Choudhury, N., Shahbazi, M., & Bunker, D. (2018). Predicting Opinion
Leaders in Large Scale Enterprise Online Social Networks. Paper presented at the IADIS
xiii
PUBLICATION STATEMENT (FOR THESIS CHAPTER 3 and 7)
xiv
Dedication
To my mum, Sharifunnessa
Begum, for everything she
did for us, her blessings, and
what she went through in her
life. I wish all your
happiness, Ma.
xv
Table of Contents
Page No
1.Research Motivation, Objectives, & Thesis Organisation
1.1 Introduction 2
1.2 Background 3
1.2.1 Networks 3
1.2.2 Network Topology 4
1.2.3 Network Communities 4
1.2.4 Static and Dynamic Networks 5
1.2.5 Link Prediction 7
1.2.6 Dynamic Link Prediction 7
1.3 Applications of Dynamic Link Prediction 8
1.3.1 Recommender Systems 9 1.3.2 Security Systems 9 1.3.3 Biological Systems 9 1.3.4 Scholarly Systems 10 1.3.5 Communication Systems 10 1.3.6 Social Systems 10
1.4 Statement of the Problem 11
1.4.1 Research Motivation 12
1.4.2 Research Objectives 15
1.4.3 Problem Formulation 18
1.5 Research Questions 21
1.5.1 Optimal Sampling of Dynamic Networks 22
1.5.1.1 Research Issue 22 1.5.1.2 Research Questions 22 1.5.1.3 Methods 22 1.5.2 Actor-level Dynamicity 23 1.5.2.1 Research Issue 23 1.5.1.2 Research Questions 23 1.5.2.3 Methods 23
1.5.3 Dynamic Similarity Metrics 23
xvi 1.5.3.2 Research Questions 24 1.5.3.3 Methods 24 1.6 Thesis Organisation 25 1.6.1 Chapter 2 25 1.6.2 Chapter 3 25 1.6.3 Chapter 4 27 1.6.4 Chapter 5 27 1.6.5 Chapter 6 27 1.6.6 Chapter 7 27 1.6.7 Chapter 8 27 1.6.8 Chapter 9 28 2. Literature Review 2.1 Introduction 30
2.2 Temporal Scale in Dynamic Networks 32
2.2.1 Motivation and Background 32
2.2.2 Related Work 33
2.2.3 Challenges and Limitations of Temporal Sampling Method 36
2.3 Dynamic Link Prediction 37
2.3.1 Dynamic Link Prediction in Homogeneous Network 40
2.3.1.1 Matrix Factorization 41
2.3.1.2 Statistical Model 43
2.3.1.2.1 Probabilistic Generative Models 43
2.3.1.2.2 Other Probabilistic Models 44
2.3.1.2.3 Statistical Relational Models 45
2.3.1.2.4 Probabilistic and Matrix Factorisation 46
2.3.1.3 Machine Learning Model 47
2.3.1.4 Temporal Measure 50
2.3.1.4.1 Univariate Temporal Sequence 50
2.3.1.4.2 Network Structural and Topological Metrics 51
2.3.1.4.3 Temporal Communities/Cluster 52
2.3.1.4.4 Time-aware Features 54
2.3.1.4.5 Temporal Probabilistic 57
2.3.1.5 Actor-oriented Measure 58
2.3.1.6 Other Methods 60
2.3.2 Dynamic Link prediction in Heterogeneous Networks 61 2.3.3 Challenges and Limitations in Dynamic Link Prediction Strategies 62
xvii
2.4 Conclusion 65
3.Optimal Time Scale in Dynamic Networks
3.1 Introduction 69
3.2 Actor-oriented Positional Evolution 74
3.2.1 Degree Centrality 78
3.2.2 Closeness Centrality 79
3.2.3 Betweenness Centrality 80
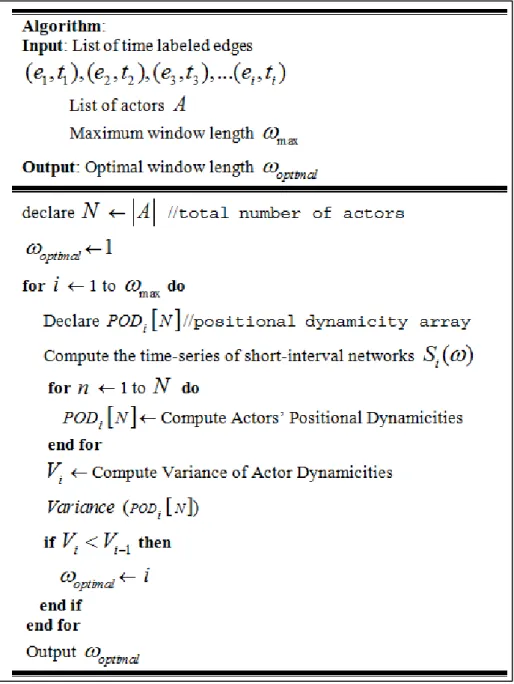
3.3 Proposed Algorithm 80
3.3.1 Determining Window Size 81
3.3.2 Step One 81
3.3.3 Step Two 82
3.4 Evaluation 84
3.4.1 ARIMA Model 84
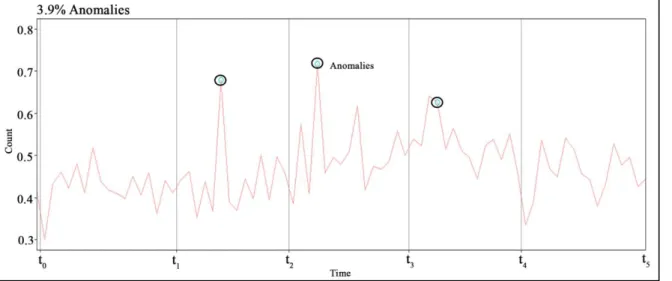
3.4.2 Time Series Anomaly Detection 86
3.4.3 K-means Clustering 88 3.5 Conclusion 90 4. Actor-oriented Evolution 4.1 Introduction 94 4.2 Actor Dynamicity 95 4.2.1 Structural Dynamicity 98 4.2.2 Neighbourhood Dynamicity 103 4.2.3 Community Dynamicity 105 4.3 Conclusion 109
5. Evolution Similarity & Feature Engineering for Dynamic Link Prediction
5.1 Introduction 112
5.2 Dynamic Similarity metrics/Dynamic Features 113
5.2.1 Temporal Similarity 115
5.2.2 Correlation-based Similarity 119
5.2.3 Dynamicity Abundance-based Similarity 121
5.2.4 Temporal Community-aware Network Structure 123
5.2.4.1 Peripheral Actors 125
5.2.4.2 Bilateral Links 125
5.2.4.3 Actor Connectivity 126
5.3 Conclusion 128
6. Datasets and Experimental Settings
xviii
6.2 Network Datasets 131
6.3 Supervised Link Prediction 134
6.4 Performance Evaluation 138
6.5 Conclusion 141
7. Optimal Temporal Scale in Dynamic Networks: Empirical Results 144
7.1 Introduction 145
7.2 Determination of Optimal Time Scale 145
7.2.1 Optimal Window Size 146
7.2.2 Optimal Window Size Validation 153
7.3 Conclusion 160
8. Supervised Dynamic Link Prediction: Empirical Results
8.1 Introduction 163 8.2 Preambles 163 8.3 Classifiers 166 8.3.1 Bagging 166 8.3.2 Random Forest 167 8.3.3 Logistic Regression 168 8.4 Results 168 8.4.1 Classifiers Performances 168 8.4.2 Feature Importance 176
8.4.3 Comparison with Static Predictor 180
8.4.4 Comparison with Time Series Link Prediction 181
8.5 Dynamic Feature Distribution 182
8.6 Concluding remarks 187
9. Discussion and Conclusion
9.1 Discussion 191
9.2 Research Contribution 193
9.2.1 Optimal Sampling of Dynamic Network 194
9.2.1.1 Research Question 194 9.2.1.2 Research Contribution 194 9.2.1.3 Research Question 196 9.2.1.4 Research Contribution 196 9.2.2 Actor-level Dynamicity 196 9.2.2.1 Research Question 196 9.2.2.2 Research Contribution 196 9.2.2.3 Research Question 197
xix
9.2.2.4 Research Contribution 197
9.2.3 Dynamic Similarity Metrics 197
9.2.3.1 Research Question 197 9.2.3.2 Research Contribution 197 9.2.3.3 Research Question 198 9.2.3.4 Research Contribution 198 9.2.3.5 Research Question 199 9.2.3.6 Research Contribution 199 9.2.3.7 Research Question 199 9.2.3.8 Research Contribution 199 9.2.3.9 Research Question 200 9.2.3.10 Research Contribution 200 9.3 Conclusion 200 10.References 203 11.Appendix A 222
xx
List of Figures
Figures Page No
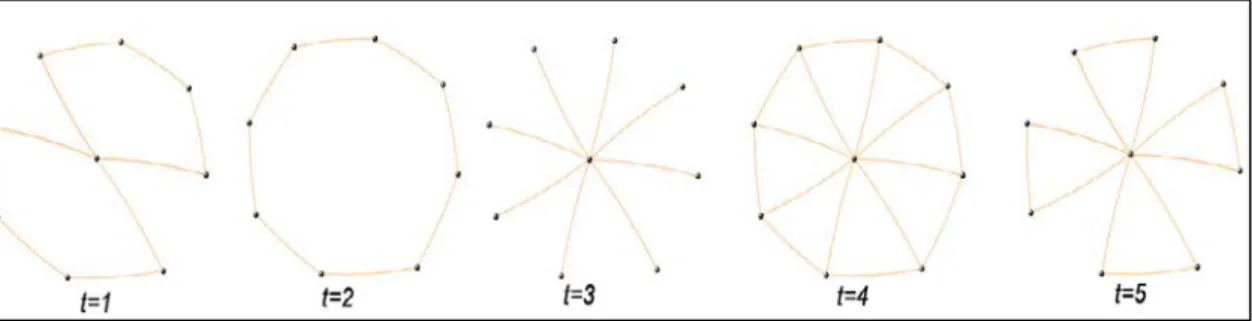
Figure 1.1: An abstraction of a dynamic network in which the state of the network changes over time. Each network snapshot at each individual timestamp is known as a short interval network (SIN).
6
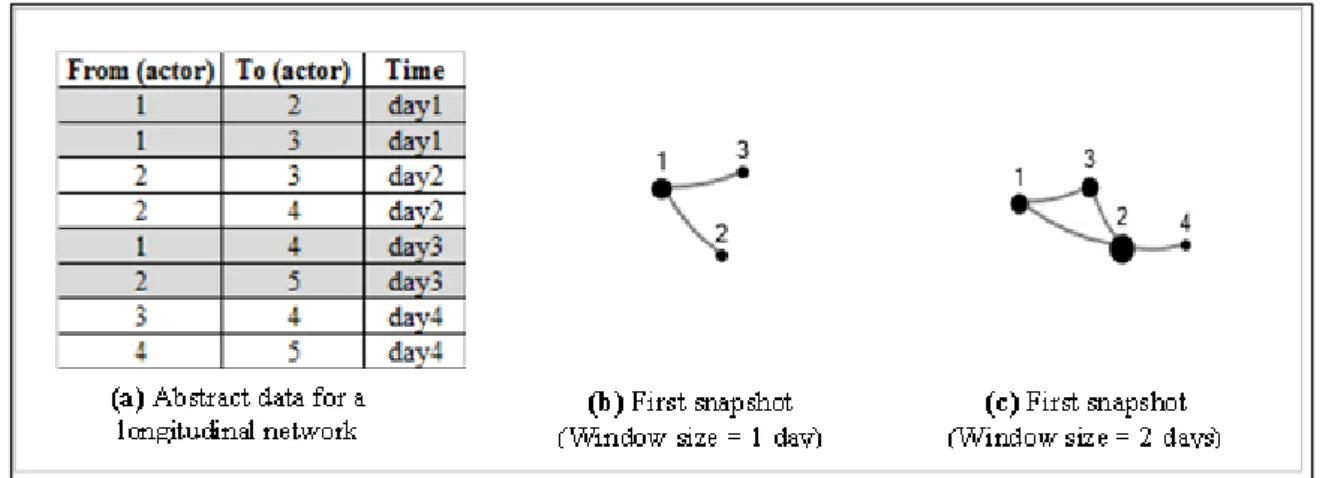
Figure 1.2: Differences in network analysis results of an abstract dynamic network that evolved in four days with the consideration of different window sizes. The sizes of actors are proportionate to their degree centrality values. (a) A list of date-stamped links, (b) first network snapshot considering one day time scale, (c) second network snapshot considering a time scale of two days.
17
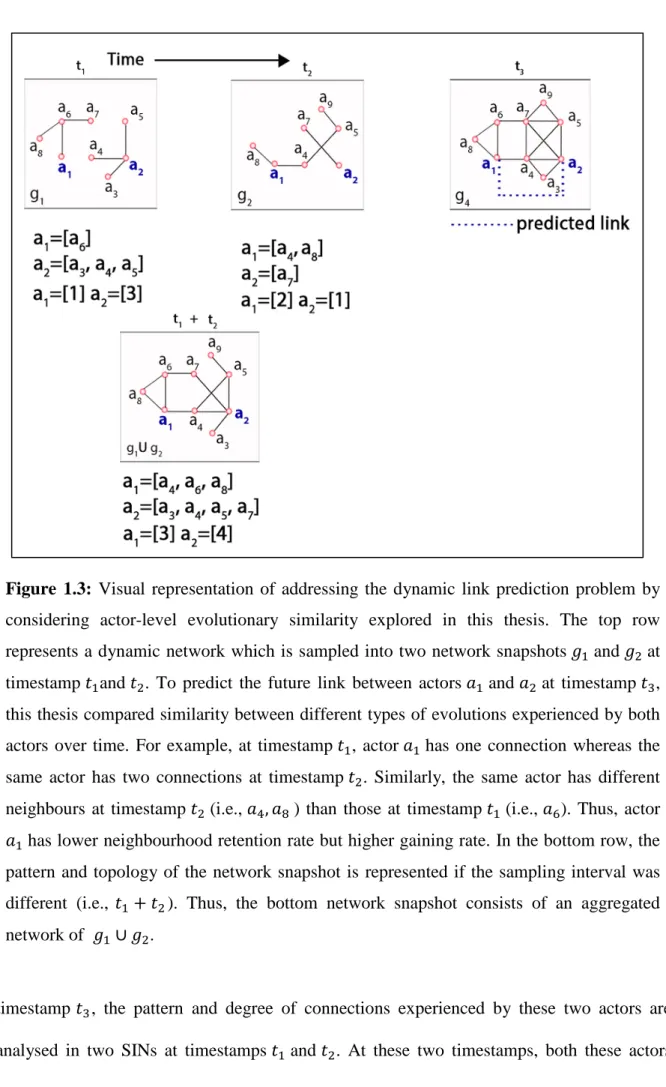
Figure 1.3: Visual representation of addressing the dynamic link prediction problem by considering actor-level evolutionary similarity explored in this thesis.
19
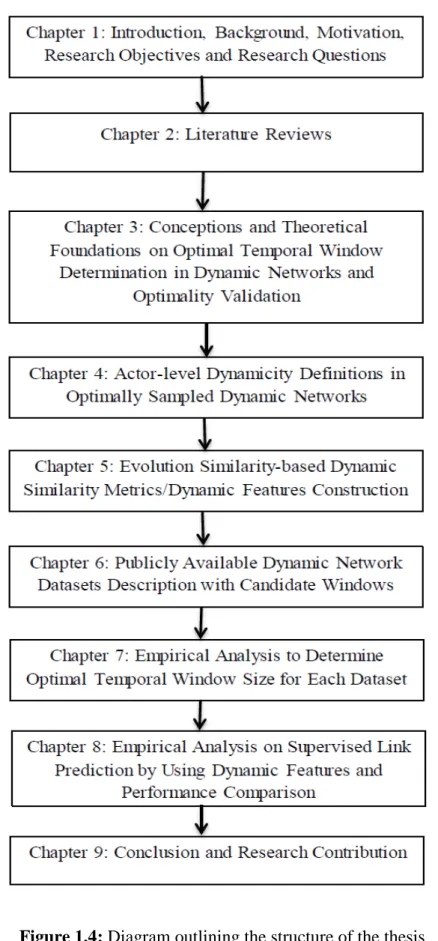
Figure 1.4: Diagram outlining the structure of the thesis 26
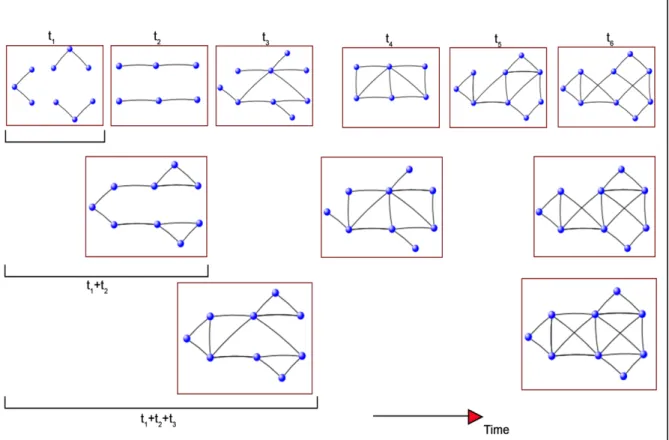
Figure 3.1: An abstract visual representation of a dynamic network that evolved over six timestamps (𝑡𝑡1,𝑡𝑡2,𝑡𝑡3,𝑡𝑡4,𝑡𝑡5,𝑎𝑎𝑎𝑎𝑎𝑎𝑡𝑡6) to demonstrate how a given dynamic network can be described as a collection of multiple network snapshots (i.e., Short Interval Networks, SINs).
70
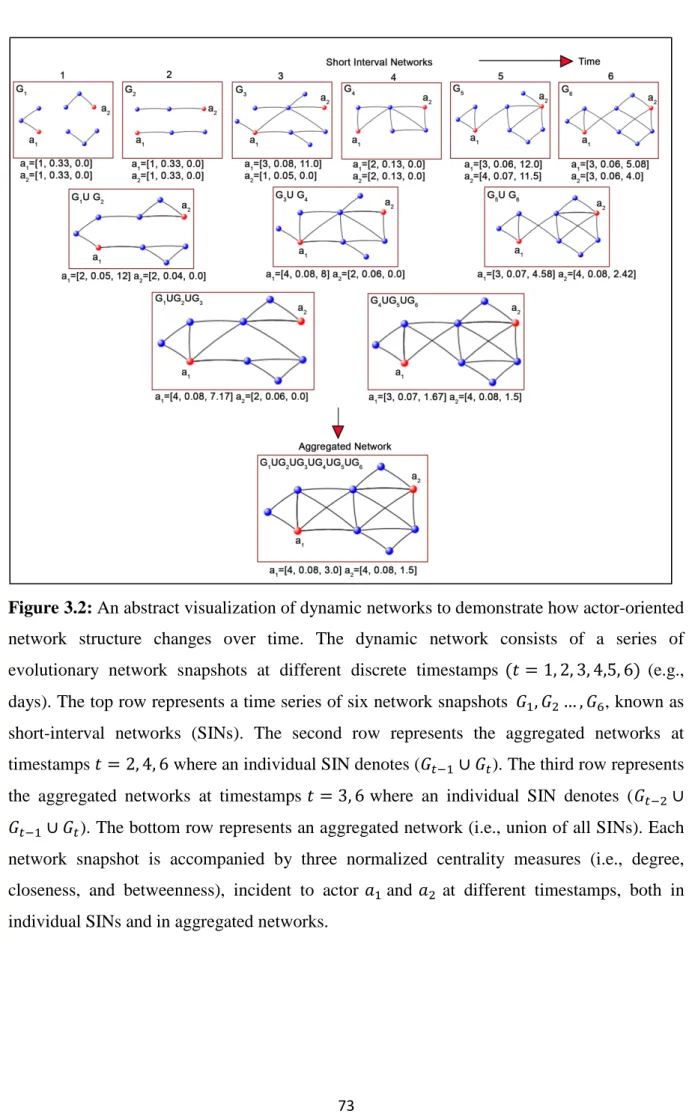
Figure 3.2: An abstract visualization of dynamic networks to demonstrate how actor-oriented network structure changes over time. The dynamic network consists of a series of evolutionary network snapshots at different discrete timestamps (𝑡𝑡=
1, 2, 3, 4,5, 6) (e.g., days).
73
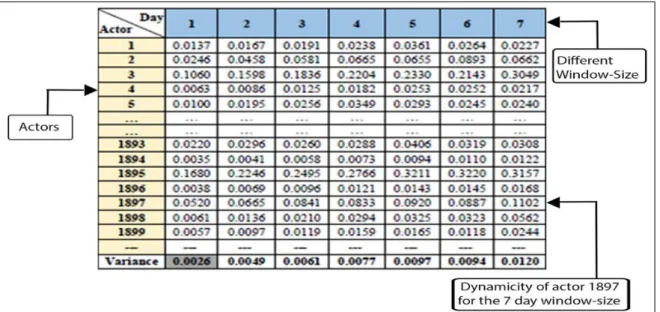
Figure 3.3: An illustration of the changes in variances of positional dynamicity values of actors where three centrality measures (degree, betweenness, and closeness) were considered to quantify an actors’ position in Short Interval Networks (SINs). The time scale duration of each SIN may vary from one day to seven days.
82
Figure 3.5: Percentage of anomalies present in a time series as determined by the Seasonal Hybrid Extreme Studentized Deviate algorithm.
xxi
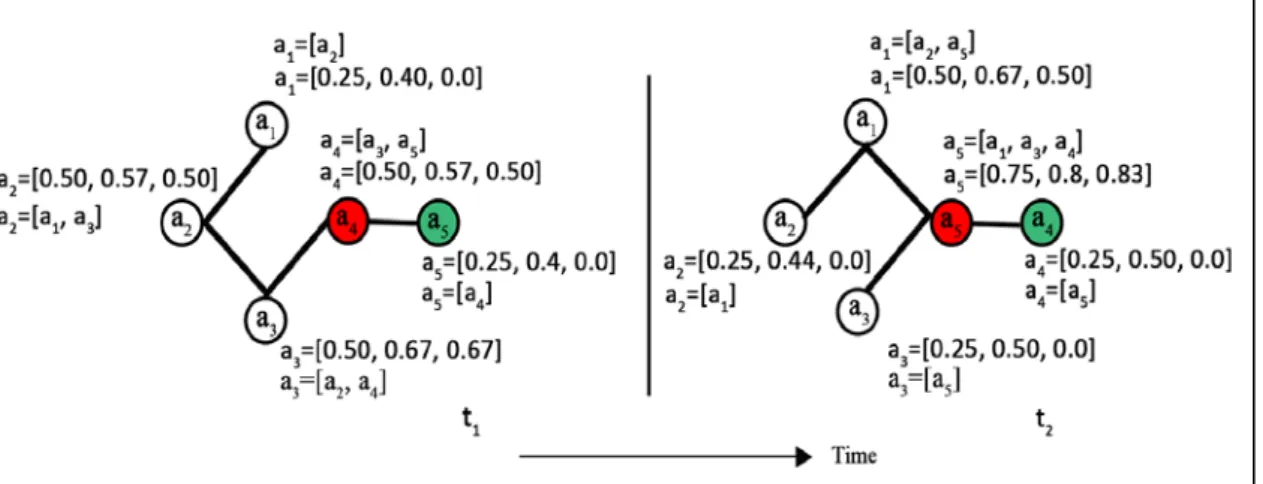
Figure 4.1: Visualization of an actors’ positional and neighbourhood changes in a dynamic network consists of two Short Interval Networks (SINs) at two different timestamps t_1and t_2. All actors are accompanied with their [degree, closeness, and betweenness] centrality measures in the corresponding SIN including their direct neighbourhoods. Actor a_4 and a_5 are coloured red and green to represent how their centrality measures are changed due to their positional changes in the SINs over time.
95
Figure 4.2: Visualization of an actors’ clustering tendency changes in a dynamic network consists of two Short Interval Networks (SINs) at two different timestamps𝑡𝑡1and𝑡𝑡2. Four actors (i.e., 𝑎𝑎1,𝑎𝑎2,𝑎𝑎3, and 𝑎𝑎4) are accompanied with their clustering coefficient values in the corresponding SIN. The sizes and colours of the actors represent their respective degree centrality and communities they belong to.
97
Figure 4.3: An abstract visualization of a dynamic network considering a series of evolutionary network snapshots at different discrete timestamps (𝑡𝑡 = 1, 2, and 3) which is used to metaphorically demonstrate the computation of actor-level structural and neighbourhood dynamicity measures.
102
Figure 4.4: An abstract visualization of a dynamic network comprised of two Short-Interval Networks (SINs) (A) 𝐺𝐺𝑡𝑡1 at time 𝑡𝑡1 and (B) 𝐺𝐺𝑡𝑡2 at time 𝑡𝑡2 and (C) denotes an aggregation of 𝐺𝐺𝑡𝑡1and 𝐺𝐺𝑡𝑡2 (i.e., 𝐺𝐺𝑡𝑡1∪ 𝐺𝐺𝑡𝑡2). Each SIN has three communities that are represented by three different colors and actors within these communities represent the color of the corresponding community. Actors 𝑎𝑎3,𝑎𝑎4,𝑎𝑎10, and 𝑎𝑎12 are accompanied by their clustering coefficient values in 𝐺𝐺𝑡𝑡1, 𝐺𝐺𝑡𝑡2and the aggregated network on the right.
108
Figure 5.1: An abstract visualization of the dynamic link prediction framework considering a series of evolutionary network snapshots at different discrete timestamps (𝑡𝑡= 1, 2, 3 and 4).
114
Figure 5.2: Visualizations of measuring similarity between two temporal sequences (a) traditional approach (b) Dynamic Time Warping (DTW) approach. Dashed lines represent the distance between corresponding points in both time series.
xxii
Figure 5.3: Community-aware network architecture supporting link prediction. The orange-coloured actor 𝒂𝒂𝟔𝟔 is an actor with multiple community memberships. The red-colored actors in each community represent the peripheral actors in each community. Red-colored dotted links denote the bilateral links bridging two communities.
124
Figure 6.1: Standard confusion matrix used in the evaluation of supervised link prediction performance (i.e., binary classification model)
137
Figure 7.1: Visual presentations of the percentage of anomalies present in a time series of positional dynamicity values for every Short Interval Network (SIN). The time series were built for all SINs considering two different window sizes (i.e., time-scales) in 𝐺𝐺𝑀𝑀𝑀𝑀𝑀𝑀, 𝐺𝐺𝑈𝑈𝑈𝑈𝑀𝑀, and 𝐺𝐺𝐸𝐸𝐸𝐸𝐸𝐸𝐸𝐸𝐸𝐸networks.
151
Figure 7.2: Visual presentations of the percentage of anomalies present in the time series of positional dynamicity values for every Short Interval Networks (SINs). The time series were built for all SINs considering two different window (i.e., time-scales) sizes in 𝐺𝐺𝐹𝐹𝐹𝐹, 𝐺𝐺𝑀𝑀𝐼𝐼𝐹𝐹, and 𝐺𝐺𝐻𝐻𝑀𝑀 networks.
152
Figure 7.3: Distribution of the actors’ positional dynamicity values and corresponding clusters of univariate K-means clustering in 𝐺𝐺𝑀𝑀𝐼𝐼𝐹𝐹 network considering a window size of 12 hours (720 minutes) and one hour (60 minutes).
156
Figure 7.4: Distribution of the actors’ positional dynamicity values and corresponding clusters of univariate K-means clustering in the 𝐺𝐺𝐻𝐻𝑀𝑀 network, considering a window size of 1.5 hours (90 minutes) and 8 hours (480 minutes).
157
Figure 8.1: The average performances indicated by three classifiers (i.e., logistic regression, Random Forest, and Bagging) considering three performance metrics (Accuracy %, AUCROC, and AUCPR) in classification datasets. Each Performance metric denotes the average of aggregated performances demonstrated by the three classifiers together considering three performance metrics (Accuracy, AUCROC and AUCPR).
172
Figure 8.2: Visual representation of Precision-Recall (i.e., left column) and ROC curves (right column) of three network datasets 𝐺𝐺𝑈𝑈𝑈𝑈𝑀𝑀 (top row), 𝐺𝐺𝑀𝑀𝑀𝑀𝑀𝑀 (middle row) and 𝐺𝐺𝐸𝐸𝐸𝐸𝐸𝐸𝐸𝐸𝐸𝐸 (bottom row), considering the following features: (i) dynamic features 𝑆𝑆𝑆𝑆𝑆𝑆𝐷𝐷𝐷𝐷𝐷𝐷𝐸𝐸𝐸𝐸𝐸𝐸𝐷𝐷 (ii) topological similarity metric, Resource Allocation (RA) as a static link predictor 𝑆𝑆𝑆𝑆𝑆𝑆𝑅𝑅𝑅𝑅, and (iii) Time series forecasting-based link prediction 𝑆𝑆𝑆𝑆𝑆𝑆𝑆𝑆𝑆𝑆𝐸𝐸𝑆𝑆𝑆𝑆𝑆𝑆.
xxiii
Figure 8.3: Visual representation of Precision-Recall (i.e., left column) and ROC curves (right column) of three network datasets 𝐺𝐺𝑀𝑀𝐼𝐼𝐹𝐹(top row), 𝐺𝐺𝐻𝐻𝑀𝑀 (middle row) and 𝐺𝐺𝐹𝐹𝐹𝐹(bottom row), considering the following features: (i) dynamic features 𝑆𝑆𝑆𝑆𝑆𝑆𝐷𝐷𝐷𝐷𝐷𝐷𝐸𝐸𝐸𝐸𝐸𝐸𝐷𝐷 (ii) topological similarity metric, Resource Allocation (RA) as a static link predictor 𝑆𝑆𝑆𝑆𝑆𝑆𝑅𝑅𝑅𝑅, and (iii) Time series forecasting based link prediction 𝑆𝑆𝑆𝑆𝑆𝑆𝑆𝑆𝑆𝑆𝐸𝐸𝑆𝑆𝑆𝑆𝑆𝑆.
179
Figure 8.4: Distribution of three dynamic feature values in three network datasets 𝑮𝑮𝑯𝑯𝑯𝑯, 𝐺𝐺𝐸𝐸𝐸𝐸𝐸𝐸𝐸𝐸𝐸𝐸, and 𝐺𝐺𝐹𝐹𝐹𝐹 for both positive and negatively-labeled actor-pairs in the corresponding classification datasets. The chosen features are the best performing features in the respective datasets. These are 𝑠𝑠𝑆𝑆𝑆𝑆8ℎ (𝑎𝑎,𝑏𝑏) in 𝐺𝐺𝐸𝐸𝐸𝐸𝐸𝐸𝐸𝐸𝐸𝐸 and 𝑠𝑠𝑆𝑆𝑆𝑆8𝐸𝐸(𝑎𝑎,𝑏𝑏) in 𝐺𝐺𝐻𝐻𝑀𝑀, and 𝐺𝐺𝐹𝐹𝐹𝐹. Both these metrics compute similarity between a pair of actors by considering evolutionary community-aware structural information. The first uses a hierarchical agglomerative, whereas the second uses the Louvain community detection method.
183
Figure 8.5: Binned distribution of three dynamic feature values in three network datasets 𝐺𝐺𝐻𝐻𝑀𝑀, 𝐺𝐺𝐸𝐸𝐸𝐸𝐸𝐸𝐸𝐸𝐸𝐸, and 𝐺𝐺𝐹𝐹𝐹𝐹 for positively-labeled actor-pairs in the corresponding classification datasets. The chosen features are the best performing features in the respective datasets. These include 𝑠𝑠𝑆𝑆𝑆𝑆8ℎ(𝑎𝑎,𝑏𝑏) in 𝐺𝐺𝐸𝐸𝐸𝐸𝐸𝐸𝐸𝐸𝐸𝐸 and 𝑠𝑠𝑆𝑆𝑆𝑆8𝐸𝐸(𝑎𝑎,𝑏𝑏) in 𝐺𝐺𝐻𝐻𝑀𝑀, and 𝐺𝐺𝐹𝐹𝐹𝐹.
183
Figure 8.6: The four best performing correlation-based features in four datasets (i.e., 𝐺𝐺𝐸𝐸𝐸𝐸𝐸𝐸𝐸𝐸𝐸𝐸, 𝐺𝐺𝑈𝑈𝑈𝑈𝑀𝑀, 𝐺𝐺𝑀𝑀𝑀𝑀𝑀𝑀 and 𝐺𝐺𝑀𝑀𝐼𝐼𝐹𝐹). These features measure the similarity between actor pairs by computing correlation between actor-level evolutionary information. 𝑆𝑆𝑆𝑆𝑆𝑆4(𝑎𝑎,𝑏𝑏) denotes the correlation between temporal dynamicity values of actor pairs, whereas 𝑆𝑆𝑆𝑆𝑆𝑆5(𝑎𝑎,𝑏𝑏) denotes the correlation between actor-level neighborhood dynamicity values.
xxiv
List of Tables
Table 6.1: Basic statistics of the dynamic network datasets used in this study. The actors and links denote the total unique number of actors and links found in the entire network. Temporal fluctuations of the quantity of actors and links occur in each temporal network snapshot of the network known as Short Interval Network (SIN). From the link prediction perspective, the total duration of the time-resolved network, data were split into two non-overlapping intervals (i.e., training and test). The start and end denote the beginning and end of each interval. Nine different sampling intervals (i.e., duration length/time scale of SINs) were used and the optimum was singled out from these time-scale durations
132
Table 7.1: Variances of actor-level positional dynamicity values in each dynamic network dataset sampled by considering nine different window sizes. The green-shaded cell represents the smallest value and according to the algorithm developed in chapter 3, denotes the best optimal window size in the respective dataset and the yellow-shaded cell represents the second best optimal window size for each dynamic network.
146
Table 7.2. Evaluation results to justify the optimal time-scale duration out of nine sampling window choices as per the approach presented in chapter 3 in three dynamic networks (i.e., 𝐺𝐺𝑀𝑀𝑀𝑀𝑀𝑀,𝐺𝐺𝐸𝐸𝐸𝐸𝐸𝐸𝐸𝐸𝐸𝐸, 𝐺𝐺𝑈𝑈𝑈𝑈𝑀𝑀). Evaluation tests include the best-fit ARIMA model, percentage of time series anomalies present (Anomaly %) in the time series of positional dynamicity of Short Interval Networks (SINs) of nine different lengths and minimum total within-cluster variance (Minimum Variance) within optimal number of clusters (# Optimal Clusters). The univariate K-means clustering method was used for distribution of positional dynamicity values of actors. The green-shaded columns denote the optimal temporal window. The yellow-shaded columns are the contenders as the second-best window(s) in the respective dataset. The red-shaded column(s) represent the contender window to be the second best optimal window choice in the respective dataset.
xxv
Table 7.3: Evaluation results to justify the optimal time-scale duration out of nine sampling window choices in three dynamic networks (i.e., 𝐺𝐺𝐹𝐹𝐹𝐹,𝐺𝐺𝑀𝑀𝐼𝐼𝐹𝐹, 𝐺𝐺𝐻𝐻𝑀𝑀). Evaluation tests include the best-fit ARIMA model, percentage of time series anomalies present (Anomaly %) in the time series of positional dynamicity of Short Interval Networks (SINs) of nine different lengths and minimum total within-cluster variance (Minimum Variance) within optimal number of clusters (# Optimal Clusters). The univariate K-means clustering method was used for distribution of positional dynamicity values of actors. The green-shaded columns denote the optimal temporal window. The yellow-shaded columns are selected as the second-best window(s) in the respective dataset. The red-shaded column(s) represent the contender window to be the second best optimal window choice in the respective dataset.
150
Table 7.4: Number of Short Interval Networks (SINs) generated by different choices of temporal window sizes for each dynamic network used in this study. This also denotes the length of temporal network snapshots.
159
Table 8.1: A list of different dynamic features in which each feature computes 𝒔𝒔𝒔𝒔𝒔𝒔𝒔𝒔 (𝒂𝒂,𝒃𝒃), a similarity score between actor 𝒂𝒂 and 𝒃𝒃 by using different evolutionary aspects and actor-level network structures in dynamic networks.
165
Table 8.2: Classification performances of three classifiers (i.e., LR=Logistic Regression, RF=Random Forest, and B=Bagging) in classifying positive and negatively-labelled instances in the classification datasets of six different dynamic network datasets. The instances in the corresponding dataset were described by dynamic features constructed by considering temporal series of network snapshots. Two different time scales (optimal and second optimal) were considered to generate these network snapshots.
169
Table 8.3: Importance ranking of different dynamic features constructed in this study using different algorithms including Information Gain (IG), Chi-square statistical evaluation (Chi), attributes ranking in support vector machine classifier (SVM), and feature ranking in a Random Forest (RF) classifier. Ranks are in decreasing order in which number one (1) denotes the highest ranking. The ‘Total’ column represents the aggregation of all ranking score to generate the final ranking. 𝑠𝑠𝑆𝑆𝑆𝑆8𝐸𝐸 denotes the 8th metric that used hierarchical agglomerative clustering approach and 𝑠𝑠𝑆𝑆𝑆𝑆8ℎ denotes the same metric using Louvaincommunity detection approach. The green-shaded cells represent the best performing features, whereas the yellow-shaded cells indicate the second-best features.
1
Chapter 1
Research Motivation, Objectives &
Thesis Organisation
2
1.1
Introduction
Link prediction is a fundamental task in a complex networked system, such as a social network, where the principal task is to predict the future associations or interactions between networked entities, individuals or actors. These associations are driven by mutual interests inherent to a group of actors [1]. In network science, the principal goal of link prediction is to estimate the likelihood of new link formation [2]. However, most real-life systems are described as evolving networks, where entities (actors) and links (edges) may appear and disappear or attributes of entities and links may vary over time [3]. These evolving networks are called dynamic networks and they can be represented as a time series of network snapshots. In each snapshot, a specific temporal duration is considered to aggregate links regardless of their order of appearances. The aim of link prediction in dynamic networks is to predict future information based on historical data and this information is considered valuable in applications including national security, online recommendations, and organizational studies. In addition to this, link prediction has important practical significance. For example, it can support modelling information diffusion in online social networks, recommender systems for product recommendation and friend or co-author recommendations in a social (collaboration) network, and predict future interactions among biological entities that are expensive to discern through laboratory experiments [4]. Most link prediction strategies consider a static version of the corresponding network where the actor and link structures do not change. This means that the prediction methodologies are insufficient for the task of link prediction in dynamic networks. Although researchers have used time series information for this purpose, they have only considered temporal relational changes (for example, when friends of friends become friends) or the characteristics of pairs of actors (dyadic covariates) instead of the temporal network characteristics of the actors (actor-level evolutionary covariates). Further, most link prediction methodologies in dynamic networks overlook the
3
problem of defining an optimal sampling resolution to discretise the corresponding dynamic networks. Considering these two issues, this research developed a supervised link prediction strategy in dynamic networks by using some novel features. These novel features denote the similarity between actors in regard to the different evolutionary aspects demonstrated by them in dynamic networks. Further, these evolutionary aspects were quantified in an optimally sampled dynamic network.
This chapter introduces the thesis. First, background information on link prediction is provided, followed by related definitions, a formulation of the research problem and a description of the research issues explored in this thesis. This background discussion is followed by a description of the motivation behind this research in regard to link prediction in dynamic networks, also known as dynamic link prediction, from the perspectives of dynamic network analysis and link prediction methodologies. It also summarizes the rationale behind the research objectives of this thesis. The chapter concludes with an outline of the thesis, explaining the different topics discussed in the subsequent chapters.
1.2
Background
1.2.1 NetworksA network is a graph structure that consists of a set of nodes, also known as vertices or actors, and a set of ties among these actors, known as links. Alternatively, a network is a pattern of interconnections, also known as link structures, among a set of network components known as nodes, actors or vertices. Mathematically, a network can be formally defined as a graph 𝐺𝐺 = (𝑉𝑉,𝐸𝐸) that consists of the set 𝑉𝑉 of nodes and the set 𝐸𝐸 of edges, which are unordered pairs of elements of 𝑉𝑉. In this thesis, the words, ‘‘graph’ and ‘network’ are used interchangeably.
4
Nowadays, a network is a prevalent abstract structure that is used to understand and represent complex systems. Examples of their use include a society that requires billions of individuals to cooperate in order to run smoothly, communication infrastructure that integrates numerous mobile phones with computers and satellites, cognitive systems that require the coherent activity of billions of neurons in our brain and the biological existence of humans, which is dependent on seamless interactions between thousands of genes and metabolites within our cells. Referring again to these examples of systems that exist all around us, nodes, vertices or actors in networks can be individuals, mobile phones, transport vehicles, communication devices, cells, proteins, neurons, animals or any other entity. Links or edges can be any type of connection, relationship or interaction between these nodes, including societal, metabolic, infrastructural or even co-appearances.
1.2.2 Network Topology
In general, topology means the way in which the constituents of a system are interrelated or organized. Network topology is defined by a complete description of the way the components of a network (i.e., the nodes/actors) are connected to each other. There are three fundamental attributes of a network topology: degree, clustering and path length [5]. The topology of networks has been the subject of intensive attention, since it plays an extremely important role in many systems and processes including the flow of data in computer networks [6], the energy flow in food webs [7] and the diffusion of information in social networks [8].
1.2.3 Network Communities
Most real-world networks demonstrate inhomogeneity and reveal a high level of order and organization instead of randomness [9]. Actors in these networks demonstrate a community structure where some groups of actors have a higher density of links among them and other groups have a lower density of links. These densely connected groups of actors organized in networks are commonly referred to as network communities, clusters or modules [10]. J.
5
Yang and Leskovec identify various reasons why actors form groups in networks [11]. These include individuals forming families, villages, groups and associations to organize a society, topically related webpages on the internet densely linking among themselves and, finally, groups of actors in metabolic networks that are related to functional units, such as pathways and cycles.
1.2.4 Static and Dynamic Networks
In network analyses, a network can be static or dynamic. In a static network, the actors, links, corresponding network topology and communities of actor never change. No new actors or links are added and no existing actors and links get deleted. In contrast, in a dynamic network, new actors are added, new relationships are established between actors, existing actors disappear, and old relationships dissolve over time. These simultaneous appearances and disappearances of actors and links trigger alterations of corresponding network topologies and communities of actors in a dynamic network. Lu, Savas, Tang and Dhillon identified four different factors that contribute towards these dynamics: relational changes (for example, friends of friends become friends), characteristics and/or attributes of actors (i.e., actor covariates), characteristics or properties of pairs of actors (i.e., dyadic covariates) and random unexplained influences [12].
A dynamic network is comprised of different static network snapshots observed at different points in time. These observed networks are called short interval networks (SINs). Figure (1.1) shows an abstract representation of dynamic network consisting of five SINs at five different timestamps (i.e., 𝑡𝑡= 1, 2, 3, 4, 5). A dynamic network 𝐺𝐺𝑇𝑇 = (𝑉𝑉,𝐸𝐸𝑇𝑇) consists of a set of uniquely labeled actors 𝑉𝑉 = [𝑣𝑣1,𝑣𝑣2,𝑣𝑣3, …𝑣𝑣𝑛𝑛] and 𝐸𝐸𝑇𝑇 = [𝑒𝑒𝑡𝑡(𝑣𝑣𝑖𝑖,𝑣𝑣𝑗𝑗,𝑡𝑡)|𝑣𝑣𝑖𝑖,𝑣𝑣𝑗𝑗 ∈ 𝑉𝑉;𝑡𝑡 ∈
𝑇𝑇] where 𝑡𝑡 represents the timestamp of link 𝑒𝑒 between actor-pair𝑒𝑒(𝑣𝑣𝑖𝑖,𝑣𝑣𝑗𝑗). In addition to this, both the static and dynamic networks can be undirected where 𝑒𝑒= (𝑣𝑣𝑖𝑖,𝑣𝑣𝑗𝑗) and 𝑒𝑒=
6
(𝑣𝑣𝑗𝑗,𝑣𝑣𝑖𝑖) denotes identical links or is directed where two links are not same. Thus, a dynamic network is composed of an evolutionary sequence of network snapshots 𝐺𝐺𝑇𝑇 = [𝐺𝐺𝑡𝑡1,
𝐺𝐺𝑡𝑡1+𝜏𝜏, 𝐺𝐺𝑡𝑡1+2𝜏𝜏 … 𝐺𝐺𝑡𝑡1+𝑛𝑛𝜏𝜏…𝐺𝐺𝑡𝑡′−𝜏𝜏, 𝐺𝐺𝑡𝑡′] where 𝐺𝐺𝑡𝑡𝑖𝑖 denotes an individual SIN or a static network at time 𝑡𝑡𝑖𝑖. In this thesis, the words, ‘dynamic’, ‘temporal’ and ‘longitudinal’ are used interchangeably.
In temporal (dynamic) networks, there are three aspects of change over time. The first aspect is the temporal changes of associated attributes of actors and links. The second aspect is when the number of actors remain unchanged but the links change over time, represented by 𝐺𝐺𝑇𝑇 = (𝑉𝑉,𝐸𝐸𝑇𝑇). The third aspect is when both the actors and links experience temporal changes 𝐺𝐺𝑇𝑇 = (𝑉𝑉𝑇𝑇,𝐸𝐸𝑇𝑇). This study considers the second aspect of the dynamic network where the number of actors remains unchanged but the links change over time.
The temporal arrival and departure of links lead a dynamic network to grow or shrink over time. The process of link formation is considered as a tenet behind the growth and evolution of a dynamic network [13,14]. This process of link formation considers the question of which actors will form associations with each other. In network science, this question is addressed by the link prediction problem.
Figure 1.1: An abstraction of a dynamic network in which the state of the network changes over time. Each network snapshot at each individual timestamp is known as a short interval network (SIN).
7
1.2.5 Link prediction
The task of link prediction is to predict the occurrence of a future link between two actors based on actors’ observed links and attributes. Mathematically, given a structure of a network at time 𝑡𝑡, link prediction models predict which new links are formed in structure at time 𝑡𝑡+
1. The link prediction problem is also considered important for mining and analysing the evolution of social networks [15]. Link prediction methods use the properties of the network, such as link existence, link weights, common neighbours, node degree and clustering coefficients, to predict the link between a pair of actors [16]. There are three categories of algorithms that are predominantly used in network link prediction: similarity-based algorithms, maximum likelihood models and probabilistic models [17]; however, most methods that are situated in these categories consider the underlying network as static. In addition to their inherent limitations (described later in this chapter and in Chapter 2), these methods are found to be unsuitable for the link prediction task in dynamic networks, also known as dynamic link prediction.
1.2.6 Dynamic Link Prediction
In the context of the link prediction problem, two different time intervals (𝑡𝑡1,𝑡𝑡′) , (𝑡𝑡′,𝑡𝑡1′) where 𝑡𝑡1 < 𝑡𝑡′< 𝑡𝑡1′, are considered. As discussed above, the primary objective of a link prediction mechanism is to analyse the network structure and actors’ attributes in the training phase �𝑡𝑡1,𝑡𝑡′ � in order to predict the possibility of future links in the test phase �𝑡𝑡′,𝑡𝑡2�. Therefore, considering two different time intervals, (𝑡𝑡1,𝑡𝑡′) and (𝑡𝑡′,𝑡𝑡1′) , the network
𝐺𝐺𝑇𝑇[𝑡𝑡1,𝑡𝑡′] is used as the network in the training phase and 𝐺𝐺𝑇𝑇+1[𝑡𝑡′,𝑡𝑡1′] is the network in the test phase. In dynamic link prediction task, a finite set of discrete time points within the range 𝑇𝑇= [ 𝑡𝑡1,𝑡𝑡′ ] are considered as 𝑇𝑇= [𝑡𝑡1, (𝑡𝑡1+𝜏𝜏), (𝑡𝑡1+ 2𝜏𝜏) … (𝑡𝑡1+𝑛𝑛𝜏𝜏) … (𝑡𝑡′−
𝜏𝜏), 𝑡𝑡′], where τ denotes the temporal sampling interval mentioned above. Fluctuations of the total number of actors are taken into consideration across the time series of network
8
snapshots. Any link may appear in multiple network snapshots at different timestamp(s).
Considering this temporal sequence of network snapshots [𝐺𝐺𝑡𝑡1, 𝐺𝐺𝑡𝑡1+𝜏𝜏, 𝐺𝐺𝑡𝑡1+2𝜏𝜏 … 𝐺𝐺𝑡𝑡1+𝑛𝑛𝜏𝜏…𝐺𝐺𝑡𝑡′−𝜏𝜏, 𝐺𝐺𝑡𝑡′] for a given pair of actors (𝑣𝑣𝑖𝑖 ,𝑣𝑣𝑗𝑗),
dynamic link prediction attempts to predict the likelihood of link formation between them during the interval (𝑡𝑡′,𝑡𝑡1′) in 𝐺𝐺𝑇𝑇+1 by analysing the link formation and temporal information in [𝐺𝐺𝑡𝑡1, 𝐺𝐺𝑡𝑡1+𝜏𝜏, 𝐺𝐺𝑡𝑡1+2𝜏𝜏 … 𝐺𝐺𝑡𝑡1+𝑛𝑛𝜏𝜏…𝐺𝐺𝑡𝑡′−𝜏𝜏, 𝐺𝐺𝑡𝑡′] at timestamps [𝑡𝑡1, (𝑡𝑡1+𝜏𝜏), (𝑡𝑡1+
2𝜏𝜏) … (𝑡𝑡1+𝑛𝑛𝜏𝜏) … (𝑡𝑡′− 𝜏𝜏), 𝑡𝑡′] .
Dynamic link prediction has practical significances. Sett, Basu, Nandi and Singh note that it has been studied for prediction tasks in various areas including information retrieval, user and product relationships in recommendation systems, determining the structure of terrorist networks, surveillance systems in communication networks, and the describe the relationships between individuals in a friendship network [18]. In the next section, some important applications of dynamic link prediction are discussed, exploring its wider applicability, thus also denoting the rationality behind this research.
1.3 Applications of Dynamic Link Prediction
Apart from its theoretical value in supporting the study of underlying network evolution mechanisms, dynamic link prediction has a wide range of practical values. Researchers have applied link prediction techniques in different types of networks including social, transportation, disease, communication, and biological networks. A list of interesting real-life problems can be modelled as link prediction problems. ranging from the outbreak of disease, spam email detection, route recommendation to collective classification [19] as well as specialists’ predictions of receiving future referrals in healthcare systems [20] and predicting irregular links in disease-gene networks to find genes responsible for diseases [21].9
Applications where dynamic link prediction can be exploited are discussed in the following subsections.
1.3.1 Recommender Systems
Recommender systems utilize various sources of information and data to infer users’ interests. The basic underlying principle of recommendation algorithms exploits the dependencies between users and item-oriented activities. These dependencies can be better learnt through analysing the historical information of user-item relationships. Many forms of recommendation activities can be performed by using dynamic link prediction strategy. For example, personalized movie recommendations from Netflix [22], job recommendations [23], potential friend recommendations in online social networks [24], potential business or scholarly (for example, patent) collaborator recommendations [25,26], international trade recommendations [27], item/commodities recommendations [28] and predicting users’ online ad-clicking patterns from the historical information about their actions and their friends [29].
1.3.2 Security Systems
Link prediction is already used in anomalous mail detection to single out spam emails [30]. It is also applied to discover the missing and/or incomplete information inherent to criminal networks [31], anomalous link discovery [32], and fraudulent call detection in mobile networks [33]. Link prediction also supports privacy control in social networks. For example, Al-Oufi, Kim et al. propose a model that identifies trustworthy people for a given user based on weighted relationships and hence protects the corresponding user’s privacy and security from unreliable users [34].
1.3.3 Biological Systems
In biological networks like protein interactions [35] or metabolic networks [36] where discovering potential interactions through laboratory experiment is expensive, link prediction
10
can provide support and reduce overheads. An important problem in computational biology is predicting gene–disease associations in order to identify the causal disease genes. Some representative researches in this category include studies in [37-39]. Similar foundational applications of link prediction in biological networks include discovering and/or developing new drugs [40], predicting drug sensitivity and/or drug responses [41,42] and symptoms of abnormal parameters of disease [43].
1.3.4 Scholarly Systems
A vast majority of link prediction literature deals with scientific collaboration or citation networks where the objective is to predict future collaboration between scholars [44] or citations of a scholarly contribution [45]. In addition to collaboration and citation networks, link prediction mechanisms were also applied to predict the type and experts of academic research [46,47], identifying missing references to avoid plagiarism [48] and scientist-article cooperation analysis [49].
1.3.5 Communication Systems
Identifying optimal routes is a conventional problem in communication networks (for example, wireless technology). To avoid frequent breaks in routes in mobile ad-hoc networks and to improve the quality of routing in mobile wireless networks, different link prediction mechanisms have been used by researchers [50,51]. In addition to wireless network applications, link prediction has also supported improving transportation efficiency by identifying efficient routing strategies [52] including ensuring information transfer secrecy [53] and optimal routing [54] in sensor networks.
1.3.6 Social Systems
Link prediction mechanisms support the study of social network evolution. The principal application domain of dynamic link prediction is in social networks, including social media.
11
In online social networks such as Facebook, it can provide potential friend suggestions [24,55-57], special interpersonal links can be advised to users by analysing different social relations [58,59] , social influence detection [60] and information diffusion prediction [61]. Further, link prediction supports complete network inference from partially observed ones to better understand social network evolution [62,63].
1.4 Statement of the Problem
In recent years, inherently network-oriented and ubiquitous web and social media applications have resulted in a strong focus on network and relational data. Network data structure or graph models have become a common framework used to represent and analyse a large number of complex, integrated and real-world interacting systems from nature, society and technology, ranging from the billions of neurons in the human brain and the enormous collection of connected autonomous systems in the internet to the billions of users of social media. These networked systems are massive in size and contain tremendous amounts of content. They are also dynamic in nature and inherently evolutionary. Examples include romantic partners from online dating sites [64], protein interactions, nervous systems, power grids, ecosystems and physical and electronic communication infrastructure [65-67]. One of the inherent underlying structures of these networked systems is their evolution over time in experiencing temporal changes in the overall network dynamics. In these evolutionary networks, temporal patterns emerge through the simultaneous arrivals and/or departures of actors as well as the creation and/or deletion of links among these actors. Characterizing network structures in a time-dependent way or incorporating temporal information to model the dynamics of networks is often complex due to the intermittent existence of actors and links among them [68]. It has also been also found that temporality impacts on most of the dynamic processes taking place in networks [69-71]. Further, according to X. Li et al., high
12
dimensionality, the quantity of observations, complexity in selecting explanatory variables, sensitivity to noise due to sparsity and computational costs due to non-linear transformations pose major challenges in dynamic network analysis [72]. However, although the mining and analysis of evolutionary networks is a complex non-trivial task, it has drawn considerable research interest [73,74]. Other difficulties in analysing dynamic networks includes associated dynamicity, incomplete data due to topological approximation and limitations in time and space or experimental conditions [75] [15]. Although the mechanism by which evolution takes place in dynamic networks is yet to be congruously standardized or fully understood, network science proposes various methods supporting the study and modelling of the network evolutionary process that governs their dynamics [76]. One of these methods is link prediction. Link prediction is the basic and fundamental computational problem that models the underlying growth mechanism of an evolving network [77]. The emergence of new links, affecting the growth of underlying networks (as mentioned above), is paid the most attention in the analysis of network evolution. Therefore, link prediction mechanisms have attracted extensive research focus as they allow for the extraction of missing information and the evaluation of network dynamics [78]. Researchers consider link prediction the fundamental problem of network science, since it unfolds the mechanism governing the micro-dynamics of a network [79].
1.4.1 Research Motivation
As a time-evolving model, the problem of link prediction in network science has both theoretical and practical significance. Link prediction aims to uncover the underlying relationships among actors in a network to either help find missing links or to infer the future interactions among them by evaluating the likelihood of a link between two actors yet to be connected [80,81]. Link prediction models consume different types of information for these two purposes, including existing historical information either in regards to the network
13
structure and topology [82] or actor-oriented attributes [17]. The list of network structural information includes the number of common neighbours [83], clustering co-efficient [84] or actor attributes (for example, the degree of connections) [85]. Due to its wide range of applicability, a number of methodological improvements have been proposed to support this partial link analysis in networks. Most of these methods estimate the possibility of the emergence of new links among non-connected network actors by leveraging topological properties, actor/link attributes, local or global network structure [86] or probabilistic models [87]. Two of the major issues with these methods are dependency on static topological feature engineering [88] and failure to acknowledge the temporal changes in networks [89]. Although the link prediction problem is believed to be a time-evolving network analysis model, traditional similarity metrics-based methods generally fail to take the evolutionary aspects of the network into account. Sarkar, Chakrabarti and Jordan identify three weaknesses of these strategies: a dependency on heuristics (for example, counting the number of common neighbours); the use of heuristic measurements in static snapshots of the network (for example, counting the number of common neighbours between two actors in one network snapshot to predict their future association in the next snapshot; and, finally, the non-integration of the temporal components in heuristic measurements (for example, disregarding the temporal neighbourhood changes between two actors) [90].
Temporal patterns emerge in evolutionary networks through the simultaneous arrival and/or departure of actors as well as the creation and/or deletion of links among these actors. This has led scholars to reconsider the evolutionary information in link prediction tasks, resulting in the concept of dynamic link prediction. Dynamic link prediction, also referred to as link prediction in dynamic networks, is the process of inferring the possibility of future links among dynamic entities or network actors through exploring historical or temporal information [91]. Different dynamic link prediction methods explore a wide range of
14
techniques (described in Chapter 2), including topological evolution in conjunction with different forecasting methods, sub-graph evolution, the dynamic latent space representation of actors and random walk-in temporal networks, the correlation between different types of links along with temporal features (for example, ‘recency’, temporal activeness), temporal probabilistic measures, non-parametric link prediction methods based on both the features of individual actors and their neighbourhood, machine learning models, statistical models, and matrix or tensor analysis [92].
Despite their improved performance in predicting emerging or hidden links, some of these methods are subject to inherent limitations. For example, probabilistic models require the prior definition of the distribution of link occurrences, which is difficult to define before the actual prediction task and especially in temporal networks [93]. Most existing approaches (discussed in detail in Chapter 2) perform the task of dynamic link prediction by considering the temporal sequences of topological or structural features incident to actor-pairs instead of measuring their similarity and/or proximity by mining actor-level evolutionary aspects including the temporal patterns of neighbourhood changes or evolutionary community-aware information. Further, using the time series forecasting method to predict the future values of topological changes and then using these values for classifier training in supervised link prediction can be incoherent, since the prediction is performed using unrealistic values. To address these issues, it is imperative to consider the evolutionary similarity between actor-pairs when developing features for supervised dynamic link prediction. Further, since the rate of evolution experienced by each actor in a network depends on the sampling duration of network snapshots that make up the corresponding dynamic network, it is also crucial to determine the optimal sampling interval in order to discretise the dynamic network and generate network snapshots.
15
1.4.2 Research Objectives
As mentioned earlier, a dynamic network is a time series of network snapshots where each snapshot represents the state of the network over the temporal interval of different granularity (for example, minute, hour, day, month) [94]. The duration of the interval denotes the temporal scale of the dynamic networks, since all links within this duration are aggregated together irrespective of their temporal order. Links within a dynamic network are represented either as streaming interactions in time or a collection of finer aggregated snapshots. In order to achieve meaningful knowledge in dynamic network analysis, it is essential that in the transition from the streaming temporal interactions or a series of aggregated snapshots to a dynamic network abstraction, the extent of discarded information should be insignificant. While researchers usually pay scrupulous attention to the design of their longitudinal studies, they typically pay less attention to the temporal design of their studies. This temporal design refers to the timing and spacing of occasions of measurements [95] or simply the time scale/sliding window mentioned above. Although the selection of this time scale to sample dynamic networks is often done opportunistically [96], the complex temporal structure of a dynamic network is very sensitive to the appropriate selection of this temporal sliding window. This is because a too fine or too coarse window size will either conceal or unravel the important temporal dynamics of the network and the underlying interaction structures of actors [97].
Further, actors in dynamic networks are subject to varying temporal changes (i.e., dynamicity) within the temporal network snapshots due to alterations of different network activities (for example, link formation and link deletion) over time. This triggers temporal changes in the actors’ positions and neighbourhood in dynamic networks and, subsequently, this actor-level dynamicity instigates both micro (for example, neighbourhood) and mesoscopic (for example, community participation) changes in dynamic networks. By mining
16
the similarity or correlation between these diverse actor-level temporal fluctuations (i.e., structural position, neighbourhood and community), it is possible to generate dynamic features for the purpose of dynamic link prediction.
Considering the aforementioned two research issues, this study has two principal research objectives. First, this study develops an algorithm that effectively defines an optimal temporal window to sample/discretise a dynamic network, including some validation methods to evaluate the optimality of the sampling window size. Second, this study develops some dynamic similarity metrics (also called as dynamic features) by measuring the evolutionary similarity between actor-pairs for the purpose of dynamic link prediction. The dynamic similarity metrics, which are similar to the topological similarity metrics computed in traditional link prediction for static networks, are constructed by mining the temporal evolutionary similarity of actor-level evolution (the terms ‘evolution’ and ‘dynamicity’ are used interchangeably in this thesis) between actor-pairs in dynamic networks. In regards to the dynamic features developed in this study, the optimality of the sliding window selection is crucial since an individual actor’s link structure and its structural evolution and network position will vary in each network snapshot depending on the link aggregation [98].
17
In Figure (1.2), this phenomenon is described pictorially. In Figure (1.2a), a list of time-stamped (i.e., daily) links are collected where the source (i.e., From Actor) and target (i.e., To Actor) actors form links and the temporal granularity of each link occurrence is a day. Figures (1.2b) and (1.2c) show the pattern of network snapshots where the sampling duration for the dynamic network is one and two days respectively. The sizes of the actors denote their number of connections (i.e., degree). The figures show that both the pattern and degree of connections for each actor are dependent on the interval duration considered for
link aggregation in a network snapshot. Therefore, before developing dynamic features, an algorithm to detect the optimal time scale (i.e., sampling duration) to sample a dynamic network is proposed in this study.
Considering the aforementioned rationales behind the research objectives, the outcome of this research can be of great importance. By defining an optimal time window/scale to sample a dynamic network and generate a time series of network snapshots, researchers can now map their sampling resolution to the inherent temporal resolution of the
Figure 1.2: Differences in network analysis results of an abstract dynamic network that evolved in four days with the consideration of different window sizes. The sizes of actors are proportionate to their degree centrality values. (a) a list of date-stamped links, (b) first network snapshot considering one day time scale, (c) second network snapshot considering a time scale of two days.
18
underlying processes of the system considered. Further, instead of the arbitrary sampling of dynamic networks, optimal sampling will demonstrate the actual temporal dynamics of the corresponding network. Furthermore, it will allow researchers to consider temporal information related to the actual prediction task. Similarly, the dynamic features constructed in this study will introduce the notion of similarity-based algorithms in dynamic link prediction tasks. Earlier in this chapter, it was noted that similarity-based algorithms are one of the principal methods used in the prediction task. In a static network, these algorithms generally compute different graph-based topological similarity or actor attribute-based similarity. In the case of a dynamic network, the outcome of the dynamic features from this study will not only allow researchers to model different types of actor-level dynamicity but also to compute their evolutionary similarity, a concept yet to be explored in the complex network research. Further, as explained in Section 2, in conjunction with relational changes and dyadic covariates, actor covariates also contribute towards the network dynamics. Thus, by mining different actor dynamicities, this study will also benefit the future studies on network evolution.
1.4.3 Problem Formulation
Although, link prediction in dynamic networks is complex and challenging, it is important for analysing the associated network evolution and is applicable to a wide variety of applications. Due to its inherent evolutionary nature, link prediction is vital for exploring interesting trends on evolutionary aspects of non-connected actors in dynamic networks. For example, mining micro-scale (for example, network structure and neighbourhood) or meso-scale (for example, community participation) changes that are incidental to actors in dynamic networks can be helpful for predicting the possibility of their future associations. Figure (1.3) shows some of the changes experienced by actors in a dynamic network that is sampled into two individual network snapshots. In this figure, in order to predict a link between actors 𝑎𝑎1 and 𝑎𝑎2 at
19
timestamp 𝑡𝑡3, the pattern and degree of connections experienced by these two actors are analysed in two SINs at timestamps 𝑡𝑡1 and 𝑡𝑡2. At these two timestamps, both these actors
Figure 1.3: Visual representation of addressing the dynamic link prediction problem by considering actor-level evolutionary similarity explored in this thesis. The top row represents a dynamic network which is sampled into two network snapshots 𝑔𝑔1 and 𝑔𝑔2 at timestamp 𝑡𝑡1and 𝑡𝑡2. To predict the future link between actors 𝑎𝑎1 and 𝑎𝑎2 at timestamp 𝑡𝑡3, this thesis compared similarity between different types of evolutions experienced by both actors over time. For example, at timestamp 𝑡𝑡1, actor 𝑎𝑎1 has one connection whereas the same actor has two connections at timestamp 𝑡𝑡2. Similarly, the same actor has different neighbours at timestamp 𝑡𝑡2 (i.e., 𝑎𝑎4,𝑎𝑎8) than those at timestamp 𝑡𝑡1 (i.e., 𝑎𝑎6). Thus, actor
𝑎𝑎1 has lower neighbourhood retention rate but higher gaining rate. In the bottom row, the pattern and topology of the network snapshot is represented if the sampling interval was different (i.e., 𝑡𝑡1+𝑡𝑡2). Thus, the bottom network snapshot consists of an aggregated network of 𝑔𝑔1∪ 𝑔𝑔2.
20
have different degrees of connection. For example, at timestamp 𝑡𝑡1, actor 𝑎𝑎1 has one neighbour and actor 𝑎𝑎2 has three neighbours. However