Part 2 - Assessment Outcomes
Table 2.1 – Assessment Details
Name of entity
St Lucia CampusTotal energy use in the last financial year 430,982 GJ
Total percentage of energy use assessed 10.38% %
Description of the way in which the entity carried out its assessment
The main campus of The University of Queensland (UQ) is located on a large bend in the Brisbane River at St Lucia about 10km from the CBD. The St Lucia Campus has over 33 major buildings with GFA greater than 5000m2 and over 60 smaller buildings. A wide range of teaching, research,
recreational and cultural activities are conducted on this campus.
During 2010/11 energy efficiency consultants conducted Level 1 energy audits on nine buildings at St Lucia and a Level 2 energy audit on one building, J D Story Building. The audits resulted in a large number of recommendations to improve energy use. Most covered lighting. In two of these buildings, the Queensland Biosciences Precinct and the Queensland Brian Institute, facility management personnel are exclusively assigned to the buildings and therefore they had sufficient local knowledge to start the process of retrofitting new lighting.
A data base system consisting of lighting technology surveys, detailing of specific opportunities (scopes of work) and implementation was developed. A full scale trial retrofit was conducted at the JD Story Building during 2011/12 to prove this system. This was followed by light technology surveys and retrofitting of 8 buildings at St Lucia, namely, the Richards, Forgan Smith, Priestley, Hartley Teakle, Goddard and Steel Buildings, the Faculty of Sciences Building 69 and the Human Movement Studies Building. As well as changing light fittings and/or lamps, retrofit work at St Lucia has also included installation of passive infrared (PIR) and photoelectric (PE) sensors to turn off lights when not needed in toilets and meeting rooms.
As part of a continuing lighting technology survey program Plan at the St Lucia Campus, surveys were also conducted during 2011/12 of the Sir William McGregor, Mansergh Shaw, General Purpose South and Sir Llew Edwards Buildings.
During 2010/11 the University commissioned an energy and comfort audit of the UQ Centre. The UQ Centre is the main graduation venue for the University. Students, their parents, relatives and friends, senior academic staff and dignitaries attend graduations and this provides an opportunity to showcase the University. For a number of years parts of the UQ Centre have, however, been uncomfortably hot at times during summer. The consultants recommended a multipronged strategy to reduce heat loads and improve comfort: improved lighting to reduce internal heat loads; window film for the eastern windows to block out solar heat gain; and better maintenance of the air conditioning systems to enhance energy efficiency and service delivery. This work was successfully completed in 2011/12.
Towards the end of the 2011/12 year, tender documents were prepared for Level 2 energy audits of 12 major buildings on the St Lucia Campus and associated reviews of the metering and BMS systems in these buildings. The buildings covered by the tender were Building 69, General Purpose North 3, Hawken Engineering, Sir James Foot, Sir William MacGregor, Goddard, Mansergh Shaw, General Purpose South, Chamberlain, Sir Llew Edwards, Hartley Teakle and Forgan Smith Buildings. The contract for this work was awarded and work started before the end of the 2011/12 year.
Air conditioning at St Lucia is provided using chilled water produced in central chiller stations. St Lucia has 12 chiller stations serving multiple‐
building precincts and two stand alone installations – chillers that serve just a single building. Presently the largest chilled water precinct, the Central Precinct, has 12 buildings served by a single chiller station. Understanding the production, distribution and use of chilled water at St Lucia, is
essential to identifying efficiency opportunities.
During 2010/11, a building control company installed temporary metering to monitor the performance of selected chillers in the three of the largest chiller stations. As a result of this exercise a decision was taken to install permanent electrical and chilled water metering on each chiller in the three chiller stations (eight chillers in total) and create a network to monitor real time performance. The meter installation was completed in 2011/12 and the creation of a monitoring network commenced. In the same year, scopes of works were prepared for the retrofit installation of chilled water meters on chillers at two other precinct chiller stations, namely Human Movement Studies and Computer Sciences precinct stations. Scopes of work were also prepared for the installation of chilled water meters on three buildings; the Chancellery, the Learning Innovation Building and the
Chamberlain Building. Installation will occur during 2012/13. As part of the University’s CAPEX (new building) program, chilled water meters were also installed in the chillers serving the new Centre for Advanced Imaging Building during 2011/12.
A major review of electrical metering at St Lucia was conducted during 2011/12. Existing meters were identified and their location and other attributes were entered into an asset management database. Single line diagrams were prepared showing the location of meters in the electrical reticulation system. This work enabled strategic gaps in the present metering system to be identified. During 2011/12 approximately 30 new electrical meters were installed at St Lucia to cover many of these gaps. This work is ongoing with the objective that by the end of 2012/13 it will be possible to accurately monitor the electricity use in all 33 major buildings at the campus. Electrical meters were also installed on chiller motors, pumps and cooling towers as part of the work to establish a system to monitor energy consumed in the production distribution and use of chilled water for air conditioning; the overall point of all this new metering is to enable energy use to be monitored, opportunities for improvement to be identified and progress to be tracked.
During 2011/12 opportunities to improve the operation of the Central Chiller Station and its precinct were identified (Figure 1). A proposal was developed to improve the operation of the chillers and their integration with the cooling towers. A project to install an optimisation package on the chillers station plant was developed. This project is scheduled for implementation during 2012/13. Energy savings of around 20% are anticipated.
Each building on the Central Chiller Precinct has one and in some cases two chilled water pumps. Pumps motors are long lived and those on the Central precinct were thought to pre‐date the availability of highly efficient models. Over 95% of the lifecycle cost of a water pump is electricity supply to the pump motor. High efficiency motors can save so much electricity that it can make sense to swap out old motors (and recycle their components) even if they still have plenty of life left in them. A detailed audit of the pumps was conducted during 2011/12 and this confirmed that opportunities exist to retrofit more efficient pump motors. This work is planned for 2012/13.
Figure 1: Central Chiller Precinct at St Lucia (orange fill) [PP & SP = Primary and Secondary Pumps]
Name of entity
Gatton CampusTotal energy use in the last financial year 61,582 GJ
Total percentage of energy use assessed 1.85% %
Description of the way in which the entity carried out its assessment
The UQ Gatton Campus is located adjacent to the Warrego highway at Gatton approximately 90km west of Brisbane. The main activities at Gatton are teaching and research associated with veterinary and agricultural science disciplines, food production and environmental management. Gatton has residential colleges to house students and accommodation for visiting staff. It also has administration, teaching and research buildings, a veterinary hospital and farm facilities such as a dairy, calf rearing sheds, piggery units and equine facilities.
During 2010/11, consultants conducted a Level 1 energy audit of the Centre for Advanced Animal Science (CAAS), a complex of buildings at Gatton. CAAS is a joint venture between the Queensland Department of Primary Industries and The University of Queensland. The CAAS complex comprises 24 buildings ranging from containment laboratories through to animal sheds. CAAS is a relatively new complex and possibly as a consequence, no energy efficiency opportunities with paybacks of less than 4 years were identified by the audits.
Two of the audit report‘s recommendations concerned hot water heating. Recommendations were made to replace electric resistance storage heaters with heat pumps or to augment the systems with solar collectors. Retrofitting the relatively new existing equipment at CAAS was not considered cost effective, but the University thought there that retrofitting hot water plant close to end of life would be viable. As a consequence during 2011/12 the University reviewed how water is heated at Gatton and noted other opportunities for improvement, such as converting the electric hot water heaters at the Halls of Residence to solar electric and heat pump water heating. Using heat recovery from refrigeration to heat water was another opportunity noted.
A detailed survey was undertaken of the hot water systems at the Halls of Residence. The Halls can accommodate around 450 people and provide hot water for showers and clothes washing. They have some LPG water heating systems but most of hot water demand is met via electric storage heaters. The total installed capacity is just over 180kW. Detailed retrofit plan based on these surveys are now developed.
The expansion of the dairy herd at Gatton revealed shortcomings in the system used to supply hot water for washing down and equipment flushing. Electric resistance heating was used to provide this water. Like most dairies the one at Gatton had a large refrigeration unit to cool the milk holding vat. During 2011/12 a project was developed to use the waste heat from the refrigeration unit to preheat the water needed for washing and
transferred to the atmosphere via a radiator and a fan. This project was completed during 2011/12. It is expected to save approximately 15,000 kWh in electricity per year or about $1,500 in running costs.
During 2011/12 the University investigated an opportunity at Gatton to treat piggery and other waste streams via anaerobic digestion to produce methane. Solar thermal and photovoltaic power opportunities were also investigated at Gatton during 2011/12. It may be possible to integrate these opportunities with other energy service proposals under investigation at Gatton in a way that reduces energy consumption overall. This possibility will be investigated further in 2012/13.
An electrical meter documentation exercise, similar to that carried out at the St Lucia campus, was completed at Gatton during 2011/12. Meter locations and other attributes were entered into an asset management data base and single line diagrams showing the campus electrical reticulation and meter positions were drawn up. This work will assist with the identification of energy efficiency opportunities in future years.
Name of entity
Ipswich CampusTotal energy use in the last financial year 15,226 GJ
Total percentage of energy use assessed 16.32% %
Description of the way in which the entity carried out its assessment
The UQ Ipswich Campus is located at Ipswich, approximately 40km west of Brisbane. The campus was established in 1999 on the site of an historic mental health facility. The campus consists of a mix of heritage buildings and relatively modern facilities. At Ipswich the University provides teaching, research and clinical activity in the Health Sciences, but also offers programs in the Arts and Education.
During 2010/11 two energy related initiatives took place at Ipswich. The production and distribution of chilled water was reviewed by consultants in the context of developing a chilled water master plan. The local electricity distribution company, Energex, requested the University also explore the potential for peak load reduction in the course of developing the master plan. Subsequently, a chilled water thermal energy storage (TES) proposal was developed for the Ipswich Campus. The TES project had the potential to save energy as well as shift load to off‐peak periods. The cost to the University of a TES system turned out to be very high and a decision was taken not to proceed with the project. Experience with this project has, however, encouraged the University to explore a similar concept at its Gatton Campus were a number of factors may make TES more viable.
During 2011/12 the university conducted a detailed light technology survey of all the interior lighting at the Ipswich campus. The type, number and location of all fittings and lamps were recorded in an Access database. This information was then assessed to identify energy efficiency retrofit opportunities based on replacing lamps, de‐lamping and installation of sensor controls, etc. The retrofit projects are planned for 2012/13.
Outdoor lighting was also reviewed at Ipswich. There are over 200 pole mounted outdoor lights at Ipswich each containing a 70W sodium lamp. Trials were conducted where the sodium lamp was replaced with a 24W compact fluorescent lamp. Light levels remained satisfactory so this retrofit is now being rolled out.
An electrical meter documentation exercise, similar to that carried out at the St Lucia campus, was completed at the Ipswich campus during 2011/12. Meter locations and other attributes were entered into an asset management data base and single line diagrams showing the campus electrical reticulation and meter positions were drawn up. This work will assist with the identification of energy efficiency opportunities in future years.
Name of entity
Moreton Bay Research StationTotal energy use in the last financial year 1,203 GJ
Total percentage of energy use assessed 0 %
Description of the way in which the entity carried out its assessment
UQ’s Moreton Bay Research Station (MBRS) is located at Dunwich on North Stradbroke Island which is on the eastern side of Moreton Bay and about 45km east of Brisbane. The MBRS is used to conduct marine research, to provide teaching facilities for University and secondary school students and it is also used as a conference venue.
In view of the high cost of electricity supplied to the MBRS, consultants were engaged to examine the feasibility of using renewable energy sources, namely solar hot water heating and PV to supply some of the Station’s needs. During 2010/11, the University also engaged with consultants and the local electricity distribution company, Energex, to study peak load reduction opportunities at the MBRS. These studies improved our knowledge of the MBRS load profile and energy distribution across end uses and also indicated some general opportunities for energy efficiency improvements.
One general opportunity related to lighting retrofits. Subsequently the University conducted a detailed survey of the lighting at the MBRS and drew up a scope of work for improvements, which mainly consisted of replacing T8 fluorescent tubes withT5 tubes and the use of voltage controllers. The work is scheduled for completion early 2012/13.
Another opportunity related to water heating. The hot water system at MBRS is based on electric resistance storage cylinders and a pumped circulation loop. The existing shower heads were replaced with super low flow heads which lowered hot water use by almost 15%. The circulation pump was placed on a timer and this has reduced heat losses from the long pipe network. The pipe insulation was also improved. Finally a solar collectors and storage tanks were installed.
Solar heat gain through north to part of the MBRS is substantial and adds to the air conditioning load. During 2011/12 an opportunity was recognised to address this issue through installation of reflective window film. This work is scheduled for completion in 2012/13.
The renewable energy feasibility study mentioned above has led to a 40kW PV installation on the roof of the MBRS, completed in November 2011. While this does not qualify as an opportunity in terms of EEO legislation, the panels themselves create a secondary efficiency gain; they provide significant shade to the research station roofs thus, reducing solar heat gain and load on air conditioning equipment. It is difficult to quantify this benefit at present but it is the subject of research at the University. The renewable energy feasibility and load reduction studies also revealed that energy management at the MBRS would be improved by the installation of sub‐meters and a power quality meter. This work was completed during 2011/12 and is now assisting with the identification of further energy efficiency opportunities at the MBRS.
Name of entity
Heron Island Research StationTotal energy use in the last financial year 1,732 GJ
Total percentage of energy use assessed 0 %
Description of the way in which the entity carried out its assessment
Heron Island is located 72km NE of Gladstone, off the central Queensland coast. The island has the Delaware North Heron Island Resort, a Queensland Parks and Wildlife Service Ranger Station and the University’s Heron Island Research Station (HIRS).
During 2010/11 Wide Bay Water Corporation managed a Commonwealth Government Green Precincts Project which was designed to improve energy efficiency, reduce water use and reduce the carbon footprint of activities on this World Heritage Site. Wide Bay Water Corporation arranged a comprehensive audit by external consultants of energy and water use at the HIRS. Subsequently Wide Bay Water Corporation worked with UQ to action many of the audit recommendations. The University funded around two thirds of the cost of implementation and the balance came from the Green Precincts program.
One of the key Green Precincts projects, a 54kW photovoltaic installation, does not qualify itself as an EEO project, but the presence of solar panels on the roofs of the research Station is thought to reduce solar heat load and thus reduce electricity used for air conditioning.
Super low flow shower heads were installed resulting in energy savings of around 15% from the need to heat less hot water. Water on the island comes from the Resort’s desalination plant, so such water efficiency measures reduce the diesel consumption of the Resorts generators. This saving has not been attributed to UQ in this EEO report.
The key projects that saved energy at the HIRS were: installing a variable speed (VS) drives; improved control on the HIRS seawater pump that supplies water to the teaching and research aquariums; placing timers on the air conditioning equipment so that it switches off when people are not present; improving the controls on food cold‐rooms and freezers; and making improvements to lighting. These were all completed in 2010/11.
During 2011/12 an opportunity was identified to replace an existing compressor on the island with a more energy efficient model. The compressor in question was used to provide air to an ongoing climate change experiment. This experiment runs 24 hours a day, every day, so the compressor’s duty cycle is high and the potential energy saving from a more efficient model is considerable. The replacement is scheduled for the first half of 2012/13.
During 2011/12 in order to facilitate identification of further opportunities, a complete inventory was created of all the plant equipment and lighting at the Research Station. The type of equipment, its location and rated load were noted in a database. This information will be reviewed during 2012/13 and viable energy efficiency opportunities will be implemented.
Name of entity
Long PocketTotal energy use in the last financial year 2,981 GJ
Total percentage of energy use assessed 10.83% %
Description of the way in which the entity carried out its assessment
The Queensland State Government made facilities at its Long Pocket site available to the University after the January 2011 Brisbane River flood. The site is near Indooroopilly and about ten minutes by shuttle bus from the main campus at St Lucia. Prior to its use by UQ, the site was used by State Government land, natural resource and environmental agencies (DERM and DEEDI). Only part of the site was occupied by UQ in 2011/12 with the rest lying largely vacant. Discussions between UQ and the State Government will determine the long term role for UQ at the Long Pocket site. Walk through audits in late 2010/11 and 2011/12 in advance of UQ occupying given floor areas indicated that opportunities existed for the lighting to be improved by retrofitting more efficient lamps or installing occupancy sensors. These opportunities were implemented during 2011/12. Once the long term future of the site is determined UQ will be able to review other energy services such as the air conditioning systems.
Name of entity
Indooroopilly MineTotal energy use in the last financial year 3,707 GJ
Total percentage of energy use assessed 17.04% %
Description of the way in which the entity carried out its assessment
The University of Queensland Experimental Mine is located at Indooroopilly a suburb of Brisbane. It is situated on a moderately steep slope bordering Witton Creek some 200m from the Brisbane River. The site has a mining history dating back to 1918 when silver/lead mineralisation was discovered. It now has a number of surface office, teaching and maintenance buildings as well as subsurface mine features.
The UQ School of Mechanical and Mining Engineering operate out of the site. The Julius Kruttschnitt Minerals Research Centre (JKMRC), now part of the UQ Sustainable Minerals Institute (SMI), also shares surface infrastructure at the site.
During 2011/12 the university surveyed the lighting in the surface buildings at the Mine site. Information on fitting and lamp locations, type, number and control were recorded in an Access database. This has revealed a number of retrofit opportunities which will be reviewed and where
appropriate developed into scopes of work for implementation during 2012/13.
Table 2.2 - Energy efficiency opportunities identified in the assessment
St Lucia
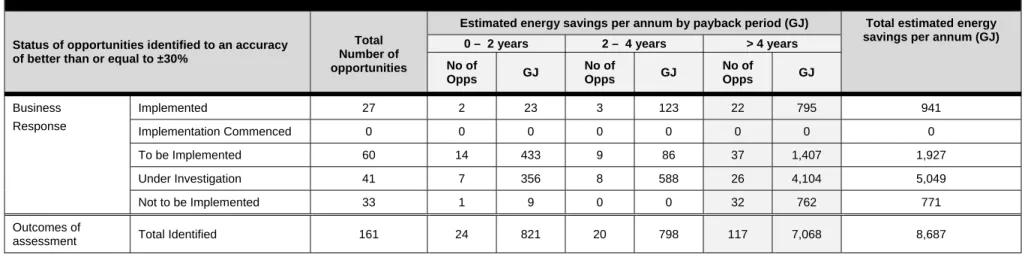
Status of opportunities identified to an accuracy of better than or equal to ±30%
Total Number of opportunities
Estimated energy savings per annum by payback period (GJ) Total estimated energy savings per annum (GJ) 0 – 2 years 2 – 4 years > 4 years
No of Opps GJ No of Opps GJ No of Opps GJ Business Response Implemented 27 2 23 3 123 22 795 941 Implementation Commenced 0 0 0 0 0 0 0 0 To be Implemented 60 14 433 9 86 37 1,407 1,927 Under Investigation 41 7 356 8 588 26 4,104 5,049 Not to be Implemented 33 1 9 0 0 32 762 771 Outcomes of
assessment Total Identified 161 24 821 20 798 117 7,068 8,687
Please note that Corporate Groups are not required to report opportunities with a payback greater than 4 years. Reporting this data is voluntary.
Gatton
Status of opportunities identified to an accuracy of better than or equal to ±30%
Total Number of opportunities
Estimated energy savings per annum by payback period (GJ) Total estimated energy savings per annum (GJ) 0 – 2 years 2 – 4 years > 4 years
No of Opps GJ No of Opps GJ No of Opps GJ Business Response Implemented 1 0 0 1 54 0 0 54 Implementation Commenced 0 0 0 0 0 0 0 0 To be Implemented 0 0 0 0 0 0 0 0 Under Investigation 1 0 0 0 0 1 124 124 Not to be Implemented 3 0 0 0 0 3 200 200 Outcomes of
assessment Total Identified 5 0 0 1 54 4 324 378
Ipswich
Status of opportunities identified to an accuracy of better than or equal to ±30%
Total Number of opportunities
Estimated energy savings per annum by payback period (GJ) Total estimated energy savings per annum (GJ) 0 – 2 years 2 – 4 years > 4 years
No of Opps GJ No of Opps GJ No of Opps GJ Business Response Implemented 0 0 0 0 0 0 0 0 Implementation Commenced 0 0 0 0 0 0 0 0 To be Implemented 1 0 0 1 145 0 0 145 Under Investigation 0 0 0 0 0 0 0 0 Not to be Implemented 1 0 0 0 0 1 1,260 1,260 Outcomes of
assessment Total Identified 2 0 0 1 145 1 1,260 1,405
Please note that Corporate Groups are not required to report opportunities with a payback greater than 4 years. Reporting this data is voluntary.
Moreton Bay Research Station
Status of opportunities identified to an accuracy of better than or equal to ±30%
Total Number of opportunities
Estimated energy savings per annum by payback period (GJ) Total estimated energy savings per annum (GJ) 0 – 2 years 2 – 4 years > 4 years
No of Opps GJ No of Opps GJ No of Opps GJ Business Response Implemented 0 0 0 0 0 0 0 0 Implementation Commenced 0 0 0 0 0 0 0 0 To be Implemented 4 0 0 4 45 0 0 45 Under Investigation 0 0 0 0 0 0 0 0 Not to be Implemented 0 0 0 0 0 0 0 0 Outcomes of
assessment Total Identified 4 0 0 4 45 0 0 45
Heron Island Research Station
Status of opportunities identified to an accuracy of better than or equal to ±30%
Total Number of opportunities
Estimated energy savings per annum by payback period (GJ) Total estimated energy savings per annum (GJ) 0 – 2 years 2 – 4 years > 4 years
No of Opps GJ No of Opps GJ No of Opps GJ Business Response Implemented 7 0 0 2 203 5 73 276 Implementation Commenced 0 0 0 0 0 0 0 0 To be Implemented 15 0 0 0 0 15 96 96 Under Investigation 0 0 0 0 0 0 0 0 Not to be Implemented 0 0 0 0 0 0 0 0 Outcomes of
assessment Total Identified 22 0 0 2 203 20 169 372
Please note that Corporate Groups are not required to report opportunities with a payback greater than 4 years. Reporting this data is voluntary.
Long Pocket
Status of opportunities identified to an accuracy of better than or equal to ±30%
Total Number of opportunities
Estimated energy savings per annum by payback period (GJ) Total estimated energy savings per annum (GJ) 0 – 2 years 2 – 4 years > 4 years
No of Opps GJ No of Opps GJ No of Opps GJ Business Response Implemented 6 2 152 1 1 3 18 171 Implementation Commenced 0 0 0 0 0 0 0 0 To be Implemented 0 0 0 0 0 0 0 0 Under Investigation 0 0 0 0 0 0 0 0 Not to be Implemented 0 0 0 0 0 0 0 0 Outcomes of
assessment Total Identified 6 2 152 1 1 3 18 171
Indooroopilly Mine Site
Status of opportunities identified to an accuracy of better than or equal to ±30%
Total Number of opportunities
Estimated energy savings per annum by payback period (GJ) Total estimated energy savings per annum (GJ) 0 – 2 years 2 – 4 years > 4 years
No of Opps GJ No of Opps GJ No of Opps GJ Business Response Implemented 0 0 0 0 0 0 0 0 Implementation Commenced 0 0 0 0 0 0 0 0 To be Implemented 6 0 0 0 0 6 71 71 Under Investigation 0 0 0 0 0 0 0 0 Not to be Implemented 0 0 0 0 0 0 0 0 Outcomes of
assessment Total Identified 6 0 0 0 0 6 71 71
Table 2.3 - Details of significant opportunities identified in the assessment
Corporate Groups are required to provide at least 3 examples of significant opportunities for improving the energy efficiency of the group that have been identified in assessments.
Opportunity
1
–
Metering,
Meter
Inventory,
Prioritization
and
Expansion
Voluntary InformationA comprehensive, readily accessible metering system is a vital tool for identifying energy efficiency opportunities, analysing these and then monitoring the results of subsequent efficiency projects. A good metering system will also facilitate public communication and education through such means as website or building foyer displays of real time energy use and comparisons with benchmarks or the performance of other buildings.
At July 2010, UQ was thought to have a substantial electrical sub‐metering network but details of the system were not consistently documented and interrogating the system to analyse energy patterns was time
consuming. A program to systematically address these issues was rolled out during 2010/11 and continued in 2011/12:
Key Opportunities realised:
• Digital Power Meters were Documented and an Asset Management Database was created;
• A Strategic Review was undertaken to Identify Priority Meters and Metering Gaps
• Chilled Water Energy Meters and Power Meters were installed on Chillers.
• A software application was procured to enable the meters to be monitored in real time.
Metering schematics were prepared showing the position of meters on the high voltage and low voltage networks and hence the loads or sub‐ networks metered. The schematics contain a communication layer so that it is possible to visualise the relationship of meters to the IT network. Accurate metering schematics have enabled the identification of opportunities to create virtual meters and to cover gaps in the network. The schematics have been organised into a library linked directly to the meter management database (outlined shortly). Users can toggle between meter attributes in the management database and a visualisation of meter location and IT arrangements. Figure 2 shows an example of metering schematic.
Electrical power meters have a range of attributes that are important both for asset management and meter interrogation. Key attributes are: the IP address of the gateway that connects the meter to the LAN; the physical location of the meter; and the nature of the load monitored by the meter (its location and type ‐ chiller, cooling tower, building light and power etc.). The Microsoft access database enables reports to be run on existing meters and allows new meters to properly documented and added to the system. It also plays an
Equipment Type Business Response Energy saved (GJ) Greenhouse gas abated (CO2-e) $s saved Payback period
consumption and trends from specific meters. The database contains meters that measure on‐site power production as well as consumption. Figure 3 shows an extract from a report resulting from a search for all meters at the St Lucia Campus that measure PV output.
The metering schematics, the management data base and other information have enabled a strategic overview of metering at UQ and the subsequent identification of gaps. The UQ St Lucia campus for example has 33 buildings with GFA greater than 5,000m2. Of these buildings almost half – 15 buildings – do not have sufficient metering to enable a determination of the electrical consumption of the building. During 2011/12 scopes of work were developed to roll out enough meters to cover these gaps and most of the necessary meters were installed.
Air conditioning at UQ is mainly provided via chilled water networks serving air handling units or fan coil units. The central plant produces chilled water which is then distributed to buildings within the chiller precinct. In one case, 13 buildings are served by a single chiller station with three chillers. The energy consumed in the production of chilled water can represent 30% or more of the energy consumed in a
building. Accounting for this energy is important when benchmarking buildings and monitoring changes in AC scheduling, adjustment of space set‐points or making other improvements. At the start of 2010/11 the production and distribution of chilled water “energy” was not metered a UQ.
A program of works has been established to meter the production of chilled water from individual chillers and also to separately meter the electrical input to chillers, pumps and cooling towers. At the end of 2010/11 the University started to install thermal meters on chillers and building chilled water off‐takes and continued this work through 2011/12. To date meters have been installed on seven chiller stations and three buildings.
As a result:
1. The efficiency of metered chillers (COP) can now be monitored to identify opportunities for changes in maintenance or operation to improve energy efficiency; and
2. The total electrical input to the production of chilled water can be determined and expressed as kWh per litre of chilled water per oC – or as kWh per GJ of heat rejected.
Most buildings already have flow meters that measure the amount of chilled water diverted to the building. Where suitable these flow meters will be converted progressively to chilled water energy meters by the addition of suitable temperature sensors. If the flow meter is not suitable it will eventually be replaced with one that is suitable for energy monitoring. Once this is done it will be possible to assign a share of the electrical energy used to produce and circulate chilled water through particular buildings. As mentioned earlier, this will facilitate better energy management of the buildings. Figure 3 shows an extract from the schematic for the Central Chiller Station metering schematic showing the chilled water thermal meter (CWM) the electrical meter monitoring the chiller motor (DPM) and a virtual meter that monitors the chiller
coefficient of performance (COP).
At the start of the EEO cycle UQ had a system of data acquisition, retrieval and rendering that enables tables and graphs of energy consumption and trends to be produced using metering data. A considerable amount of manual handling of data was needed, however, to get good results.
During 2011/12, UQ trialled a new software front end that creates a user friendly reporting system – a system that can be readily used by students, researchers, facilities engineers and consultants. UQ intends to roll out the system during 2012/13. This will improve overall visibility of energy use patterns and this in turn is expected to lead to identification of a greater number of energy efficiency opportunities than is presently possible.
Figure 4: Chilled Water Metering Schematic ‐ Example
Opportunity
2
–
Lighting
Surveys,
Data
Management
and
Retrofits
Voluntary InformationBuilding audits conducted during 2010 revealed a common theme; opportunities were present to improve lighting through a range of measures:
• Retrofitting T5 fluorescent tubes in suitable T8 fittings (those with electromagnetic ballasts);
• Swapping 50W dichroic lamps with 35W high efficiency infrared coating (IRC) lamps;
• Replacing 50W lamps with LEDs where existing light levels were higher than needed;
• De‐lamping – removing one tube from a twin fitting where light levels were high; and
• Fitting voltage controllers to T8 magnetically ballasted fluorescent lighting circuits
• Installing passive infrared (PIR) occupancy sensors and piezoelectric (PE) daylight sensors to turn lights off when not needed.
The challenge faced by UQ was to develop a cost effective way of realising these opportunities without creating unintended consequences now, or maintenance problems down the track. The following strategy was adopted:
1. Conduct trials to identify pro and cons of each approach and develop scopes of work; 2. Establish some rules of thumb to identify the characteristics of cost effective opportunities; 3. Create a light technology survey methodology and data management system;
4. Prove the survey and management system through a whole building trial 5. Progressively retrofit the lighting groups of buildings with efficient lighting.
Installing PIR sensors in multi‐cubicle toilet blocks can, for example, create a problem if lights switch off while people are still present, but are not detected by a sensor. A solution was successfully trialled: installation of low wattage light‐emitting diode (LED) pilot lights that remain on when the main lights are turned off by the PIR. This solution provides a good balance of energy efficiency, OH&S and personal security. Through various trials the limitations of each approach were discovered and necessary mitigation measures were established.
Lighting audits often recommend generic upgrades (replace T8 fluorescent tubes with T5 tubes), but any given opportunity may not be cost effective in a particularly situation. On the other hand, the cost of doing a detailed financial analysis for every case creates an overhead that can counter the benefits of a particular proposal. This issue is usually dealt with by using rules of thumb – generalisations about the scale or thresholds within which a type of project remains cost effective. Rules of thumb are easy
Equipment Type Business Response Energy saved (GJ) Greenhouse gas abated (CO2-e) $s saved Payback period
UQ, like other universities, is an expensive place to carry out retrofit work. Meanwhile as a mixed blessing, as a bulk purchaser, UQ is able to obtain electricity on very favourable terms. This means that standard energy efficiency rules of thumb do not readily apply at UQ.
In the course of conducting lighting trials UQ was also able to develop its own rules of thumb or the range of lighting opportunities listed above. Voltage controllers, for example, come in different sizes. For each size, the minimum number of tubes that need to be connected to the controller, to create a cost effective outcome, was determined. Similarly the minimum amount of lighting (wattage) that should be controlled by a PIR to make this retrofit worthwhile was also established. This means that the University now has some idea of the opportunities it should be looking for.
The next challenge that faced UQ was finding the opportunities. Buildings at the St Lucia campus, for example, contain a mixture of very old fit‐outs and new refurbishment. A single floor could contain a wide range of lighting technologies. The most cost effective work process for UQ was to identify the lighting technology in place, review it, identify specific retrofit opportunities and then let contracts to carry out the work. Electrical contractors could then plan around a specific number and type of retrofit for each building. They would also know the exact location of each opportunity (building, floor and room number).
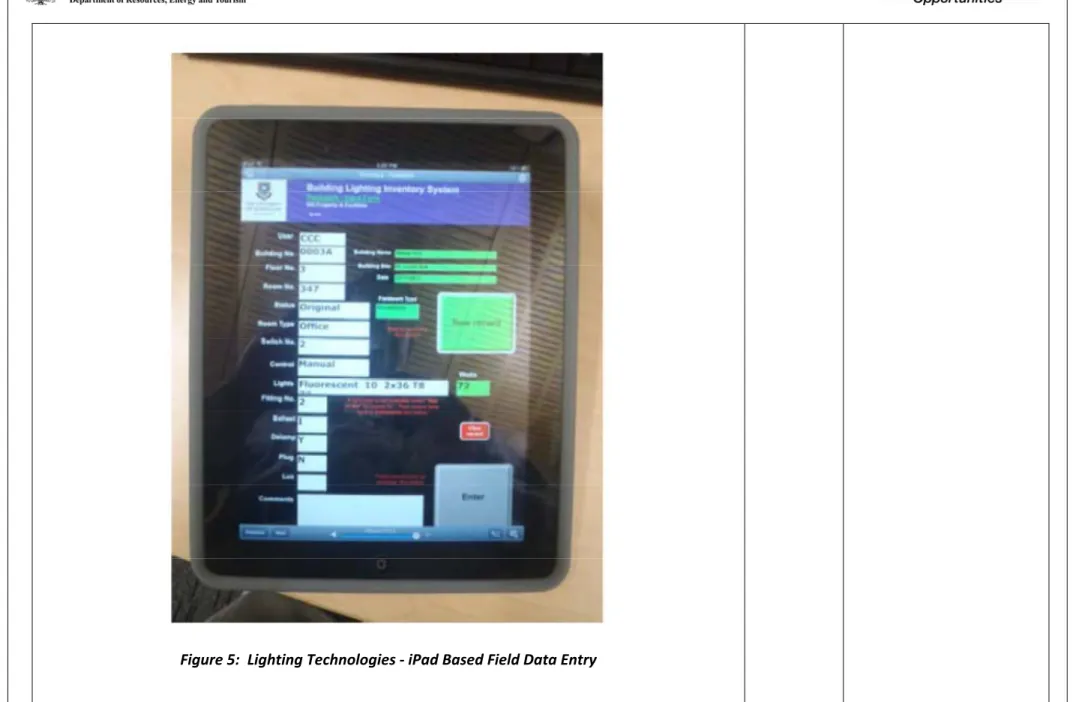
Consequently a lighting survey methodology was developed. Initially a system using handwritten records and entry to Excel was used. Then to increase productivity and reduce entry error, an iPad based field data entry system was developed (Figure 5 below). The full system was then tested from survey through to retrofit at a full scale building scale. A combination of lighting improvement measures were applied to the JD Story Building, one of the main administration buildings on the St Lucia campus. This was highly successful. 122 T8 tubes and 77 50H lights were replaced by T5 tubes and LEDs, respectively.
Subsequently, a second more challenging building was retrofitted. The survey based approach is now considered proven. In 2010/11 and 2011/12, further buildings were surveyed at St Lucia and other campuses or sites. During 2011/12, contracts were let for the lighting retrofit of a tranche of 8
buildings on the St Lucia Campus. Retrofits of indoor lighting have also been implemented at Moreton Bay Research Station and the Long Pocket campus.
Opportunity 3: Chiller Optimisation Package Voluntary Information
The installation of permanent electrical and thermal meters on the chillers in the Central Chiller Station has enabled chiller performance to be monitored. Low coefficients of performance were observed especially at low load. The current operating regime for the chillers, cooling towers and associate pumps is fairly rudimentary. Condenser water flow, cooling tower staging and chillers load are not closely matched, for example. The chilled water set‐point is also fixed rather than allowed to float slightly with the load. It is possible to operate a chiller station and its cooling towers in a closely matched manner to optimise service delivery and energy efficiency.
A combination of the right equipment and a suitable control strategy is needed to achieve optimal performance. During 2011/12 the University explored this opportunity further and is now considering proposals to retrofit a chiller optimisation package on the Central Chiller Station.
The work needed involves installation of a combination of new hardware and software:
• Installation of Three (3) 45kW Variable Speed Drives for Condenser Water Pumps
• Installation of Ten (10) 5.5kW Variable Speed Drives for Cooling Tower Fans
• Installation of differential pressure transducers and temperature sensors as required
• Installation of Chiller Optimisation unit to control: a) Three (3) Centrifugal Chillers
b) Three (3) Existing Chilled Water Pump Variable Speed Drives
c) Three (3) Newly supplied/Installed Condenser Water Pump Variable Speed Drives d) Ten (10) Newly supplied/Installed Cooling Tower Fan Motor Variable Speed Drives e) Primary Chilled Water Bypass Valves
• Provide a software package to provide system visibility and control via desktop and HMI
• Install HMI in the plant room to provide local visibility and control.
This type of retrofit can typically yield energy savings of up to 25%. Installation of a suitable
optimisation package on the Central Chiller Station as a trial is planned for 2012/13. If it is successful then similar packages could be installed on the other chiller stations at UQ sites.
Equipment Type
Chiller Station Retrofit:
Variable Speed Drives, ChW Bypass Central Control Unit and IT Equipment
Business
Response TBI (To Be Implemented) Energy saved (GJ) 3,168 Greenhouse gas abated (CO2-e) 783.2 tones
$s saved $88,000 per year
Payback period
1.75 years
Part 3 – Transition to Second Cycle
This table should only be completed by 2005-06 trigger-year corporations transitioning to the second cycle.
In December 2011 many corporations reported energy efficiency opportunities that were still under investigation as at 30 June 2011. This report should advise what your business response to these opportunities has been – implemented or not to be implemented. If you intend to further investigate these opportunities, they should be reported in the future Public Reports as opportunities identified in the second cycle.
Status of opportunities identified to an accuracy of better than or equal to ±30%
Total Number of opportunities
Estimated energy savings per annum by payback period (GJ) Total estimated energy savings per annum (GJ) 0 – 2 years 2 – 4 years > 4 years
No of Opps GJ No of Opps GJ No of Opps GJ As reported in December 2011 Under Investigation Business Response as at 30 June 2012 Implemented Not to be Implemented To be evaluated/reported in the second cycle