Policy Research Working Paper
5267
Micro Efficiency and Macro Growth
Raj Nallari
Nihal Bayraktar
The World Bank
World Bank Institute
Growth and Crisis Unit
April 2010
WPS5267
Public Disclosure Authorized
Public Disclosure Authorized
Public Disclosure Authorized
Abstract
The Policy Research Working Paper Series disseminates the findings of work in progress to encourage the exchange of ideas about development issues. An objective of the series is to get the findings out quickly, even if the presentations are less than fully polished. The papers carry the names of the authors and should be cited accordingly. The findings, interpretations, and conclusions expressed in this paper are entirely those of the authors. They do not necessarily represent the views of the International Bank for Reconstruction and Development/World Bank and its affiliated organizations, or those of the Executive Directors of the World Bank or the governments they represent.
Policy Research Working Paper 5267
This paper is about micro foundations of productivity and growth. There are several studies on productivity for advanced economies but relatively few for developing countries. Using data from the investment climate surveys of the World Bank, estimation results from 45 developing countries, complemented by extended analysis at firm and industry levels for Brazil and India for the period 2002–05, indicate the following: (i) confirmation of the importance of total factor productivity at firm, industry and national levels, but total factor productivity progressively tapers off at each level of aggregation implying that there is a less than one-to-one relationship between micro-efficiency, sector growth, and macro growth; (ii) capital accumulation is more important at the macro level than the micro level; (iii) productivity at the micro level is driven by research and development,
This paper—a product of the Growth and Crisis Unit, World Bank Institute (WBI)—is part of a larger effort in the department to share knowledge with policy makers and practitioners for which WBI is preparing a Flagship Course on Pathways to Development. Policy Research Working Papers are also posted on the Web at http://econ.worldbank.org. The author may be contacted at [email protected].
the capacity utilization rate, and adoption of foreign technology (all of which involve management decisions), and is negatively related to corruption and instability, tax, and financial regulations; and (iii) confirmation of the lower contribution of total factor productivity to output growth in developing countries than in developed economies. Management decisions are involved in a lot of day-to-day operations at the firm level and therefore management is an unmeasured input. In developing countries, at the firm level, there is a need to understand the contribution of quality of inputs (management quality, education and labor quality, training, experience of workers, use of computers at work) and also the role of external agglomeration (for example, location in a booming city, competitive pressures from new firms, trade competition, and regulations).
Micro
Efficiency
and
Macro
Growth
Raj Nallari 1
Nihal Bayraktar
1 Authors’ emails: [email protected] and [email protected]. The authors wish to thank Chunfang
2
Micro
Efficiency
and
Macro
Growth
Introduction
In trying to understand the rapid output growth of East Asian ‘miracle’ countries, Krugman (1994),
Young (1995), and others were engaged in an interesting debate on whether capital accumulation or
total factor productivity growth best explained the high and sustained output growth of these countries.
Their conclusion that capital accumulation was most important was based on macroeconomic data
analysis in a factors‐of‐production approach to sources of growth. Others have found that the growth of output is strongly correlated with productivity growth in developed and developing economies as reported by Kehoe and Prescott (2002) and Solimano and Soto (2004), and this co-movement appears to be
stronger the longer is the time period considered.
This analysis would have been even more interesting if these researchers looked at microeconomic
evidence for the same set of countries for the same time period to re‐confirm their results. This would
have also enabled them to understand the differences in TFP in each of the East Asian countries and its
impact on growth. It is possible that some countries are propelled by physical and human capital while
others by TFP. For example, Collins and Bosworth (2003) analyzed data from 84 countries for the period
1960 to 2000 and found that capital accumulation and productivity growth both contribute to output
growth. At the global level, they found that the contribution of capital and productivity is roughly equal
but there have been substantial variations in their relative contribution across countries and time.
Growth analysis has primarily been a macroeconomic subject with its emphasis on contribution of capital, labor or human capital to output growth and the role of total factor productivity (see Collins and Bosworth 1996, Hu and Khan, 1997, Sarel 1997, Sala-i-Martin 2004, Hall and Jones, 1999, Easterly and Levine 2001). These studies provided varying conclusions. Mankiw, Romer and Weil (1992) found that physical and human capital accounted for 80 percent of variation in percapita income across countries, while Klenow and Rodriquez-Clare (1997) emphasize productivity growth as accounting for 90 percent of income per capita variation, while Easterly and Levine (2001) emphatically state that it is not factor accumulation.
Before the recent availability of micro‐level databases, the macroeconomic approaches to study
of productivity suffered many shortcomings, such as measuring productivity as residual in
macro‐level production functions or treating it as a measure of technical change. In particular,
total factor productivity is measured as a residual and as growth is determined by many factors. Moreover, accounting framework should not be used for causes of growth as many factors are endogenous to the growth process.
As the number of micro‐level (firm or plant‐level) empirical studies, focusing on productivity
increased during the past decade, they have started to raise many questions on understanding
3
the efficiency of the economy at the micro level to allocate inputs and outputs across
businesses.2 It has been presented in empirical studies that the microeconomic foundations of
economic growth are quite complex and noisy. As pointed out by Foster, Haltiwanger, and
Krizan (1998), Haltiwanger (2002) and Bartelsman and Doms (2000), major micro facts about
productivity are:3 1) There is a large scale, continuous reallocation of input and output across
individual producers (Schumpeterian creative destruction). 2) The speed of reallocation
changes overtime. 3) Reallocation is mainly within the sector (entry and exit of businesses)
rather than between sectors. 4) Persistent differences in productivity across firms in the same
sector. 5) Low productivity helps predict exit. These microeconomic facts suggest that the
major source of aggregate productivity growth is more productive expanding businesses
displacing less productive contracting ones (i.e. reallocation of resources).
Persistent differences observed in productivity imply that the same level of inputs produces
different amount of output. Such differences exist across micro units ‐even in narrowly defined
industries, ‐ as well as across countries. For example, Syverson (2004) calculates that, when U.S.
firms are ranked by their productivity levels in narrowly defined industries, the 90th percentile
produces twice more output compared to the output produced by the 10th percentile on
average, given that they are using the same amount of input. This gap is even larger in India and
China (see Hsieh and Klenow (2009)). They calculate the same measure of the productivity gap
around 5 to 1 in some industries in these two countries. While trying to explain the possible
reasons for the existence of such a large gap in productivity levels, Hsieh and Klenow (2009)
emphasize the importance of resource misallocation which may significantly lower aggregate
productivity. They conclude that if India and China could have allocated their resources better
at the level available in the United States, the improvement in their productivity would have
been significantly higher, around 30‐50 percent.
There is a continuous reallocation between or within sectors, but this process cannot produce
the desired outcome in each country or industry. The ultimate effect of this reallocation
process on aggregate productivity is determined by country‐specific factors such as market
structure, institutions, regulations, structural and aggregate shocks, technology, and human
capital. Because of such differences, the timing, size and nature of reallocation become
significant in determining productivity. If they are not planned well, such changes may lead to
misallocation of resources and even lower values of productivity. Especially in developing
countries, there are different barriers, such as market distortions, market institutions or
2 Bosworth and Collins (2007), for example, investigate the sources of economic growth in China and India,
focusing on sectors. They show that India’s growth is stronger in the service sector, while China’s growth is across
all agriculture, industry and service. Their growth is explained by both increases in capital per labor and also total
factor productivity, and depends on their integration with global economy. 3 Also see Tybout (2000) and Syverson (2009) for literature review.
4
policies, to support an efficient allocation process. Misallocation that is caused by these barriers
is considered as one of the major reasons for large differences in the productivity levels
between rich and poor countries, and in turn as an important source of differences in growth
performances. Given this clear significance of productivity in growth, it is essential to identify
possible sources of misallocation that prevent productivity growth in most developing countries
and how to improve it so that productivity can rise after adjustments. This issue gets even more
critical while setting growth promoting policies that specifically target productivity
improvements.
This paper takes up the challenge to estimate and analyze the determinants of output growth
both at the micro (firm), meso (industry) and macro (national) levels in a sample of 45
countries, for which data are available, for the period 2002‐05. The purpose is to understand
the micro‐foundations of macroeconomic growth, including the issue of whether there are
significant differences in TFP across firms, countries, and regions.
The approach used to estimate the sources of growth is the standard Cobb‐Douglas production
function, and the aim is to estimate the parameters pertaining to the contribution of physical
capital, labor and total factor productivity (TFP) to output growth at the firm and national
levels.
There are many studies available in the literature emphasizing the importance of first three
external factors in productivity. The impact of spillovers on productivity is observed basically in
close businesses in terms of geography and technology. Moretti (2004), Bloom, Schankerman,
and Van Reenen (2007), Keller and Yeaple (2009) all show that spillovers can be a significant
determinant of productivity. But given the persistence of productivity levels, it is not clear how
effective spillovers are. As presented by Holmes, Levine and Schmiz (2008), higher competition
can be another factor determining productivity since it forces firms to adopt new technologies
to reduce the cost, which increase their productivity. Competition also cuts the market share of
less productive so that productive ones get more dominant in the market. The source of higher
competition can be domestic markets (Schumpeterian creative destruction) through
completion enhancing policies or international markets through trade liberalization. As shown
by Petrin and Sivadasan (2006), Hsieh and Klenow (2009) and Bartelsman, Haltiwanger, and
Scarpetta (2008), if input markets are flexible, productivity tends to be higher due to easier
allocation of inputs and funds across businesses.
The last major external factor determining productivity which will be the major focus could be
on the role of policies and regulations, especially the ones aiming to improve the first three
external factors: spillovers increase the level of competition and flexibility in markets. They can
5
and reforms are considered one of the major factors explaining the productivity differences
across countries or across industries in a country, their timing and magnitude can be critical for
productivity gains, especially, in developing countries.
Many cross‐country or single country studies show that policies and reforms are significant
sources of improving productivity through reallocation of inputs and outputs.4 One of the
commonly investigated policies is trade policies. In the literature, the link between trade
policies and productivity gains are explained through different mechanisms such as higher
competition introduced via more availability of imported products in domestic markets, lower
cost of imported inputs, higher competition in international markets, technology spillover, or
competitive elimination of less productive businesses. For example, Bernard and Jensen (1999)
show that the overall contribution of exporters to U.S. manufacturing productivity growth.
Following this study, Bernard, Eaton, Jensen, and Kortum (2000) create a model explaining
plant‐level heterogeneity in exporting and productivity and test it for U.S plants. In a study
where empirical studies are summarized, Tybout (2001) presents that exposure to foreign
competition tends to improve intra‐plant efficiency, and firms that participate international
activities tend to be more productive. Bernard and Jensen (2002) study the causes of U.S.
manufacturing plant deaths within and across industries. The probability of shutdowns is higher
in industries that face higher competition from low‐income countries. Hallward‐Driemeier,
Iarossi, and Sokoloff (2002) use firm level data from five East Asian countries for the period of
1996 and 1998 to investigate the patterns of productivity in the region. Exporting firms and
firms aiming for export markets have higher productivity.
One of the seminal papers in this area is by Melitz (2003). His model shows how trade may
improve productivity at both micro and aggregate levels through reallocation of resources
across firms. 1) Most productive ones export and improve more and 2) less productive ones exit
the market. Both factors lead to higher productivity. Empirical papers have followed Malitz’s
paper. Bernard, Jensen, and Schott (2006) show that U.S. firms located in the industries
experiencing a larger decline in trade costs present stronger productivity gains and, in such
industries, low productive ones die quicker. They also show that productivity growth within
firms increases with decreasing trade costs. De Loecker (2007) for Slovenian firms, Fernandes
(2007) and Eslava, Haltiwanger, Kugler, and Kugler (2005) for Colombian firms, Van Biesebroeck
(2005) for Sub‐Saharan countries, Aw, Yan, Roberts, and Xu (2009) for Taiwanese firms, Pavcnik
(2002) for Chilean firms, Muendler, Marc‐Andreas (2004) for Brazilian firms, Vadlamannati
(2009), Pattnayak, and Thangavelu (2008), Topalova (2007) for Indian firms show that the global
integration of countries through trade liberalization improves productivity and, as a result,
growth performance.
6
In addition to trade related policies, the significance of other policies and regulations in
determining productivity growth across countries or across industries in a country is studied in
the literature. Some of them are strengthening private governance (privatization), promoting
competition, opening up firms to access to markets, regulating capital spending and FDI,
regulating slack, technology diffusion and adoption, innovation. For example, Arnold, Nicolette,
and Scarpetta (2008) show that pro‐competitive regulations improve investment and multi‐
factor productivity, in turn, economic growth in selected OECD countries. The focus is basically
on the regulations related to 1) privatization; 2) entry and price liberalization; 3) precompetitive
regulation of natural monopolies; 4) liberalization of international trade and FDI. They point out
that the timing and magnitude of regulations and policy changes are important factors to
achieve higher productivity and growth. Eslava, Haltiwanger, Kugler, and Kugler (2004) study
the effects of structural reforms on productivity and profitability enhancing reallocation, using a
plant‐level longitudinal dataset for Colombia for the period 1982‐1998. They find that market
reforms rising overall productivity is largely due to reallocation away from low towards high‐
productive plants; reallocation activities depend less on demand factors after reforms; the rise
in aggregate productivity post‐reform is entirely accounted for by the improved allocation of
activity.
The possible sources of differences in productivity levels across countries are investigated
extensively in the literature, as explained above. In a parallel literature, researchers try to
answer the question of how quickly productivity levels are converging across countries or
across industries in a country. These analyses are important to evaluate the relative success of
the changes leading to productivity gains. Some of the recent papers investigating differences
in productivity and convergence across countries are Bartelsman, Haskel, and Martin (2008)
and Bartelsman, Haltiwanger, and Scarpetta (2008). Bartelsman, Haskel, and Martin (2008)
focus on developed countries and show that productivity levels are quite diverged. Bartelsman,
Haltiwanger, and Scarpetta (2008) use harmonized firm‐level database that covers 24 industrial
and emerging economies, including Argentina, Brazil, Chile, Colombia, Mexico, Venezuela,
Indonesia, South Korea. They show that there is a significant heterogeneity in firm productivity
and firm size. They calculate the correlation between market share of firms and productivity in
different industries across different countries and show that larger firms are more efficient.
Section 1 describes the microeconomic theory of firm and the methodology of growth regressions and
growth accounting framework, section 2 details the microeconomic and macroeconomic data used in
this paper, while section 3 provides a summary of estimates and compares and contrasts the
contribution of factors to output growth at micro and macro levels based on regressions and a growth
accounting exercise for 45 countries for the period 2002‐05. Section 4 examines the determinants of
7
and section 5 reports on the conclusions at firm and aggregate level and ponders over some questions
that could form part of a research project.
1.
Theory
and
Methodology
The economy is assumed to contain a large number of heterogeneous firms, and each firm has its own
level of level of productivity. Factor prices and market structure are given, and each of the firm’s owner
or manager is faced with the challenge of maximizing net profits for which how best to stay in business
using variable factor prices and freedom to choose appropriate level of investment and employment.
Let each firm’s production function be given by the Cobb‐Douglas equation:
(1)
Where is gross output at the firm level and gross domestic product in real terms, is total factor
productivity, is the real capital stock, and is an index of human capital, and thus it is a skill‐adjusted
measure of labor input (actual number employed) to the output production. In case of constant
returns to scale, alpha plus beta equals one, and when it is greater than one there are increasing returns
to scale.
The law of motion of capital is assumed to follow:
(2)
Where capital stock is in next period, d is depreciation rate, and is current investment
Taking logs and differentiating totally both sides of equation (1) yields equation (3)
(3)
Where the variables in lower case,
, and are growth rates of upper case variables in equation (1). Specifically, y is growth rate of
output, k is growth rate of capital stock, l is growth rate of labor, and h is growth rate of skill‐adjusted
labor input. Equation (3) decomposes the output growth into TFP growth, and growth in physical capital
and human capital.
Equation (3) can also be expressed in terms of per worker:
8
In this framework, the variable H, which is an index, is constructed using Barro and Lee’s (1994)
methodology where
(4)
Where is actual number employed, is average number of years of education per worker; and is a
parameter that increases the returns to education. In this paper, we assumed that is 10%
There are no theoretical reasons as to why the coefficients α and β should be constant over time or be
the same between sectors/industries or between the firm level and macroeconomic level. Remember
that the nature of the machinery and other capital goods (the ) differs between time‐periods and
according to what is being produced. So do the skills of labor (the ). For example, consider two sectors
which have the exact same Cobb‐Douglas technologies:
if, for sector 1, Y1 = AK1αH1β and, for sector 2, Y2 = AK2αH2β,
That, in general, does not imply that
Y1 + Y2 = A(K1 + K2)α(H1 + H2)β
This holds only if H1 / H2 = K1 / K2 and α+β = 1, i.e. for constant returns to scale technology.
It is thus a mathematical mistake to assume that just because the Cobb‐Douglas function applies at the
micro‐level, it also applies at the macro‐level. Similarly, there is no reason that an aggregate Cobb‐
Douglas should apply at the disaggregated level. The results presented below confirm the mathematical
propositions.
2.
Data
Description
This section uses data gathered by the World Bank’s Enterprise Surveys (www.enterprisesurveys.org)
over 2002‐2005 (standard format data). Out of 71,789 firm survey records, we selected those from 97
countries that have full data availability for firm level productivity analysis (those with firm level “value
added”, “physical capital” and “workers (adjusted for years of schooling)" available). Out of these 97
countries, our macro level data constraint will further limit us to 45 out of them (4645 firms in total),
since we want to have countries (and firms in those countries) with full data availability for productivity
analysis on both national and firm level. [Note: Our productivity analyses are based on those 45
countries (for both firm and macro level), however, the growth contribution study is further limited in
the number of observations, as the survey on firm level may not have historical data for us to calculate
the growth for “value added”, “physical capital” or “workers (adjusted for education)”.]
The 45 countries included in our analysis are:
Argentina, Bangladesh, Bolivia ,Brazil, Cameroon, Chile, China, Colombia, Costa Rica, Dominican
Republic, Egypt, Arab Rep., El Salvador, Ethiopia, Greece, Guatemala, Guyana, Honduras, India,
9
Pakistan, Panama, Paraguay, Peru, Philippines, Portugal, Rwanda, Senegal, South Africa, Korea, Rep.,
Spain, Tanzania, Thailand, Turkey, Uganda and Uruguay.
3.
Estimation and Results
The OLS regression estimates for equation (1) using value added for surveyed firm and GDP for national level both indicate that physical capital accumulation is the main factor in explaining output growth. See Annex 1 for variable descriptions.
Estimation of equation (1) above in logarithmic function indicates physical capital and human capital elasticity at national levels are 0.7 and 0.41, respectively. In comparison, the physical and human capital elasticity on firm level (in the same countries) is 0.86 and 0.19, respectively. They are all statistically significant (as shown in Table 1).
Table 1: Estimates of parameters of firm level and cross country regressions, 2002-05
Dependent variable: log of Value Added in case of firms and Log of GDP in constant local currency in case of aggregate economy (Period 2002-05)
Firm level estimates National level estimates
Log of capital stock (K) 0.86 *** 0.70 ***
Log of human capital (H) 0.19 *** 0.41 ***
Intercept 1.01 0.10
R-squared 0.86 0.63
No. of firms in 45 selected countries 4645 45
Note 1: Robust t‐statistics in parentheses, *** p<0.01, ** p<0.05, * p<0.1
At the firm level, growth in A or TFP can be interpreted as technical progress. Clearly technical progress at micro level can translate into TFP growth at the aggregate level. Also, as resources shift from inefficient firms to efficient firms, say due to privatization or Schumpeterian
destructive creation and other reforms, aggregate TFP may record a growth even if the individual firms do not exhibit technical progress. On macro level, growth in A measures more than TFP growth and one has to be careful because of these other effects.
We now use equation (3) to decompose the contribution of factors of production and TFP to output growth at the firm and national levels (Table 2).
10
Table 2: Sources of Growth at firm and national levels, 2002‐05
Macro level Firm
Level
TFP growth contribution to output
growth
0.22 0.96
Capital growth contribution to output
growth
0.28 0.04
labor growth contribution to output
growth
‐0.08 0.00006
Note: 1) the contribution is calculated as covariance between input growth and output growth over variance of output growth. 2) Due to data availability limit, the above contribution is calculated using firm level survey data in 9 countries: Brazil (814 firms), El Salvador (8 firms), Guatemala (5 firms), Honduras (2 firms), India (846 firms), Madagascar (72 firms), Mauritius (59 firms) and South Africa (389 firms)
(a) TFP growth and output growth. At the firm level, the median output growth is 2.88
percent per year while median TFP growth is 1.41 percent per year. This may imply that TFP accounts for about 49 percent of the output growth. Such a conclusion ignores the fact that TFP growth may be inducing decisions to invest in physical and human capital. In other words, inputs are endogenous to TFP and output growth. Klenow and Rodriquez-Clare (1997) have an ingenious way of disentangling this effect as they calculate the contribution of TFP growth to additional output (over and above the average growth rate). Their calculation is based on the covariance between TFP growth and output growth divided by the variance of output growth. In our case, TFP’s contribution turns out to be not 49% but 96% on firm level.
The main findings so far are that:
1. TFP is important both at micro and macro levels, and therefore macro-level productivity
growth are linked to micro-level efficiency to allocate inputs and output across businesses (in line with Syverson 2009). However, it is less important at the macro level and more important at the micro level, implying that there is not a one-to-one linkage or closer link as found in the literature using US industry data.
2. Capital accumulation is important both at micro and macro levels – more important at
macro level than at micro level.
3. The contribution of TFP to output growth depends crucially on the share of physical
capital in real output (alpha). The higher the alpha, the lower is the contribution of TFP to growth because decreasing alpha lowers the contribution of physical capital (K) and increases the contribution of labor (L).
4. Alpha of 0.87 across our sample countries is very high than estimates found in other
studies, which is normally betweens 0.35 to 0.40, especially for industrial countries. This higher alpha confirms the lower contribution of TFP to growth in developing countries compared with industrial countries. It also aligns with other studies that found large left tail of poorly managed firms in developing countries.
11
(b) TFP growth and share of physical capital. From economic theory, we know that as the
marginal product of capital is likely to be higher in capital-poor developing countries, the share of physical capital (alpha) must be higher in developing countries when compared with
developed countries. In other words, investment would flow from developed to developing countries but data here reveals that the flow of investment is likely to be the other way, thereby confirming the Lucas Paradox. Meanwhile, alpha can be re-written as a product of marginal product of capital times the share of capital in total output (i.e. capital output ratio). Capital output ratio is lower in developing countries. Therefore, alpha could be higher or lower for developing countries than developed countries. And we may not expect to see the same kind of correlation on firm level than from national level either.
The scatter plot confirms this on both firm and national level. On national level, we see negative and significant correlation between growth in TFP and growth in capital (Figure 1a), positive and significant correlation between TFP and growth in output (Figure 1b), slightly positive but not significant correlation between TFP growth and capital/output share (Figure 1c).
Figure 1a. Growth in TFP and Growth in Capital (National level 2002‐05))
ARG BGD BOL BRA CMR CHL CHN COL CRIDOM EGY SLV ETH GRC GTM GUY IND IDN IRL JORMLI MUS MEX MAR NIC PAK PAN PRY PER PHL PRT RWASEN ZAF KOR ESP THA TUR UGA URY -5 0 5 10 G ro w th i n TF P 0 5 10 15 Growth in Capital
Growth in TFP Vs. Growth in Capital, macro, 2002-2005
12
Figure 1b. Growth in TFP and Growth in GDP (national, 2002‐05)
ARG BGD BOL BRA CMR CHL CHN COL CRI DOM EGY SLV ETH GRC GTM GUY IND IDN IRL JOR MLI MUS MEX MAR NIC PAK PAN PRY PER PHL PRT RWASEN ZAF KOR ESP THA TUR UGA URY -5 0 5 10 G row th i n TF P 0 2 4 6 8 10 Growth in GDP
Growth in TFP Vs. Growth in GDP, macro, 2002-2005
Note: slope of the regression line is .40, significant at 0.01 levels.
Figure 1c. Growth in TFP and Capital /GDP share (without outliers of MEX, GRC, ESP, PRT, TUR and URY, national level)
ARG BGD BOL BRA CMR CHL CHN COL CRI DOM EGY SLV ETH GTM GUY IND IDN IRL JORMLI MUSMAR NIC PAK PAN PRY PER PHL RWA SEN ZAF KOR THA UGA -6 -4 -2 0 2 4 Gro w th in T F P 0 2 4 6 8 Capital/GDP Growth in TFP Vs. Capital /GDP, 2002-2005
Note:the regression line slope is .14, not significant at 0.1 levels
13
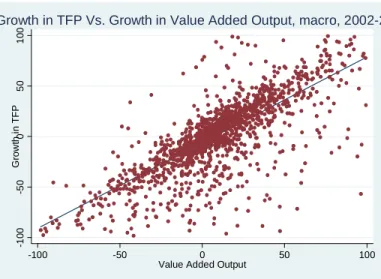
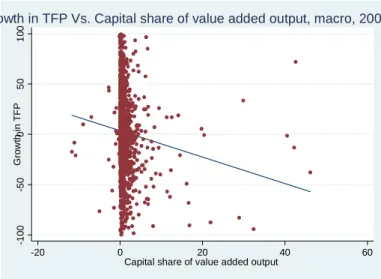
At the firm level, the relations for the first two are the same as on national level (Figures 2a and 2b). Yet for growth in TFP and capital /output share, we see a positive and significant correlation (Figure 2c), which is not the same at the national level.
Figure 2a. Growth in Technology and Capital share in Value Added (at firm level)
-1 00 -5 0 0 50 10 0 Gr o w th in T e c h no lo gy -100 -50 0 50 100 Growth in Capital
Growth in Technology Vs. Growth in Capital, firm, 2002-2005
Note: we limit TFP growth and Capital growth to be within [-100, 100]; the slope in the above graph is -.58, significant at 0.01 level.
Figure 2b. Growth in TFP and Growth in Value Added Output (firm level)
-1 0 0 -5 0 0 50 10 0 G ro w th i n TF P -100 -50 0 50 100
Value Added Output
Growth in TFP Vs. Growth in Value Added Output, macro, 2002-2005
The slope in the graph is .84, sig at 0.1 levels.
14
Figure 2c. Growth in Technology and Capital share in Value Added (firm level)
-1 0 0 -5 0 0 50 10 0 G row th i n TF P -20 0 20 40 60
Capital share of value added output
Growth in TFP Vs. Capital share of value added output, macro, 2002-2005
Note: we limit the range of growth or the share to be within -100 to 100; the slope in the above graph is -1.31, sig at 0.01 levels.
Another interesting perspective is to take a closer look into within-industry productivity for India and Brazil, using the same Enterprise Survey data. Both OLS regressions confirm the findings on firm and national level.
Table 3: India Firm Level Estimations by Industry
Textiles Leather Garments Food Metals/Machinery Electronics Chemicals/Pharm.
lcapital_n 0.33*** 0.63*** 0.36** 0.62*** 0.47*** 0.46*** 0.52*** (2.77) (4.41) (2.58) (5.42) (6.24) (5.74) (10.26) lworker_edu 0.66*** 0.07 0.59*** 0.34* 0.55*** 0.54*** 0.52*** (3.78) (0.38) (4.18) (1.90) (5.50) (4.33) (7.31) Constant 3.00*** 2.75*** 2.96*** 1.94*** 2.26*** 2.34*** 2.01*** (6.19) (5.20) (4.07) (3.43) (5.52) (6.21) (7.17) Observations 132 48 164 115 110 188 234 R-squared 0.58 0.65 0.53 0.63 0.72 0.68 0.75
Note 1: Robust t‐statistics in parentheses, *** p<0.01, ** p<0.05, * p<0.1; note 2: the above results excludes outliers with
absolute value for growth in capital or output larger than 200) note 3. Excluding outliers with absolute value for growth in
15
Table 4: India - Contribution by inputs
TFP Capital Labor Textile 1.01 -0.06 0.00 Leather 0.98 -0.02 0.05 Garman 0.93 0.04 0.08 FOOD 0.98 0.01 -0.02 Machine 0.93 0.07 0.04
Electronics (w/o outlier) 1.02 -0.05 -0.01
Chemistry 0.99 -0.02 0.03
Note: the above results excludes outliers with absolute value for growth in capital or output larger than 200
When we combine the contribution of inputs to the growth rate in India for the period 2004-05, it can be seen that the contribution of TFP is 0.75, that of capital is 0.25 and labor is about 0.05. This shows that as we aggregate the data series, the relative higher weight of TFP drops. This is also confirmed by the analysis for Brazil, results of which are presented below.
Table 5: Brazil estimation by industries
Textiles Leather Garments Food Metals and machinery Electronics Chemicals and pharmaceutics Wood and furniture Auto and auto components lcapital_n 0.13 0.32*** 0.37*** 0.43*** 0.07 0.55** 0.35 0.23*** 0.25*** (0.72) (4.40) (4.50) (2.81) (0.38) (2.54) (1.54) (3.49) (2.95) lworker_edu 0.88*** 0.96*** 0.88*** 0.74*** 1.16*** 0.49 0.83 1.20*** 0.94*** (3.18) (7.72) (7.20) (4.02) (7.41) (1.29) (1.56) (9.70) (6.52) Constant 2.66*** 0.54 0.31 0.87* 1.74* 1.17 1.78 -0.11 1.24*** (4.67) (1.35) (0.80) (1.68) (1.76) (1.10) (1.30) (-0.30) (3.38) Observations 36 74 187 58 93 28 43 133 67 R-squared 0.69 0.83 0.65 0.77 0.59 0.54 0.51 0.79 0.87
Note 1: Robust t‐statistics in parentheses, *** p<0.01, ** p<0.05, * p<0.1; note 2: the above results excludes outliers with
absolute value for growth in capital or output larger than 200, note 3:excluding outliers with absolute value for growth in
capital or output larger than 200)
Table 6: Brazil - Contribution by inputs
TFP Capital Labor Textile 0.87 0.00 0.12 Leather 0.84 0.12 0.11 Garment 0.87 0.03 0.13 FOOD 1.12 -0.08 -0.14 Material / machine 0.87 -0.02 0.10 Elec 0.88 0.17 -0.02 Chemistry 1.04 0.04 -0.09 Wood 0.81 0.11 0.13 Auto 0.98 -0.01 0.01
16
The scatter plot of alpha and sectoral TFP growth below shows a statistically significant negative correlation between these two variables in India and Brazil. Sectors in India are marked with “1”; Brazil “2”. The TFP sectoral growth is based on the median value of firms surveyed in that sector; the alpha is taken from the sectoral production function estimation. The within country sectoral correlations with alpha is also negative (for both India and Brazil) but not statistically significant.
The policy implication from the above analysis is evident: exposing firms to the best practices – for Instance, through market oriented policies -- is key to generate conditions that promote aggregate growth. On the opposite side, rigidities that block the natural process of birth, expansion, and death of plants and firms, and the reallocation of resources among economic units, impede growth and limit development. Indeed, flexibility at firm and national level is key for growth. Market economies restructure
continuously as a response to changing conditions. Our results, and those of a growing literature based on longitudinal databases at the micro level, suggest that productivity growth at the aggregate level is closely linked to the ability of the economy to efficiently reallocate inputs and outputs across firms. Thus barriers
to this efficient reallocation process reduce aggregate efficiency and growth. For instance, a production
subsidy to incumbent firms allows inefficient plants to stay longer in business.
At the same time, more efficient firms that would have entered the market are left out. Financial
restrictions, trade barriers, firm entry costs, inefficient bankruptcy procedures, bureaucratic red tape, tax burden, labor regulations, and the lack of human capital for technology adoption, all distort the natural process of resource reallocation. Chang et al (2005), for instance, provide empirical evidence of a link between growth and measures of market flexibility and ease of entry and exit, whereas Hopenhayn and Rogerson (1993) and Bergoeing, Loayza and Repetto (2004) develop theoretical models showing that this link is a result of the ability of the economy to easily reshuffle resources towards more productive uses.
4.
What
Determines
TFP?
We now look into the determinants of TFP on firm level. The following regressions use lnA or TFP (log form) as derived from the firm level regressions as the dependent variable (see equation (5)).
17
To test what determines TFP, we tried variables for last year’s spending on R&D (lnRn2, in form; for those spending nothing, we gave it a zero), capacity utility rate (lnCapUtl, ln form), dummy variable for adoption of foreign technology (ForgTech), top management’s years of education and experience prior to the appointment (lnmanage, in ln form) and percentage of products for export (lnexport, in ln form). We also control for the country average level subjective perception on the obstacle level in the investment climate – in terms of corruption and instability (lcorupM), financial or tax regulation (lfinanceM), and infrastructure or labor availability (lhardwareM) – they are coded in such a way that the higher the value, the worse the surveyed firm felt about that particular issue (see Annex 2 for details of coding).
Table 7: Estimates of determinants of firm level TFP, 2002-05
(1) (2) (3) (4) lnRnD2 0.02** 0.02** 0.02** 0.02** (2.27) (2.23) (1.96) (1.97) lnCapUtl 0.45*** 0.47*** 0.46*** 0.44*** (6.72) (9.34) (9.18) (18.98) ForgTech 0.19** 0.18** 0.17** 0.17** (2.23) (2.10) (1.99) (2.00) Lnmanage 0.05 (0.80) Lnexport -0.03 (-1.34) lcorupM -0.86*** -0.86*** -0.37*** -0.42*** (-4.10) (-4.18) (-2.74) (-8.82) lfinanceM 0.64*** 0.61*** (3.06) (2.99) lhardwareM -0.30 -0.25 -0.10 (-1.12) (-0.93) (-0.38) Observations 2391 2433 2433 2433 R-squared 0.41 0.41 0.41 0.41
The results show that R&D spending, capacity utilization rate, foreign technology, corruption
and instability index, and financial and tax regulation index are the statistically significant
determinants of TFP. Surprisingly, the quality of management fails to be significant determinant
of productivity, but this could be that managers’ decisions are involved in research and
development, capacity utilization rate, and adoption of foreign technology. Export‐orientation
18
The initial estimation results, based on the Investment Climate Survey of the World Bank, show
the importance of total factor productivity (TFP) in the production process of firms across
sectors in India and Brazil during 2002‐05. It needs to be noted that since the number of
observations is very limited and the time period is short, the initial results need to be taken
cautiously. In both countries, the contributions of capital, labor, and total factor productivity
are calculated at the industry level. The results are obtained running value added at the firm
level (defined as total sales minus the sum of new investment, energy, and material cost) on
Capital (Lcapital_n): natural log of firm’s property, plant and equipment.
Labor (Lworker): natural log of number of permanent workers plus temp workers
weighted by working months.
Alternative measure of labor (Lworker_edu): natural log of summation of
number of permanent workers plus temp workers weighted by working months
and weighted schooling years of workers times 0.1.
Our expectation is that major changes in the level productivity can be explained by changing in
policies and reforms. We expect that policies combining improvements in domestic markets
(such as higher flexibility in labor or financial markets) with integration to global markets (such
as trade liberalization, higher foreign direct investment) produce the highest productivity gains.
We also expect that the convergence in the productivity level of developing countries towards
the levels observed in developed countries is faster in relatively more competitive industries at
the international standards, which can be accomplished by reforms.
One purpose of further study is to study the level of productivity at different layers of
aggregation (i.e. at the firm level, at the industry level, and national level). Previous empirical
studies show that stylized facts associated with productivity are different at different level of
aggregation. A comparative study of these facts across countries in a long time period is
essential to better understand productivity, which is considered as one of the major sources of
economic growth. With the help of long time series, we can study impact lags of different
external or internal factors, especially policies and reforms, in determining productivity.
In addition, future work could focus on the following issues which will hopefully improve our
understanding of productivity as one of the essential determinants of growth: (1) micro‐level
analyses can inform us about how the performance of businesses is affected by changing
policies such as export, import, FDI policies, privatization. (2) We can also observe the
reallocation of resources from inefficient to efficient ones (turnover rate) and how businesses
are affected by this allocation process. (3) Depending on data availability on firm
characteristics, such as access to foreign technology, R&D expenditures, the level of corruption,
19
5.
Conclusions
and
Further
Work
Efficiency in conversion of inputs to outputs is productivity. At the heart of it, productivity is a
residual, a measure of our ignorance. A large literature is available on microeconomic
foundations of productivity and its variation across firms, industries and countries. These
studies focus on cases of both developed and developing countries.5 The main findings of this
study include: (i) confirmation of TFP at firm, industry and national levels, but TFP tapers off at
each level of aggregation implying that there is less than one‐to‐one relationship between
micro‐efficiency, sector growth, and macro growth; (ii) capital accumulation is more important
at macro level than micro level; (iii) productivity at micro levels is driven by research and
development, capacity utilization rate, adoption of foreign technology (all of which involve
management decisions), and is negatively related to corruption and instability, tax and financial
regulations; and (iii) confirmation of lower contribution of TFP to output growth in developing
countries than in developed economies. Management decisions are involved in a lot of day‐to‐
day operations at the firm level and therefore management is an unmeasured input.
In developing countries, at the firm level, there is a need to understand the contribution of
quality of inputs (management quality, education and labor quality, training, experience of
workers, use of computers at work) and also the role of external agglomeration (e.g. location in
a booming city, competitive pressures from new firms, trade competition and regulations). One
of the major remaining issues in the literature is a comparative study of productivity across
developing countries at different layers of aggregation in a long time period, and the
understanding of the possible determinants of productivity, especially policy changes, in this
harmonized framework. Further work could aim at closing this gap in the literature. There is a
need to study the stylized facts of productivity at three different levels of aggregation (firm
level, industry level, and national level) across four developing countries (Brazil, Chile,
Colombia, and India). It is important to undertake such a study with a long time series data so
that impact lags of different factors affecting productivity can be understood and tracked
better.6 Some comparative studies of micro‐level productivity across developing countries are
already available in the literature (for example, Bartelsman, Haltiwanger, and Scarpetta (2008)),
but generally they use panels of firms with short time dimensions, and do not necessarily study
the possible factors in determining productivity, specifically the impacts of policy changes.7
5 An extensive literature review follows in the next section.
6 As pointed out by Tybout (2000), it is important to track individual firms over long enough periods to be able to
capture impact lags of, especially, spillovers.
7 Arnold, Nicolette, and Scarpetta (2008) focus on the policy implications of productivity across countries, but they
20
One of the major reasons for low productivity in developing countries is the misallocation of
inputs. Productivity can increase with proper rearranging, which is supported by different
policies.8 In this process, it is important to know the nature of productivity differences to
implement right type of policies. The goal of future research could be to identify possible
sources of misallocation of resources and output in emerging economies and the role of policies
to improve them. If we can identify the possible sources of misallocation, we may also answer
the question of why productivity gaps exist among businesses in a country or across countries.
There are many factors that could be possible sources of the misallocation problem in
developing countries. It may not be easy to identify them one by one. Thus, the approach that
we could choose is to identify major obstacles in the reallocation process. We believe that
identifying the reasons behind large productivity gains provide us with hints about what the
initial sources of low productivity could be in the beginning. For example, if a large
improvement in productivity is observed in a country after some financial reforms which may
increase availability of funds, we can conclude that financial market imperfections could be an
important source of low productivity and misallocation of resources in that country. Given
differences among countries in market structure, institutions, technology, human capital,
regulations, it is expected to observe some differences in productivity. Thus, it is important to
study the periods of large productivity gains and reasons behind them across countries.
To accomplish this goal, future work should aim to systematically study the periods of large
productivity gains and/or losses in different developing countries. Micro‐level databases that
allow us to properly measure productivity need to be used and the focus could be on narrowly
defined industries at first. But then we could aggregate data at industry and national levels to
observe productivity at different levels. After identifying the periods of large changes at the
micro, industry, and national levels of productivity, future work could try to link such changes to
major events occurred around this period with changes in policies or regulations in the country.
We are planning to include Brazil, Chile, Colombia, and India in the study.9 Based on previous
studies in the literature, all these countries have reliable micro‐level data to measure
productivity.
8 Three of the recent studies are by Hsieh and Klenow (2009), Brandt, Loren, Van Biesebroeck, and Zhang (2009),
and Hallward‐Driemeier and Thompson (2009a and 2009b). Hsieh and Klenow (2009) emphasize the importance of
resource misallocation which may significantly lower aggregate productivity. In a study, where Chinese firms are
investigated, Brandt, Loren, Van Biesebroeck, and Zhang (2009) show that net entry contributes roughly half to
total TFP growth. Hallward‐Driemeier and Thompson (2009) show that the turnover rate of Moroccan firms is
important source of productivity and overall growth. 9 Details are provided in the following sections.
21
In general, since each country has unique experiences with reforms and policies, their
applications can be much different across countries. Thus, it is essential to investigate business’
responses to changing policies and reforms across countries. In this way, we can better
understand productivity differences across countries and possible policies helping to close
these gaps.
In such a study, the questions that could be answered are:
How does the level of productivity change overtime across industries in a country? Are
there any similarities or differences when the experiences of countries are compared?
How does the level of productivity change at different layers of aggregation (firm‐level,
industry‐level, and national‐level) across developing countries?
Are there any differences observed in the response of micro units to changing policies
and regulations across industries in a country? Which policies or regulations promote
productivity most? In which industries?
Which reforms are effective in raising productivity of businesses for a given type of
market friction? Do we observe any impact lag after the introduction of reforms?
The reallocation of resources from exiting firms to new firms (turnover) extensively
investigated. But, as shown in the literature, high turnover may not necessarily imply
that inefficient producers exit the market. There might be other restrictions. What
would be the optimal time and size of policies to make sure that the following resource
reallocation can guarantee higher productivity returns?
Depending on data availability, we will try to answer the question: Which firm
characteristics help firms be more productive?
Do we observe any convergence in the level of productivity across countries after
improvements in allocation of resources? If yes, at what speed?
22
References
Arnold, Jens Giuseppe Nicolette, Stefano Scarpetta “Regulation, allocative efficiency and
productivity in OECD countries: Industry and firm‐level evidence” ECO/WKP (2008) 24 (June
2008).
Aw, Bee Yan, Mark J Roberts, Daniel Yi Xu (2009) “R&D investment, exporting and productivity
dynamics,” working paper (January 2009).
Bartelsman, Eric and Mark Doms. 2000. “Understanding Productivity: Lessons from Longitudinal
Microdata.” Journal of Economic Literature, 38(3): 569‐594.
Bartelsman, Eric, John Haltiwanger, and Stefano Scarpetta (2008) “Cross Country Differences in
Productivity: the Role of Allocative Efficiency” working paper (July 2008).
Bartelsman, Eric J., Jonathan Haskel, and Ralf Martin (2008) “Distance to which frontier?
Evidence on productivity convergence from international firm‐level data,” working paper
(November 2008).
Brandt, Loren, Johannes Van Biesebroeck, and Yifan Zhang (2009) “Creative Accouting or
Creative Destruction? Firm‐level Productivity Growth in Chinese Manufacturing,” NBER Working
Paper No: 15152 (July 2009).
Bergoeing, R. and A. Repetto (2006). "Micro Efficiency and Aggregate Growth in Chile".
Cuadernos de Economía, 43(127): ‐‐.
Bergoeing, Raphael and Loayza, Norman & Repetto, Andrea (2004). "Slow recoveries," Journal of
Development Economics, vol. 75(2), pages 473-506, December
Bergoeing, R., A. Hernando, and A. Repetto. (2005a). “Market Reforms and Efficiency Gains in Chile.”
Centro de Economía Aplicada, Universidad de Chile, mimeo.
Bernard, Andrew B., Jonathan Eaton, J. Bradford Jensen, and Samuel Kortum (2000) “Plants and
Productivity in International Trade,” NBER Working Paper No: 7688 (May 2000).
Bernard, Andrew B. and J. Bradford Jensen (1999) “Exporting and Productivity,” NBER Working
Paper No: 7135 (May 1999).
Bernard, Andrew B. and J. Bradford Jensen (2002) “The Deaths of Manufacturing Plants,” NBER
Working Paper No: 9026 (July 2002).
Bernard, Andrew B., J. Bradford Jensen, and Peter K. Schott (2006) “Trade Costs, firms and
23
Bloom, Nick and John Van Reenen (2007) “Measuring and Explaining Management Practices
across Firms and Countries.” Quarterly Journal of Economics, 122(4): 1351‐1408.
Bontempi, Maria Elena and Jacques Mairesse (2008) “Intangible Capital and Productivity: An
Explaration on a Panel of Italian Manufacturing Firms,” NBER Working Paper No: 14108 (June
2008).
Bosworth, Barry and Susan M. Collins (2007) “Accounting For Growth: Comparing China and
India” NBER 12943 (February 2007).
Chang, Roberto & Kaltani, Linda & Loayza, Norman V., 2009. "Openness can be good for growth: The role of policy complementarities," Journal of Development Economics, vol. 90(1), pages 33-49,
September
Collins, Susan and Barry Bosworth (1996) “Economic Growth in East Asia Accumulation versus
Assimilation,” Brookings Papers on Economic Activity, No.2, Brookings Institution: 135‐203.
De Loecker, Jan (2007) “Do exports generate higher productivity? Evidence from Slovenia,”
Journal of International Economics (73): 73 69‐98.
Doppelhofer, Gernot, Ronald I. Miller, Xavier Sala‐i‐Martin (2000) “Determinants of Long‐Term
Growth: A Bayesian Averaging of Classical Estimates (BACE) Approach,” NBER Working Paper
No. 7750 (June 2000).
Easterly, William, and Ross Levine (2001) "It’s Not Factor Accumulation: Stylized Facts and
Growth Models," World Bank Economic Review, 15 (2): 177‐219.
Eslava, Marcela, John Haltiwanger, Adriana Kugler, Maurice Kugler (2004) “The effects of
structural reforms on productivity and profitability enchancing reallocation: evidence from
Colombia” Journal of Development Economics, (75): 333‐371.
Eslava, Marcela, John Haltiwanger, Adriana Kugler, Maurice Kugler (2005) “Plant Survival,
Market Fundamentals and Trade Liberalization.” Working paper (October 2005).
Fernandes, Ana M. (2007) “Trade Policy, trade volumes and plant‐level productivity in
Colombian manufacturing Industries,” Journal of International Economies, (71): 52‐71.
Foster, L., J.C. Haltiwanger, and C.J. Krizan (1998), “Aggregate Productivity Growth: Lessons from Microeconomic Evidence.” NBER Working Paper # 6803.
Hall, Robert and Charles Jones (1999) “Why do some Countries Produce so much More Output
24
Hallward‐Driemeier, Mary and Fraser Thompson (2009a) “Creative Destruction and Policy
Reforms: Changing Productivity Effects of Firm Turnover in Moroccan Manufacturing,” World
Bank Policy Resaerch Working Paper No: 5085 (October 2009).
Hallward‐Driemeier, Mary and Fraser Thompson (2009b) “Mind the Neighbors: The Impact of
Productivity and Location on Firm Turnover,” World Bank Policy Resaerch Working Paper No:
5106 (October 2009).
Hallward‐Driemeier, Mary, Giuseppe Iarossi, and Kenneth L. Sokoloff (2002) “Exports and
Manufacturing Productivity in East Asia: A Comparative Analysis with Firm‐Level Data,” NBER
Working Paper No: 8894 (April 2002).
Holmes, Thomas J., David K. Levine, and James A Schmitz Jr. (2008) “Monopoly and the
Incentive to Innovate When Adoption Involves Switchover Disruptions.” NBER Working Paper
13864.
Hopenhayn and Rogerson, (1993, “Job Turnover and Policy Evaluation: A General Equilibrium Analysis,” Journal of Political Economy, 101(5): 915-38
Hsieh, Chang‐Tai and Peter J. Klenow (2009) “Misallocation and manufacturing TFP in China and
India,” unpublished paper (September 2009).
Hu, Zuliu and Mohsin Khan (1997) “Why is China Growing So Fast?” Staff Papers, IMF, 44
(March): 103‐31.
Katayama, Hajime, Shihua Lu, and James R. Tybout (2009) “Firm‐level Productivity Studies:
Illusions and a Solution,” International Journal of Industrial Organization 27(3): 403‐413.
Kehoe, T. and E. Prescott. (2002). "Great Depressions of the Twentieth Century," Review of Economic Dynamics, 5: 1‐18.
Keller, Wolfgang and Stephen R. Yeaple (2003) “Multinational enterprises, international trade
and productivity growth: firm‐level evidence from the United States” IMF WP No: WP/03/248
(December 2003).
Keller, Wolfgang and Stephen R. Yeaple (2009) “Multinational Enterprises, International Trade, and
Productivity Growth: Firm‐Level Evidence from the United States.” Forthcoming. Review of
Economics and Statistics.
Klenow, Peter J. & Rodriguez-Clare, Andres, 1997. "Economic growth: A review essay," Journal of
25
Krugman, Paul 1994. “The Myth of Asia’s Miracle,” Foreign Affairs, vol. 73 (Nov) pp. 62-78 Mankiw, N Gregory & Romer, David & Weil, David N, 1992. "A Contribution to the Empirics of Economic Growth," The Quarterly Journal of Economics, MIT Press, vol. 107(2), pages 407-37, May. McKinsey Global Institute (1998) Productivity the Key to an Accelerated Development Path for Brazil (Washington, D.C.: McKinsey & Company).
McKinsey Global Institute (2001) India: The Growth Imperative (Washington, D.C.: McKinsey &
Company).
Melitz, Marc J. (2003) “The Impact of Trade on Intra‐Industry Reallocations and Aggregate
Industry Productivity” Econometrica, 71(6): 1695‐1725.
Moretti, Enrico (2004) “Workers’ Education, Spillovers, and Productivity: Evidence from Plant‐
Level Production Functions.” American Economic Review, 94(3): 656‐690.
Muendler, Marc‐Andreas (2004) “Trade, technology and productivity: a study of Brazilian
manufacturers, 1986‐1998” WP UC San Diego No: 2004’06.
Nicoletti, Giuseppe and Stefano Scarpetta (2005) “Regulation and Economic Performance”
OECD Economics Department Working Papers No: 460 (November 2005).
Pattnayak, Sanja Samirana and Shandre M. Thangavelu (2008) “Economic liberalization in India:
Productivity and Learning‐by‐export” working paper (November 2008).
Pavcnik, Nina (2002) “Trade Liberalization, exit, and Productivity improvements: evidence from
Chilean Plants,” The review of Economic Studies, (69): 245‐276.
Petrin, Amil and Jagadeesh Sivadasan (2006) “Job Security Does Affect Economic Efficiency:
Theory, a New Statistic, and Evidence from Chile.” Working paper.
Sala-i-Martin, Xavier. (2004) “ Determinants of Long-Term Growth: A Bayesian Averaging of Classical Estimates (BACE) Approach, American Economic Review, 2004, 94, (4), 813-835
Sarel, Michael, Growth and Productivity in ASEAN Countries (August 1997). IMF Working Paper, Vol. , pp. 1-50, 1997.
Senhadji, A., (2000). “Sources of Economic Growth: An Extensive Growth Accounting Exercise,” IMF staff papers, vol 47, no. 1, pp. 129-57
Solimano A. and R. Soto. (2004) “Latin American Economic Growth in the Late 20th. Century:
Evidence and Interpretation.” Documento de Trabajo # 276, Instituto de Economía, Universidad