Preprint of Atzmueller, M., Mollenhauer, D., Schmidt, A. (2016) Big Data Analytics using Local Exceptionality Detection. In: Enterprise Big Data Engineering, Analytics, and Management, IGI Global (In Press)
Big Data Analytics using Local
Exceptionality Detection
Martin Atzmueller, Dennis Mollenhauer, Andreas SchmidtUniversity of Kassel, Research Center for Information System Design, Knowledge and Data Engineering Group, Germany
ABSTRACT
Large-scale data processing is one of the key challenges concerning many application domains, especially considering ubiquitous and big data. In these contexts, subgroup discovery provides both a flexible data analysis and knowledge discovery method. Subgroup discovery and pattern mining are important descriptive data mining tasks. They can be applied, for example, in order to obtain an overview on the relations in the data, for automatic hypotheses generation, and for a number of knowledge discovery applications. This chapter presents the novel SD-MapR algorithmic framework for large-scale local exceptionality detection implemented using subgroup discovery on the Map/Reduce framework. We describe the basic algorithm in detail and provide an experimental evaluation using several real-world datasets. We tackle two algorithmic variants focusing on simple and more complex target concepts, i.e., presenting an implementation of exceptional model mining on large attributed graphs. The results of our evaluation show the scalability of the presented approach for large data sets.
Keywords: Big Data Analytics, Data Mining, Local Exceptionality Detection, Subgroup Discovery, Exceptional Model Mining, Community Detection, Graph Mining, Exploratory Data Analysis
INTRODUCTION
With the exponential growth of the available data, e.g., due to ubiquitous applications and services, large-scale data mining provides many challenges. Efficient and scalable methods need to be developed that on the one hand provide the handling of such large data, on the other hand support an efficient and scalable analysis approach. In this chapter, we focus on subgroup discovery for local exceptionality detection on large datasets. During data exploration, the data analyst, for example, might be interested in partitions of the data that show some specific exceptional characteristics, and respective descriptions of these partitions. An exploratory analysis approach for identifying such a subset of the data with a concise description is given by subgroup discovery (e.g., Klösgen 1996; Wrobel 1997; Atzmueller 2015) – here, also
specifically the variant of exceptional model mining (Leman 2008; Duivestein 2016) as an approach for modeling complex exceptionality criteria. Intuitively, subgroup discovery aims at identifying such an exceptional subgroup of the whole dataset, e.g., concerning notable different distribution of some target concept, where the subgroup typically also should be as large as possible. Exceptional model mining especially focuses on complex target properties; it considers specific model classes, such as a correlation model between two variables, linear regression, or complex graph properties.
Overall, subgroup discovery is a broadly applicable data mining technique which can be applied for descriptive data mining as well as predictive data mining. We can obtain an overview on the relations in the data, for example, for automatic hypotheses generation, for attribute construction, or for obtaining a rule-based classification model. The basic idea is to identify subgroups
covering instances of the dataset, which show some interesting, i.e., unexpected, deviating or exceptional behavior, concerning a given target concept. This notion can be flexibly formalized using a quality function. We can estimate, for example, the deviation of the mean of a numeric target concept in the subgroup compared to the whole dataset; more complex functions utilizing graph-structured data consider, e.g., the density of a certain subgraph compared to the expected density of a null model given by a random edge assignment approach.
In this chapter, we present the novel SD-MapR algorithmic framework for large-scale subgroup discovery: Based on data projection techniques of the FP-Growth (Han et al. 2000) and the Parallel FP-Growth (PFP) algorithm (Li et al. 2008) for large-scale frequent pattern mining, SD-MapR employs the Map/Reduce framework (Dean & Ghemawat 2008) for large-scale data processing. The basic idea of SD-MapR is the construction of projected databases such that the subgroup discovery task can be independently deployed on several computation clusters in a divide-and-conquer manner, inspired by the PFP algorithm. For local exceptionality detection, we propose the efficient subgroup discovery algorithms SD-Map* (Atzmueller & Lemmerich 2009), GP-Growth (Lemmerich et al. 2012), and COMODO (Atzmueller et al. 2015a) which can be applied for instantiating MapR. Specifically, we present specific adaptations of the SD-Map* and the COMODO (Atzmueller et al. 2015a) algorithms for implementing SD-MapR. The remainder of this chapter is structured as follows: In the next section, we introduce some preliminaries on local exceptionality detection using subgroup discovery and exceptional model mining, the respective state-of-the-art algorithms, and the Map/Reduce framework. After that, we describe the novel SD-MapR algorithmic framewrok in detail. Next, we provide a
comprehensive evaluation of the presented algorithms using ubiquitous data, and show the scalability and performance for large-scale datasets. Finally, we conclude with a summary and point out interesting options for future work.
BACKGROUND
This section first briefly introduces the background concerning mining locally exceptional
patterns. We focus especially on approaches for local exceptionality detection based on subgroup and exceptional model mining, and briefly introduce these. After that, we summarize the basics of the Map/Reduce framework. Next, we briefly sketch an approach for local exceptionality detection on Map/Reduce, i.e., the PFP algorithm and the underlying FP-Growth algorithm. Furthermore, we summarize the algorithmic methods that are used in the evaluation, i.e., the SD-Map/SD-Map*, GP-Growth and COMODO algorithms for local exceptionality detection
targeting subgroup discovery with exceptional model mining techniques.
Local Exceptionality Detection, Subgroup Discovery and Exceptional Model Mining
A core idea in local pattern detection (Morik 2002) is to consider only partial relations in the data, in contrast to global modeling approaches that try to fit global models to the whole data. Subgroup discovery (cf. Kloesgen 1996; Wrobel 1997; Atzmueller 2015) is a general and
broadly applicable approach for local exceptionality detection. The interestingness of a subgroup is usually defined by a certain property of interest formalized by a quality function. According to the type of the property of the subgroup, that we are interested in, we can distinguish between
simple concepts such as a minimal frequency/size of the subgroup (also known as support for association rules), a deviating target share (confidence) of a binary target property of the
subgroup, or a significantly different subgroup mean of a numeric target concept. More complex target concepts consider sets of target variables. In particular, exceptional model mining (Leman et al. 2008; Atzmueller 2015; Duivestein et al. 2016) focuses on more complex quality functions, considering complex target models, e.g., given by regression models or Bayesian networks with a deviating behavior for a certain subgroup. In the context of ubiquitous data and mining social media (e.g., Atzmueller et al. 2012), interesting target concepts are given, e.g., by densely connected structures (communities), see (Atzmueller et al. 2015a), exceptional spatio-semantic distributions (Atzmueller et al. 2015b), or class association rules (Atzmueller et al. 2015c). Using a quality function, a set of subgroups is then identified using a given subgroup discovery
algorithm, i.e., the top-k subgroups, or those above a minimal quality threshold. Furthermore, also constraints and other forms of background knowledge can be provided for selecting patterns and/or restricting the search space etc. (e.g., Atzmueller 2007).
Subgroups are described by the features common to the covered set of instances. This provides a direct interpretation in terms of their features, i.e. attribute-value pairs, also called selectors. Essentially, a subgroup description is given by a selection expression in a certain pattern language, e.g., as a conjunction of selectors. Due to the exponential search space given by all possible combinations of feature-value pairs (selection expressions) efficient methods, e.g., (Wrobel 1997, Atzmueller & Puppe 2006, Atzmueller & Lemmerich 2009) are crucial for constraining the search space and optimizing the search process (Atzmueller 2015). Here, we distinguish between heuristic methods - mainly based on beam search (e.g., Lavrac et al. 2004; Duivestein et al. 2016) and exhaustive approaches like SD-Map/SD-Map* (e.g., Atzmueller & Puppe 2006, Atzmueller & Lemmerich 2009, Atzmueller 2015). Often, branch-and-bound methods can be implemented using optimistic estimate functions (Grosskreutz et al. 2008, Atzmueller & Lemmerich 2009). Also, special data structures like FP-Trees (Han et al. 2000) can be applied for increasing efficiency (e.g., Atzmueller & Puppe 2006), also with respect to handling large datasets, as we will see below.
Map/Reduce
Map/Reduce (Dean & Ghemawat 2008) is a paradigm for scalable distributed processing of big data, with a prominent implementation given by the Hadoop framework1
. Its core ideas are based on the functional programming primitives map and reduce. Whereas map iterates on a certain input sequence of key-value pairs, the reduce function collects and processes all values for a certain key. The Map/Reduce paradigm is applicable for a certain computational task, if this task can be divided into independent computational tasks, such that there is no required
communication between these. Complex tasks can then be split up into different Map/Reduce phases, such that the output of the reducers in one phase is provided as the input to the mappers of the next phase. During these phases, the individual jobs are run on the computing nodes and the input dataset is split into independent chunks such that these are processed by the map tasks in parallel. The Map/Reduce framework sorts the output of the maps for obtaining the input for the subsequent reduce tasks. Then, large tasks can be split up into subtasks according to a typical divide-and-conquer strategy.
FP-Growth
The FP-Growth algorithm (Han et al. 2000) has been proposed as an efficient approach for frequent pattern mining. It avoids multiple scans of the whole dataset for evaluating candidate patterns by constructing a special data structure, the so-called FP-Tree. This extended prefix tree structure contains the relevant data in a compressed way. Each tree node contains a reference to a selector and a frequency count. Selectors on a path from a node to the root are interpreted as a conjunction. Additionally, links between nodes referring to the same selector are maintained. The FP-Tree is built by sorting the selectors of each data record according to their descending frequency in the dataset. Then, each data instance is inserted into the FP-Tree. The order of the selectors increases the chance of shared prefixes between the data records, thus decreasing the size of the FP-Tree. Most importantly, the resulting FP-Tree contains the complete condensed frequency information for the complete dataset.
For mining frequent patterns, FP-Growth starts with creating an FP-Tree for the initial dataset. Patterns containing exactly one selector are evaluated by the frequencies collected during the first pass over the dataset. Then, the algorithm recursively extends those patterns by adding further selectors in a depth-first manner, building conditional trees conditioned on the current pattern prefix. Each node corresponds to a conditional data instance built from the selectors referred to by its parent nodes. In this way, FP-Growth enables a compact and efficient mining of the condensed tree structure. We refer to (Han et al. 2000) for a more detailed discussion.
PFP
Parallel Growth (Li et al. 2008) is a variant of the frequent pattern mining algorithm FP-Growth, which uses the Map/Reduce paradigm to parallelize the computation. PFP splits the data into independent shards. A modified version of FP-Growth is applied parallel on these shards and the results are aggregated in a post-processing step.
The frequent pattern mining process is split into five steps and three Map/Reduce passes. The first step is the sharding of the input database: Here the input data is split into shards of item sets. These shards are distributed on different computing units; this step is usually done by the
Map/Reduce infrastructure. The second step counts the support of all items in the database in parallel with a Map/Reduce pass. This implicitly yields the vocabulary of the data set, which is usually unknown for huge databases. The result is called the F-List. In the third step the F-List is divided into groups identified by a gid. The F-List is small and the grouping can be done on a single computer in a few seconds. The fourth step is using one Map/Reduce pass: The Mapper generates the group dependent records. This is done by ordering the items in a record according to the frequency descending, i.e., that the most common item is the left most item. Now the items are replaced by their corresponding gid. For each gid in the record, a group dependent record is created, by selecting all items from the left most occurrence of the gid. This group dependent record is written to the output as value along with its gid as key. The Map/Reduce infrastructure groups these group dependent records, and for each group one and only one Reducer is called, with a list of all group dependent records belonging to the group. These group dependent records are used to construct the group dependent FP-Tree. On this FP-Tree an adapted version of the FP-Growth algorithm is executed. There are two adaptations compared to classical FP-Growth: The growth step is only called for the items which are in the group and only the top-k results are stored and written to the output. After computing all groups, the results are collected and post-processed in a Map/Reduce step.
SD-Map/SD-Map* and GP-Growth
For efficient local exceptionality detection using subgroup discovery, there are several
exhaustive algorithms. Map* (Atzmueller & Lemmerich 2009) is based on the efficient SD-Map algorithm (Atzmueller & Puppe 2006) utilizing an extended FP-Tree data structure, cf. (Han et al. 2000), i.e., an extended prefix-tree-structure that stores information for pattern refinement and evaluation, complemented by optimistic estimate pruning.
SD-Map* applies a divide and conquer method, first mining patterns containing one selector and then recursively mining patterns of size 1 conditioned on the occurrence of a (prefix) 1-selector. For the binary case, an FP-Tree node stores the subgroup size and the true positive count of the respective subgroup description. In the continuous case, it considers the sum of values of the target variable, enabling us to compute the respective quality functions value accordingly. Therefore, all the necessary information is locally available in the FP-Tree structure.
For extending the FP-Tree structure towards multi-target concepts, we utilize the concept of valuation bases introduced by (Lemmerich et al. 2012). Then, all information required for the evaluation of the respective quality functions is stored in the nodes of the FP-Tree, as the basis of the GP-Growth algorithm extending SD-Map/SD-Map*. With this technique, a large number of single and multi-target concept quality functions can be implemented (cf. Lemmerich et al. 2012; Atzmueller 2015).
In particular, for enabling multi-target quality functions using exceptional model mining techniques as sketched above, we focus on detecting patterns with respect to a local model derived from a set of attributes. The interestingness can then be defined, e.g., by a significant deviation from a model that is derived from the total population or the respective complement set of instances within the population.
In general, a model consists of a specific model class and certain model parameters which depend on the values of the model attributes in the instances of the respective pattern cover. The applied quality measure then determines the interestingness of a pattern according to its model parameters. We can consider, for example, the slope of a linear regression model induced on the subgroup, and the total population (or the complement of the subgroup, respectively) in order to identify deviating subgroups regarding certain target variables. We could consider, for example, wins and losses of certain players in a game: Then, assuming a linear regression model, wins could be indicated by the values on the x-axis while losses could be indicated by the values on the y-axis. Then, we could derive the slope of the line corresponding to the total population. Let us assume that this would be close to the diagonal. In that case, interesting subgroups would be those, that have a slope that deviates from the diagonal, i.e., where the points are, e.g., either in the top-left or bottom-right quadrant.
The algorithmic framework implemented by SD-Map* and GP-Growth enables optimistic estimate pruning: When determining the top-k subgroups, the current subgroup hypothesis (and all its further specializations by adding further selectors) can be pruned, if its optimistically estimated quality is below the worst quality of the top-k patterns identified so far. In that way, significant efficiency gains can be obtained, depending on the applied quality function and its optimistic estimate.
COMODO
The COMODO algorithm (Atzmueller & Mitzlaff 2011; Atzmueller et al. 2015a) for description-oriented community detection aims at discovering the top-k communities (described by
method itself is based on algorithmic principles of SD-Map* and GP-Growth in the context of community detection on attributed graphs, targeting dense structures that are described by a concise description. Essentially, COMODO is a fast branch-and-bound algorithm utilizing optimistic estimates (cf. Wrobel 1997; Grosskreutz et al. 2008) which are efficient to compute. This allows COMODO to prune the search space significantly. COMODO utilizes an extended FP-Tree structure, called the community pattern tree in order to efficiently traverse the solution space. The tree is built in two scans of the graph data set and is then mined in a recursive divide-and-conquer manner, cf. (Atzmueller & Lemmerich 2009, Lemmerich et al. 2012). The FP-Tree contains the frequent FP-nodes in a header table, and links to all occurrences of the frequent basic patterns in the FP-Tree structure. In addition, COMODO also stores additional information about the graph structure into a compiled graph representation as a set of edge data records, i.e., about the degrees of the individual nodes in order to apply several standard community quality functions, e.g., the Modularity quality function (Newman 2006).
In (Atzmueller et al. 2015a) the approach is demonstrated on data sets from three social systems namely, i.e., from the social bookmarking systems BibSonomy2, delicious3
media platform last.fm
, and from the social
4
. However, the presented approach is not limited to such systems and can be applied to any kind of graph-structured data for which additional descriptive features (node labels) are available, e.g., certain activity in telephone networks or interactions in face-to-face contacts (cf. Atzmueller et al. 2012). Since COMODO applies exceptional model mining techniques for implementing subgroup discovery for complex targets, we can also extend this formalization for even more complex model classes. Then, in order to handle community quality functions that include both the structure of the covered subgroups and additional parameters of these, we can combine, for example, a structural community quality function like the Modularity with an exceptional model like the slope model (linear regression). COMODO already enables such extensions since it includes ideas of the GP-Growth algorithm (valuation bases for model modularization) and the application of selectable community (pattern) quality functions. As we will see below in the evaluation, structural and model parameters can be suitably combined. Then, we can also model more complex discovery processes with respect to local exceptional pattern detection for answering advanced analytical questions.
METHOD
SD-MapR is a framework for implementing subgroup discovery and exceptional model mining algorithms for large datasets using the Map/Reduce framework. Below, we describe this algorithmic framework for efficient large-scale local exceptionality detection. We provide an outline of SD-MapR, and discuss its implementation concerning the SD-Map/SD-Map* and the COMODO algorithms. These algorithms allow exhaustive subgroup discovery in complex datasets. SD-Map/SD-Map* can be applied for binary and numerical target concepts, while COMODO – by integrating techniques of the GP-Growth algorithm, can apply complex quality functions for local exceptionality detection on attributed graphs. In particular, we also describe a novel extension of a community quality function that includes local exceptionality measures on numeric properties of the covered subgraph – in addition to considering structural aspects. In the next section, we will discuss evaluation results of these adaptations in detail.
2 http://www.bibsonomy.org 3 http://delicious.com/ 4 http://www.last.fm/
Overview
SD-MapR is based on the idea of partitioning the data onto different computing units, such that on each of these a respective Map/Reduce job can be run. Existing approaches rely on shared memory (using multiple cores) for each processing unit (cf. Lemmerich et al. 2010), or do not distribute the data but the search space of subgroup discovery (Trabold and Grosskreutz 2013) also relying on central memory and node-to-node communication. In contrast to these, SD-MapR provides an implementation directly utilizing the Map/Reduce paradigm, such that computation can be effortlessly distributed in this efficient programming model.
The SD-MapR approach enables subgroup discovery for simple and complex target concepts – relating to exceptional model mining. Using techniques of the GP-Growth algorithm like valuation bases for modularizing the quality computation of a subgroup, complex quality
functions can then be efficiently implemented. The next section describes some examples of that – from simple shares to a hybrid quality function including structural measures on a graph with statistical properties of the covered subgroup.
SD-MapR
Essentially, the SD-MapR algorithmic framework applies the data partitioning technique of the PFP algorithm for distributing the data on the Map/Reduce infrastructure, complemented by a specific subgroup discovery algorithm that runs on the local computation nodes. After the
individual results on these nodes have been obtained, they need to be recombined. After an initial generic preprocessing and data integration step (Convert), where the data is loaded, transformed and partitioned into the Hadoop filesystem, SD-MapR consists of the following three phases:
1. Count & Group (Obtain frequent selectors and partition these): First, acquire initial
subgroup statistics (optionally: pruning bounds) by parallel counting; obtain frequency statistics on the individual selectors contained in the dataset, and use these for generating a list of frequent selectors. Second, group the frequent selectors into disjoint sets
according to the technique of the PFP algorithm; divide the frequent selectors into a given number of groups.
2. SD (Parallel projection-driven subgroup discovery): Build group-projected databases, i.e., by applying adapted grouping steps of the PFP algorithm such that the database is split into independent (projected) databases. Apply a (potentially adapted) subgroup discovery algorithm on those projected databases, e.g., SD-Map/SD-Map* or GP-Growth-based variants. Collect the resulting patterns.
3. Combine (Merge Results): Aggregate the individual patterns into the global result set of
patterns, e.g., in a top-k approach, select the k best patterns from the result set.
These phases are implemented using three Map/Reduce steps, utilizing the basic structure of the PFP algorithm for data partitioning, parallel pattern discovery, and result aggregation.
For local exceptionality detection, the algorithmic step (2) provides for some flexibility regarding the specific implementation of the pattern discovery step. Due to their efficiency, pattern-growth-based algorithms like SD-Map/SD-Map* can be applied, since they only require two passes through the utilized (projected) databases for building their core mining structure, which can be implemented efficiently in the Map/Reduce infrastructure. Also, algorithms for complex target concepts, i.e., for subgroup discovery applying exceptional model mining techniques, like the COMODO algorithm can also be implemented. In particular, the applied
algorithm and technique for estimating the local exceptionality can be selected and configured according to the specific objectives of the analysis. Thus, there is a wide range of quality functions (Kloesgen 1996; Atzmueller 2015): These can range from simple methods, e.g., comparing means in subgroups to the total population (e.g., Wrobel 1997), spatial distributions (e.g., Atzmueller & Lemmerich 2013; Atzmueller et al. 2015b) to more complex ones, e.g., including components from a linear regression between two variables (Duivestein 2016), and the structural assessment of a complex network/graph (Atzmueller et al. 2015a). In the next section, we evaluate instantiations with the mentioned algorithms (SD-Map*, COMODO) in the context of real-world datasets, also exemplifying the flexibility of the applicable quality functions.
RESULTS
For the evaluation of the SD-MapR algorithmic framework, SD-MapR was instantiated using the SD-Map* and the COMODO algorithms – that were adapted to the characteristics of
Map/Reduce. In particular, SD-Map/SD-Map* and COMODO were reimplemented for
efficiency on Map/Reduce, such that the construction of the FP-Trees was performed in a rather memory-efficient way – by scanning the (projected) databases on disk, i.e., in a one-pass
iteration on disk instead of processing the projected database in-memory, as provided by the Hadoop framework. The implementation was performed based on the VIKAMINE system (Atzmueller & Puppe 2005, Atzmueller & Lemmerich 2012), for which extensions for Map/Reduce were created.
In the following, we first outline the characteristics of the applied datasets. After that, we present results of our evaluation and discuss them in detail.
Datasets
We performed the evaluation using four datasets. For subgroup discovery using a binary target concept, we applied two real-world datasets in the social media domain, i.e., using data from the music platform last.fm and from the social photo sharing system Flickr. In addition, we utilized synthetic data generated using the Quest data generator. For detecting community patterns in an exceptional model mining approach, we applied a dataset from a large-scale online game. Below, we summarize the characteristics of the applied datasets.
1. last.fm (“The Million Song dataset”, Bertin-Mahieux et al. 2011): The dataset contains 505,216 songs and one song-tag relation. Each song is tagged with at least one tag. In total, 552,897 tags are contained. The tags are power-law distributed (cf. Bertin-Mahieux et al. 2011). For subgroup discovery, each tag is represented by a binary attribute. For evaluation, the dataset was replicated 1, 5, 10, 50 and 100 times.
2. MIRFLICKR-1M (Huiskes & Lew 2008): In this dataset, each picture is tagged with at least one tag. For subgroup discovery, all tags (binary attributes) and license data (owner, title, license – as nominal attributes) were utilized. In total, the dataset contained 906,280 attributes. In contrast to the tagging data, the license information yields very dense attributes. For evaluation, the dataset was replicated 1, 5, 10, 50 and 100 times.
3. Quest – IBM Quest Synthetic Data Generator (Agrawal & Srikant 1994): The Quest data generator is typically applied for creating synthetic market basket transaction data, e.g., for testing association rule mining algorithms. Typically, the generation yields baskets
with similar sizes. There are different parameters that can be supplied for generating the transactions, where we applied the numbers in brackets for generation:
a. Total number of transactions (3, 10, 30 million) b. Total number of different items (100 000) c. Average length of a transaction (15) d. Number of item patterns (100 000)
4. Massive Multiplayer Online Game – fleetgraph (attributed graph data): We crawled the data from a massive multiplayer online game and constructed a graph with the players as nodes; an edge was created between two players if they were co-engaged in a battle a certain number of times as discussed below.
a. Raw data: We collected the raw data from several websites, obtaining about 24.7 million textual battle reports, with a raw size of 79 GB. In addition, we collected the character profiles for the players using the game’s API, e.g., game party, participating alliance, information about solar systems and structure of the game universe, information about the game items like ships and weapons, etc. This resulted in a dataset with a total size of about 500 MB.
b. Graph construction: Here, an edge is created between two players if they were co-engaged in a battle, a certain minimal number of times (support), i.e., using a certain minimal support threshold. In addition, the graph is labeled using information about the participating players: We label the edge with the
intersection of the attributes of the participating players. Overall, for attributing the graph about 8,000 selectors and additional derived numerical indicators can be used, e.g., the number of times a player participated in a battle in a certain
alliance.
Exceptional Tags: Instantiating SD-MapR using SD-Map/SD-Map*
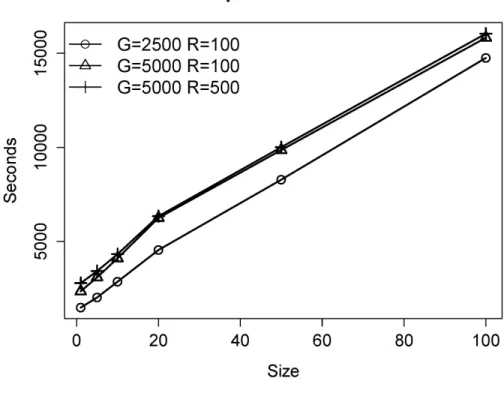
For the evaluation, we applied the three datasets (1-3) outlined above. Below, we show several runtime examples, selecting certain tags as binary targets (last.fm: tag rock, MIRFLICKR-1M: tag mcity, Quest: randomly selected tag for each run). Here, with respect to the selected target, a subgroup (pattern) should have a frequency of the target that deviates from the overall frequency in the database the most. We weight the difference of the target frequency in the subgroup and the total database by the square root of the size of the subgroup, thus applying the simplified binomial quality function (Atzmueller 2015) which is a standard quality function often applied in a subgroup discovery setting for a binary target variable. For running Map/Reduce, we used a twelve node Hadoop cluster. Each node had an AMD DualCore Opteron 2218 CPU with 2.6 GHz, 16 GB RAM, and 1 TB local storage on a 7200 rpm hard disk. Each node was configured to execute two mappers and two reducers, resulting in a total of 24 available slots.
Figure 1 shows the runtime of the SD-MapR instantiation on the last.fm dataset using different parameters for group partitioning (G) and reducers (R). Overall, we observe that the
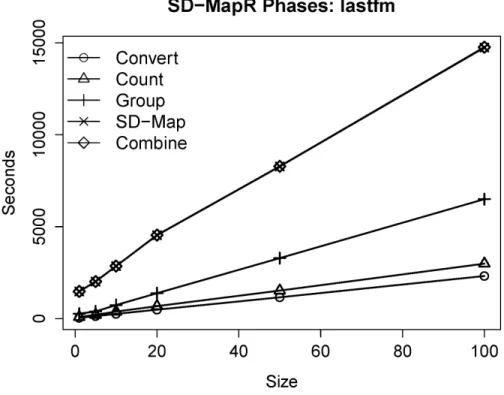
configuration with G=2500 groups and R=100 reducers provides both the most efficient data partitioning and computation of the local exceptionality detection task. Figure 2 shows a detailed view on the computational phases: In the phases that we outlined above for the SD-MapR
framework, the mentioned Convert phase (preprocessing and data integration) also includes the transformation of a dataset into a binary transaction oriented dataset, during the write operations to the Hadoop HDFS.
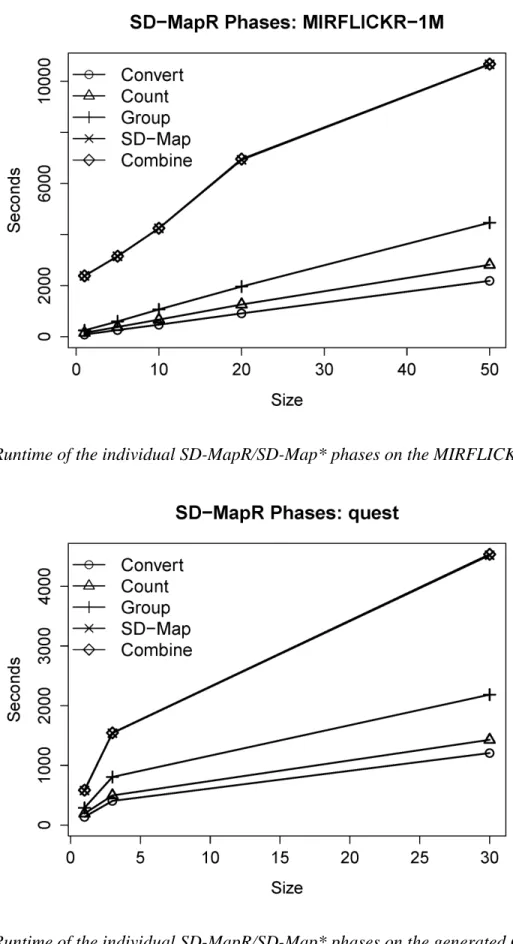
With a growing problem size, we observe a linear performance speedup. The SD-Map phase takes the most effort, which is explained by the effort on the extended pattern-tree construction. The overall sublinear performance of the SD-Map step is explained by the restricted size of the FP-Tree which is limited by the number of available selectors/patterns. Similar results are observed in Figures 3 & 4 for the MIRFLICKR-1M dataset. For larger datasets, we also observe a high impact on the SD-Map phase which can be explained by a more complex tree structure. Finally, Figure 5 shows the individual performance results on the Quest dataset. Again, we observe a stable linear scale up of the algorithm, also for significantly larger datasets. Overall, the runtime develops always linearly, which shows the huge potential of the approach for handling large datasets. SD-MapR provides the mechanisms for processing and mining large datasets in order enable large-scale local exceptionality detection. As we will see below, this also works well for more complex data, i.e., complex structured graph data.
Figure 2. Runtime of the individual SD-MapR/SD-Map* phases on the last.fm dataset
Figure 4. Runtime of the individual SD-MapR/SD-Map* phases on the MIRFLICKR-1M dataset
Exceptional Descriptive Communities: Instantiating SD-MapR with COMODO
For detecting exceptional descriptive communities we instantiated the SD-MapR framework with an adaptation of the COMODO algorithm (Atzmueller & Mitzlaff 2011, Atzmueller et al.
2015a). Here, the focus is on detecting densely connected groups (communities) in a
network/graph, where the covered nodes of the graph have a concise description in terms of assigned features. In our context of a massive online multiplayer game, we can, for example, focus on players that collaborate (forming their connections) and that are active in certain solar systems (properties of the players, respectively nodes in the network/graph).
We conducted the evaluation of this dataset on a three node Hadoop 1.2.1 cluster. Each node had 8 cores on an Intel Xeon E5-2690 CPU with 2.9 GHz and 64 GB of RAM allocated.
Furthermore, each node was configured to execute two map and reduce slots in parallel.
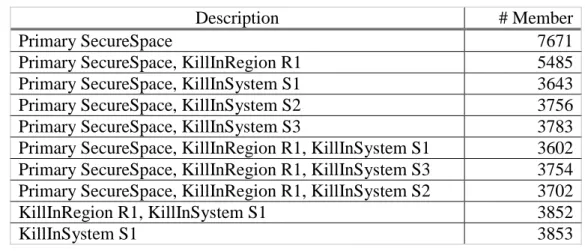
For the evaluation, we computed the fleetgraph as outlined above with a minimum edge support of 10, i.e., we connected two players if they collaborated in battles at least 10 times. With this constraint, the graph had about 37.2 million edges. The preprocessed input edge data set was 14 GB in total. The computation time for this dataset was 18 hours. The execution of COMODO on the projected databases lasted 17 hours. The steps before completed in one hour. For answering the question, whether we can find groups that are active in certain solar systems and/or spatial regions, and that are very successful or unsuccessful, we combined the Modularity quality function (on the graph) with the exceptional model mining slope function (on the number of wins/losses). Then, we applied SD-MapR/COMODO on a graph constructed from three month of battle reports. Table 1 shows exemplary results which revealed groups of players which fought in SecureSpace, where players can only interact rather regulated, i.e., they can only fight consensual or in formal wars without consequences. Also these systems (S1 – S3) are relatively these groups were primarily in two large alliances which had a war in the time frame selected and most battles took places in very few systems. Overall, the communities are rather large, which shows the good connectivity of players in the game, and their relation to different alliances when cooperating.
Description # Member
Primary SecureSpace 7671
Primary SecureSpace, KillInRegion R1 5485 Primary SecureSpace, KillInSystem S1 3643 Primary SecureSpace, KillInSystem S2 3756 Primary SecureSpace, KillInSystem S3 3783 Primary SecureSpace, KillInRegion R1, KillInSystem S1 3602 Primary SecureSpace, KillInRegion R1, KillInSystem S3 3754 Primary SecureSpace, KillInRegion R1, KillInSystem S2 3702 KillInRegion R1, KillInSystem S1 3852
KillInSystem S1 3853
Table 1: Top ten Exceptional Communities Solarsystem
Furthermore, we performed a speedup evaluation. Figure 6 shows the speedup using different mappers and reducers. In our configuration, we also observe a speedup that is linear with growing problem size, which demonstrates the applicability of the approach for large datasets. Thus, SD-MapR/COMODO is scalable for large-scale (exceptional) community detection tasks.
Figure 6. SD-MapR/COMODO speedup on the attributed graph dataset (massive multiplayer online game)
CONCLUSION
In this chapter, we presented the novel SD-MapR algorithmic framework for large-scale local exceptionality detection. We demonstrated the implementation using subgroup discovery methods that were instantiated utilizing the Map/Reduce framework. We outlined the basic algorithm and evaluated several scenarios using both real-world and synthetic datasets – ranging from structured tabular data to complex network data, i.e., in the form of attributed graphs. In summary, our evaluation results proved the scalability of the presented approach for large data sets.
FUTURE RESEARCH DIRECTIONS
For future research, we envision a large-scale processing and local exceptionality detection in heterogeneous data, including structured, semi-structured and unstructured (textual data) which is a typical requirement in many Big Data scenarios (McAfee et al. 2012). For that, information extraction (Cowie & Lehnert 1996) approaches, for example, statistical (e.g., McCallum et al. 2000) or rule-based methods (e.g., Atzmueller et al. 2008; Atzmueller & Nalepa 2009; Kluegl et al. 2009) can be applied. Here, also the detailed inspection of the patterns (Atzmueller & Puppe 2008) and the option of generating explanations (Roth-Berghofer 2004; Roth-Berghofer et al. 2005; Atzmueller & Roth-Berghofer 2010) for the discovered patterns are important future directions. In addition, data quality (e.g., Wang & Strong 1996) is an important aspect for large-scale data mining. Here, quality measures for the extracted relations (e.g., Atzmueller et al. 2005b) and the assessment and validation of the data, e.g., checking expected relations
(Atzmueller et al. 2005a) can then provide critical tools for estimating the data quality and for implementing strategies for increasing that.
Acknowledgements: This work has been partially supported by the German Federal Ministry of Education and Research (Bundesministerium für Bildung und Forschung, BMBF), project “FEE”, under the sponsorship reference number 01IS14006.
REFERENCES
Agrawal, R., & Srikant, R. (1994). Quest synthetic data generator. IBM Almaden Research Center.
Atzmueller, M. (2015). Subgroup Discovery – Advanced Review. WIREs: Data Mining and Knowledge Discovery, 5(1):35–49.
Atzmueller, M., Doerfel, S. & Mitzlaff, F. (2015a) Description-Oriented Community Detection using Exhaustive Subgroup Discovery. Information Sciences, 329, pp. 965-984
Atzmueller, M., Mueller, J. & Becker, M. (2015b) Exploratory Subgroup Analytics on
Ubiquitous Data. Mining, Modeling and Recommending 'Things' in Social Media, LNCS 8940, Springer Verlag, Heidelberg, Germany
Atzmueller, M., Kibanov, M., Hayat, N., Trojahn, M. & Kroll, D. (2015c) Adaptive Class Association Rule Mining for Human Activity Recognition. In: Proceedings of the International Workshop on Mining Ubiquitous and Social Environments (MUSE2015), CEUR-WS 1521, CEUR-WS.org, pp. 19-34
Atzmueller, M. & Lemmerich, F. (2013) Exploratory Pattern Mining on Social Media using Geo-References and Social Tagging Information. International Journal of Web Science, (2)1/2 2013.
Atzmueller, M. & Lemmerich, F. (2012). VIKAMINE - Open-Source Subgroup Discovery, Pattern Mining, and Analytics. In Proc. ECML/PKDD 2012: European Conference on Machine Learning and Principles and Practice of Knowledge Discovery in Databases. Springer, Berlin / Heidelberg.
Atzmueller, M., Doerfel, S., Hotho, A., Mitzlaff, F. & Stumme, G. (2012) Face-to-Face Contacts at a Conference: Dynamics of Communities and Roles. Modeling and Mining Ubiquitous Social Media, LNCS 7472, Springer Verlag, Heidelberg, Germany, 2012.
Atzmueller, M. & Roth-Berghofer, T. (2010). The Mining and Analysis Continuum of Explaining Uncovered. Proc. 30th SGAI International Conference on Artificial Intelligence (AI-2010). Atzmueller, M. & Nalepa, G. J. (2009). A Textual Subgroup Mining Approach for Rapid ARD+ Model Capture. Proc. 22nd International Florida Artificial Intelligence Research Society
Conference (FLAIRS), AAAI Press
Atzmueller, M. & Lemmerich, F. (2009) Fast Subgroup Discovery for Continuous Target
Concepts. Proc. 18th International Symposium on Methodologies for Intelligent Systems (ISMIS 2009), Springer Verlag, Berlin/Heidelberg
Atzmueller, M. & Kluegl, P. & Puppe, F. (2008). Rule-Based Information Extraction for Structured Data Acquisition using TextMarker. In Proc. LWA 2008. University of Wuerzburg. Atzmueller, M. & Puppe, F. (2008). A Case-Based Approach for Characterization and Analysis of Subgroup Patterns. Journal of Applied Intelligence, (28)3:210-221, 2008.
Atzmueller, M. (2007) Knowledge-Intensive Subgroup Mining -- Techniques for Automatic and Interactive Discovery. Dissertations in Artificial Intelligence-Infix (Diski), (307) IOS Press. Atzmueller, M. & Puppe, F. (2006). SD-Map – A Fast Algorithm for Exhaustive Subgroup Discovery.In Proc. PKDD 2006, number 4213 in LNAI, pages 6–17. Springer, Berlin / Heidelberg.
Atzmueller, M., Baumeister, J. & Puppe, F. (2005a) Quality Measures and Semi-Automatic Mining of Diagnostic Rule Bases. Proc. 15th International Conference on Applications of Declarative Programming and Knowledge Management, Springer, Berlin/Heidelberg.
Atzmueller, M., Puppe, F. (2005) Semi-Automatic Visual Subgroup Mining using VIKAMINE. Journal of Universal Computer Science, (11)11, pp. 1752--1765
Atzmueller M., Puppe, F. & Buscher, H.-P. (2005b). Profiling Examiners using Intelligent Subgroup Mining. Proc. 10th International Workshop on Intelligent Data Analysis in Medicine and Pharmacology (IDAMAP-2005), 46--51, Aberdeen, Scotland.
Bertin-Mahieux, T., Ellis, D. P., Whitman, B., & Lamere, P. (2011). The million song dataset. In ISMIR 2011: Proceedings of the 12th International Society for Music Information Retrieval Conference, October 24-28, 2011, Miami, Florida (pp. 591-596). University of Miami.
Cowie, J., & Lehnert, W. (1996). Information extraction. Communications of the ACM, 39(1), 80-91.
Dean, J., Ghemawat, S. (2008) MapReduce: Simplified Data Processing on Large Clusters. Communications of the ACM 51 (1), pp. 107-113
Duivesteijn, W., Feelders, A. & Knobbe, A. (2016) Exceptional Model Mining. Data Mining and Knowledge Discovery 30 (1), pp. 47-98
Grosskreutz H., Rüping S., Wrobel S. (2008) Tight Optimistic Estimates for Fast Subgroup Discovery. In: Proceedings of the ECML/PKDD. LNAI 5211, Springer Verlag,
Berlin/Heidelberg, pp. 440–456
Han J., Pei J. & Yin Y. (2000) Mining Frequent Patterns without Candidate Generation. In: Chen W, Naughton J, Bernstein PA (eds.) ACM SIGMOD International Conference on Management of Data. ACM Press, New York, pp. 1–12.
Huiskes, M. J., & Lew, M. S. (2008, October). The MIR Flickr retrieval evaluation. In
Proceedings of the 1st ACM international conference on Multimedia information retrieval (pp. 39-43). ACM.
Klösgen, W. (1996) Explora: A Multipattern and Multistrategy Discovery Assistant. In: Fayyad UM, Piatetsky-Shapiro G, Smyth P, Uthurusamy R, eds. Advances in Knowledge Discovery and Data Mining. Palo Alto, CA: AAAI Press; pp. 1996, 249–271.
Kluegl, P., Atzmueller, M. & Puppe, F. (2009) Meta-Level Information Extraction. The 32nd Annual Conference on Artificial Intelligence, Springer, Berlin/Heidelberg.
Leman, D., Feelders, A. & Knobbe A. (2008) Exceptional Model Mining. In: Proceedings of ECML/PKDD. Lecture Notes in Computer Science, vol. 5212. Heidelberg: Springer Verlag; 2008, pp. 1–16.
Lavrac, N., Kavsek, B., Flach, P. & Todorovski, L. (2004) Subgroup Discovery with CN2-SD. Journal of Machine Learning Research 5, pp. 153-188
Lemmerich F., Becker M., Atzmueller M. (2012) Generic Pattern Trees for Exhaustive Exceptional Model Mining. In: Proceedings of ECML/PKDD. LNAI 7524. Springer Verlag, Berlin/Heidelberg, pp. 277–292.
Li, H.,Wang, Y., Zhang, D., Zhang, M, Chang, E, (2008): PFP: Parallel FP-Growth for Query Recommendation. Proc. 2008 ACM conference on Recommender systems, ACM, New York McAfee, A., Brynjolfsson, E., Davenport, T. H., Patil, D. J., & Barton, D. (2012). Big data. The management revolution. Harvard Bus Rev, 90(10), 61-67.
McCallum, A., Freitag, D., & Pereira, F. C. (2000, June). Maximum Entropy Markov Models for Information Extraction and Segmentation. In ICML (Vol. 17, pp. 591-598).
Morik, K. (2002) Detecting Interesting Instances. In: Hand, D., Adams, N. & Bolton, R. Pattern Detection and Discovery. LNCS 2447, Springer, Berlin/Heidelberg, pp. 13-23
Newman, M. E. J. (2006) Modularity and Community Structure in Networks, Proceedings of the National Academy of Sciences 103 (23), pp. 8577–8582.
Roth-Berghofer, T. R. (2004). Explanations and case-based reasoning: Foundational issues. In Advances in case-based reasoning (pp. 389-403). Springer Berlin Heidelberg.
Roth-Berghofer, T., Cassens, J., & Sørmo, F. (2005). Goals and Kinds of Explanations in Case-Based Reasoning. In Wissensmanagement (pp. 264-268).
Trabold, D. & Grosskreutz, H. (2013). Parallel Subgroup Discovery on Computing Clusters— First results. In 2013 IEEE International Conference on Big Data (pp. 575-579). IEEE
Wang, R. Y., & Strong, D. M. (1996). Beyond accuracy: What data quality means to data consumers. Journal of management information systems, 5-33.
Wrobel S. (1997) An Algorithm for Multi-Relational Discovery of Subgroups. In: Proceedings of the 1st European Symposium on Principles of Data Mining and Knowledge Discovery.