San Jose State University
SJSU ScholarWorks
Mineta Transportation Institute Publications
7-1-2018
Train Wrecks and Track Attacks: An Analysis of
Attempts by Terrorists and Other Extremists to
Derail Trains or Disrupt Rail Transportation
Brian Michael Jenkins Mineta Transportation Institute Bruce R. Butterworth Mineta Transportation Institute
Follow this and additional works at:https://scholarworks.sjsu.edu/mti_publications Part of theTerrorism Studies Commons, and theTransportation Commons
This Report is brought to you for free and open access by SJSU ScholarWorks. It has been accepted for inclusion in Mineta Transportation Institute Publications by an authorized administrator of SJSU ScholarWorks. For more information, please [email protected].
Recommended Citation
Brian Michael Jenkins and Bruce R. Butterworth. "Train Wrecks and Track Attacks: An Analysis of Attempts by Terrorists and Other Extremists to Derail Trains or Disrupt Rail Transportation"Mineta Transportation Institute Publications(2018).
Train Wrecks and Track Attacks:
An Analysis of Attempts by Terrorists and Other
Extremists to Derail Trains or Disrupt Rail Transportation
Brian Michael Jenkins
Bruce R. Butterworth
Founded in 1991, the Mineta Transportation Institute (MTI), an organized research and training unit in partnership with the Lucas College and Graduate School of Business at San José State University (SJSU), increases mobility for all by improving the safety, efficiency, accessibility, and convenience of our nation’s transportation system. Through research, education, workforce development, and technology transfer, we help create a connected world. MTI leads the four-university Mineta Consortium for Transportation Mobility, a Tier 1 University Transportation Center funded by the U.S. Department of Transportation’s Office of the Assistant Secretary for Research and Technology (OST-R), the California Department of Transportation (Caltrans), and by private grants and donations.
MTI’s transportation policy work is centered on three primary responsibilities:
MINETA TRANSPORTATION INSTITUTE
LEAD UNIVERSITY OF
Mineta Consortium for Transportation Mobility
Research
MTI works to provide policy-oriented research for all levels of government and the private sector to foster the development of optimum surface transportation systems. Research areas include: bicycle and pedestrian issues; financing public and private sector transportation improvements; intermodal connectivity and integration; safety and security of transportation systems; sustainability of transportation systems; transportation / land use / environment; and transportation planning and policy development. Certified Research Associates conduct the research. Certification requires an advanced degree, generally a Ph.D., a record of academic publications, and professional references. Research projects culminate in a peer-reviewed publication, available on TransWeb, the MTI website (http://transweb.sjsu.edu).
Education
The Institute supports education programs for students seeking a career in the development and operation of surface transportation systems. MTI, through San José State University, offers an AACSB-accredited Master of Science in Transportation Management and graduate certificates in Transportation Management, Transportation Security, and High-Speed Rail Management that serve to prepare the nation’s transportation managers for the 21st century. With the
active assistance of the California Department of Transportation (Caltrans), MTI delivers its classes over a state-of-the-art videoconference network throughout the state of California and via webcasting beyond, allowing working transportation professionals to pursue an advanced degree regardless of their location. To meet the needs of employers seeking a diverse workforce, MTI’s education program promotes enrollment to under-represented groups.
Information and Technology Transfer
MTI utilizes a diverse array of dissemination methods and media to ensure research results reach those responsible for managing change. These methods include publication, seminars, workshops, websites, social media, webinars, and other technology transfer mechanisms. Additionally, MTI promotes the availability of completed research to professional organizations and journals and works to integrate the research findings into the graduate education program. MTI’s extensive collection of transportation- related publications is integrated into San José State University’s world-class Martin Luther King, Jr. Library.
The contents of this report reflect the views of the authors, who are responsible for the facts and accuracy of the information presented herein. This document is disseminated in the interest of information exchange. The report is funded, partially or entirely, by a grant from the U.S. Department of Transportation’s University Transportation Centers Program. This report does not necessarily reflect the official views or policies of the U.S. government, State of California, or the Mineta Transportation Institute, who assume no liability for the contents or use thereof. This report does not constitute a standard specification, design standard, or regulation.
Disclaimer
MTI FOUNDER
Hon. Norman Y. Mineta
MTI BOARD OF TRUSTEES
Founder, Honorable Norman Mineta (Ex-Officio)
Secretary (ret.), US Department of Transportation
Vice Chair Hill & Knowlton, Inc.
Honorary Chair, Honorable Bill Shuster (Ex-Officio)
Chair
House Transportation and Infrastructure Committee United States House of Representatives
Honorary Co-Chair, Honorable Peter DeFazio (Ex-Officio)
Vice Chair
House Transportation and Infrastructure Committee United States House of Representatives
Chair, Grace Crunican (TE 2019)
General Manager
Bay Area Rapid Transit District (BART)
Vice Chair, Abbas Mohaddes (TE 2018)
President & COO Econolite Group Inc.
Executive Director, Karen Philbrick, Ph.D.
Mineta Transportation Institute San José State University
Richard Anderson (Ex-Officio)
President and CEO Amtrak
Laurie Berman (Ex-Officio)
Director
California Department of Transportation
Donna DeMartino (TE 2018)
General Manager and CEO San Joaquin Regional Transit District
Mortimer Downey* (TE 2018)
President
Mort Downey Consulting, LLC
Nuria Fernandez* (TE 2020)
General Manager & CEO Santa Clara Valley Transportation Authority
John Flaherty (TE 2020)
Senior Fellow Silicon Valley American Leadership Forum
Rose Guilbault (TE 2020)
Board Member Peninsula Corridor Joint Powers Board
Ed Hamberger (Ex-Officio)
President & CEO
Association of American Railroads
Steve Heminger* (TE 2018)
Executive Director Metropolitan Transportation Commission (MTC)
Diane Woodend Jones (TE 2019)
Principal & Chair of Board Lea + Elliot, Inc.
Will Kempton (TE 2019)
Retired
Art Leahy (TE 2018)
CEO Metrolink
Jean-Pierre Loubinoux (Ex-Officio)
Director General
International Union of Railways (UIC)
Bradley Mims (TE 2020)
President & CEO Conference of Minority
Transportation Officials (COMTO)
Jeff Morales (TE 2019)
Managing Principal InfraStrategies, LLC
Dan Moshavi, Ph.D. (Ex-Officio)
Dean
Lucas College and Graduate School of Business San José State University
Dan Smith (TE 2020)
President
Capstone Financial Group, Inc.
Paul Skoutelas (Ex-Officio)
President & CEO
American Public Transportation Authority (APTA)
Beverley Swaim-Staley (TE 2019)
President
Union Station Redevelopment Corporation
Larry Willis (Ex-Officio)
President
Transportation Trades Dept., AFL-CIO
Bud Wright (Ex-Officio)
Executive Director
American Association of State Highway and Transportation Officials (AASHTO) (TE) = Term Expiration * = Past Chair, Board of Trustees
Karen Philbrick, Ph.D.
Executive Director
Asha Weinstein Agrawal, Ph.D.
Education Director
National Transportation Finance Center Urban and Regional Planning
San José State University
Hilary Nixon, Ph.D.
Research & Technology Transfer Director
Brian Michael Jenkins
National Transportation Safety and Security Center Director
Ben Tripousis
National High-Speed Rail Connectivity Center Director
Jan Botha, Ph.D.
Civil & Environmental Engineering San José State University
Katherine Kao Cushing, Ph.D.
Enviromental Science San José State University
Dave Czerwinski, Ph.D.
Marketing and Decision Science San José State University
Frances Edwards, Ph.D.
Political Science San José State University
Taeho Park, Ph.D.
Organization and Management San José State University
Christa Bailey
Martin Luther King, Jr. Library San José State University
A publication of
REPORT 18-07
TRAIN WRECKS AND TRACK ATTACKS:
AN ANALYSIS OF ATTEMPTS BY TERRORISTS AND
OTHER EXTREMISTS TO DERAIL TRAINS OR
DISRUPT RAIL TRANSPORTATION
Brian Michael Jenkins Bruce R. Butterworth
TECHNICAL REPORT DOCUMENTATION PAGE
1. Report No. 2. Government Accession No. 3. Recipient’s Catalog No.
4. Title and Subtitle 5. Report Date
6. Performing Organization Code
7. Authors 8. Performing Organization Report
9. Performing Organization Name and Address 10. Work Unit No. 11. Contract or Grant No.
12. Sponsoring Agency Name and Address 13. Type of Report and Period Covered 14. Sponsoring Agency Code
15. Supplemental Notes 16. Abstract
17. Key Words 18. Distribution Statement
19. Security Classif. (of this report) 20. Security Classif. (of this page) 21. No. of Pages 22. Price
Form DOT F 1700.7 (8-72)
61 18-07
Train Wrecks and Track Attacks: An Analysis of Attempts by Terrorists and Other
Extremists to Derail Trains or Disrupt Rail Transportation July 2018
CA-MTI-1794 Brian Michael Jenkins, https://orcid.org/0000-0001-6583-7790
Bruce R. Butterworth, https://orcid.org/0000-0002-5105-9788
Mineta Transportation Institute College of Business
San José State University San José, CA 95192-0219
Office of Intelligence and Analysis Department of Homeland Security 245 Murray Lane SW
Washington, DC 20528-0075
Final Report
Unclassified Unclassified
No restrictions. This document is available to the public through The National Technical Information Service, Springfield, VA 22161
HSTS02-17-C-OIA173
$15.00 Security; terrorism; derailments;
trains; bombings
Attempts to sabotage rails and deliberately derail passenger trains have a long history in conventional and guerrilla warfare as well as during some particularly bitter labor disputes in the past. Since the 1970s, political fanatics have become a major adversary. Terrorists have sought to derail trains to achieve high-casualty events, while anarchists and issue oriented extremists have attacked rails to attract attention to their causes and impose economic damage.
In the following report, we examine the more than a thousand attempts to derail trains and to attack rail infrastructure to discern overall patterns and trends. We then look at four subsets of attacks in greater detail: those by India’s Maoist guerrillas; those by separatist insurgents in Thailand; those by various jihadist groups worldwide; and those by an assemblage of anarchists, environmental and similar cause-oriented extremists in Europe. How do these adversaries compare in terms of tactics, success rates, lethality, and other factors? Do their different objectives and circumstances affect their actions? Perhaps most important, is there evidence that they become more effective and lethal over time?
To order this publication, please contact:
Mineta Transportation Institute College of Business San José State University San José, CA 95192-0219
Tel: (408) 924-7560 Fax: (408) 924-7565 Email: [email protected]
transweb.sjsu.edu
by Mineta Transportation Institute
All rights reserved
Library of Congress Catalog Card Number: Copyright © 2018
Mineta Transportation Institute
iv
ACKNOWLEDGMENTS
The authors thank MTI staff, including Executive Director Karen Philbrick, Ph.D.; Research and Technology Transfer Director Hilary Nixon, Ph.D.; Research Support Assistant Joseph Mercado; Executive Administrative Assistant Jill Carter; and Editor Jan Steckel.
v
TABLE OF CONTENTS
Executive Summary 1
I. Attempts to Derail Passenger Trains and Disrupt Rail Transportation 3
The Latest Jihadist Appeals 3
MTI’s 2010 Study of Deliberate Derailments 5
II. The Current Analysis 7
III. How Many Derailment Attempts are Successful? 11
Trends Over Time 13
IV. Track Attacks—Frequent but Not Lethal 16
V. Analysis of Four Different Groups Using Derailment and Track Attacks 24
Environmental Extremists and Anarchists in Europe 27 The Islamist Insurgency in Southern Thailand 30 The Naxalite-Maoist Insurgency in India 35
Jihadist Attacks Worldwide 44
VI. Conclusion 51
Abbreviations and Acronyms 52
Endnotes 53
Bibliography 55
About the Authors 57
Mineta Transportation Institute
vi
LIST OF FIGURES
1. Derailment Attack Types Over Time 14 2. Derailment Lethality Over Time 14 3. Comparison of Different Attacks on All Passenger Public Surface
Transport Targets Over Time 15
4. Comparison of Different Attack Lethality on All Passenger Public
Surface Transport Targets Over Time 15 5. European Anarchist/Environmental Attacks Over Time 28 6. Thai Islamic Separatist Attacks Over Time 31 7. Thai Islamic Separatist Lethality Over Time 31
8. Maoist Attacks Over Time 36
9. Lethality of Maoist Attacks Over Time 36 10. Jihadist Attacks Over Time – Scale Adjusted 48 11. Jihadist Lethality Over Time – Scale Constant 48 12. Jihadist Lethality Over Time – Scale Adjusted 49
vii
LIST OF TABLES
1. Derailments as % of Train Passenger Attacks 7 2. Derailment Attacks by Region 8 3. Derailment Attacks by Country 8
4. Outcome of Devices 12
5. Outcome of Derailment Attempts 13
6. Track Attacks by Target 16
7. Track Attacks by Target Group 17 8. Track Attacks by Weapon and Method of Attack 17
9. Track Attacks by Region 19
10. Track Attacks by Country 19
11. Track Attacks by Bomb Delivery Method 21 12. Track Attacks by Bomb Outcome 22 13. Track Bombs Detected Before Attacks 23 14. Derailment Attacks by Attacker Type – Frequency 25 15. Derailment Attacks by Attacker Type – Lethality 26 16. Comparison of Derailment Lethality for Three Groups 26 17. Track Attacks by Frequency 27 18. European Environmental or Anarchist Attacks by Weapon 29 19. European Environmental or Anarchist Attacks by Target 29 20. Thai Islamic Separatist Attacks by Target 32 21. Thai Islamic Separatist Attacks by Attack Method 33
Mineta Transportation Institute
viii List of Tables
24. Maoist Attacks by Target Group 38 25. Maoist Attacks – Train Derailments Only 38 26. Maoist Attacks on Railway Tracks, Bridges and Tunnels 39 27. Maoist Attacks on Other Infrastructure Targets 40 28. Maoist Devices by Concealment and Delivery Method 41 29. Maoist Devices by Outcome 42
30. Maoist Devices Detected 43
31. Jihadist Attacks by Target 44 32. Jihadist Derailments by Attack Method 45 33. Jihadist Attacks by Country 46 34. Chechen and Dagestan Attacks Added to Russian Jihadist Attacks 46 35. All Jihadist Attack Methods Against Passenger Trains and Train Stations 47 36. Jihadist Devices by Outcome 50
1
EXECUTIVE SUMMARY
In July 2017, both the Islamic State of Iraq and (greater) Syria (ISIS) and al Qaeda in the Arab Peninsula (AQAP) exhorted their followers around the world to derail trains. AQAP included in its online magazine detailed instructions on how to make a derailment device. According to the database maintained by the Mineta Transportation Institute (MTI), in the nearly 12 months since the two leading jihadist groups suggested derailing trains, there has been no noticeable uptick in attempts.
MTI’s database shows that between 1970 and the end of 2017, there were 282 attempts to deliberately derail trains and 817 additional attacks on railway infrastructure, including tracks, bridges, tunnels, signaling, and other right-of-way equipment. Of the 282 attempts to derail trains, 118 (or 42%) resulted in a derailment.
Derailments are intended to cause casualties, while attacks on tracks and other right-of-way infrastructure are primarily intended to cause disruption and attract attention.
South Asia leads in the number of derailment attempts with 57.8% of the attempts, followed by the countries of Western Europe, and the Middle East and North Africa. South Asia also accounts for 54.4% of the fatalities. While Western Europe accounts for 10.6% of the attacks, it accounts for less than one percent of the fatalities. The overall average number of fatalities per attack (FPA) is 3.8. (A similar measure of lethality used in the charts is for injuries, stated as injuries per attack, or IPA).
Improvised Explosive Devices (IEDs) were used to derail trains in 75.7% of the cases. Mechanical means of sabotage (by removing bolts or rails, loosening plates, or tampering with switches) were employed in nearly all the remaining cases.
Mechanical means of derailments have a higher lethality rate per attack than do derailments using IEDs. Derailments caused by IEDs account for 23.6% of the total number of deaths. Mechanical means of sabotage account for 48.8% of the fatalities. Mechanical derailments are by far the most lethal form of attacking the passenger train network.
Attackers placed a total of 279 IEDs in the attacks, 58.1% of which detonated on target. The remainder were discovered before detonation and rendered safe, or they malfunctioned. In the remaining cases, the device exploded but was not placed correctly.
The deadliest attacks were those which combined derailments with armed assaults. These accounted for 27.6% of total fatalities, but a single episode in Angola killing 259 accounts for a large share of these fatalities. Excluding this incident, the figures shift somewhat, but the conclusion remains the same. Derailments caused by mechanical sabotage account for 64.4% of the fatalities; derailments by bombings alone account for 31.1% of the fatalities. The rate of bomb-caused and mechanical derailments have both increased over time, with
Mineta Transportation Institute
2 Executive Summary
Derailment attacks have not increased nearly as much as all other attacks on all passengers in all surface transportation targets (including passenger trains and stations, buses and bus stations and stops, and passenger ferries and ferry terminals). This suggests that adversaries are increasingly going after surface transportation targets, but are concentrating on easier modes of attack. The lethality of derailment attacks is increasing slightly, however, while the lethality of all other attacks against passenger targets, and then train passenger targets, is decreasing – a significant finding.
Track attacks are also increasing, although this may be the result of improved reporting. 80.9% of the attacks were directed at railway tracks, bridges and tunnels, and not other infrastructure such as signaling and power systems.
Most track attacks are designed to disrupt, not to kill. Only 48 persons were killed and 268 injured in 817 attacks. Most of the deaths derived from attacks where security and maintenance personnel working on the tracks were targeted.
Bombing is the most common tactic in track attacks, accounting for 85.9% of the attacks, followed by mechanical sabotage and arson. Remarkably, 26.7% of the IEDs were discovered before they detonated.
In order to examine differences in motives, objectives, and modes of operating, the researchers looked at four specific groups of perpetrators: an assemblage of anarchist and environmentalist extremists in Europe; Maoist guerrillas in India; separatist insurgents in southern Thailand; and jihadists worldwide. These particular attackers were chosen because they have engaged in continuing campaigns which account for a large share of recent attacks where the perpetrators have been identified.
European extremists, who carried out attacks on tracks and right-of-way infrastructure in four countries (Germany, Italy, United Kingdom, and France) relied primarily on mechanical means of sabotage (45%) and improvised incendiary devices (42%) rather than explosive devices. There were no casualties in any of the attacks.
India’s Maoist or Naxalite guerrillas were the most prolific attackers, accounting for 37 derailment attempts and 135 track attacks. Their derailment attacks had the second highest lethality ranking after the jihadists. Over the long run, their attacks appear to be increasing in volume and lethality.
Separatist insurgents in southern Thailand accounted for 44 attacks (both attempted derailments and track attacks). Although competent bombmakers (95% of their devices detonated on target), they placed a distant third in the lethality of their derailment attempts, suggesting self-imposed constraints.
The jihadists are not the most prolific attackers and not the most competent bombmakers, but have achieved the highest lethality — their fatalities-per-attack score for derailments is nearly four times that of the Maoist guerrillas and seven times more than the average for all derailment attempts.
3
I. ATTEMPTS TO DERAIL PASSENGER TRAINS AND
DISRUPT RAIL TRANSPORTATION
Attempts to sabotage rails and deliberately derail passenger trains have a long history in conventional and guerrilla warfare as well asduring some particularly bitter labor disputes in the past. Since the 1970s, political fanatics have become a major adversary. Terrorists have sought to derail trains to achieve high-casualty events, while anarchists and issue-oriented extremists have attacked rails to attract attention to their causes and impose economic damage.
In the following report, we examine the more than a thousand attempts to derail trains and to attack rail infrastructure to discern overall patterns and trends. We then look at four subsets of attacks in greater detail: those by India’s Maoist guerrillas; those by separatist insurgents in Thailand; those by various jihadist groups worldwide; and those by an assemblage of anarchists, environmental and similar cause-oriented extremists in Europe. How do these adversaries compare in terms of tactics, success rates, lethality, and other factors? Do their different objectives and circumstances affect their actions? Perhaps most important, is there evidence that they become more effective and lethal over time?
THE LATEST JIHADIST APPEALS
As the Islamic State steadily lost ground to counterterrorist offensives in Iraq and Syria, ISIS followers discussed various ways to cause catastrophes and impact Western economies, including derailing high-speed commuter trains and blowing up oil and gas pipelines. Since its emergence in 2013, ISIS has issued a torrent of exhortations and appeals to its followers to take action wherever they are, often suggesting specific forms of attack. Much of this is propaganda calculated to impress followers and frighten foes. However, the 2015 attempted armed assault on passengers in a high-speed train traveling between Amsterdam and Paris, the bombing attacks on the subway system in Brussels in 2016 and on its central train station in 2017, and an attack on train passengers in Germany in 2016 by ISIS supporters, made it clear that public surface transportation presents an enticing target to jihadists.
At nearly the same time, AQAP featured the idea of derailing trains in the 17th issue of its
online magazine Inspire. A lead article by Ibrahim ibn Hassan al-Asri discusses the utility of attacks on transportation systems in general.1 A Saudi jihadist who is believed to be
AQAP’s lead bomb maker and considered responsible for building the devices used by the Underwear bomber in 2009 as well as for another plot to sabotage airliners uncovered in 2012, al-Asri seems to have become the group’s Chief Technology Officer, a sort of terrorist Tom Swift, inventing new schemes for attack. While articles like the one in Inspire
fuel jihadist fantasies, they also are intended to encourage the kind of audacious scenarios and spectacular actions jihadist leaders want and, therefore, they are indicators of intent.
Mineta Transportation Institute
4 Attempts to Derail Passenger Trains and Disrupt Rail Transportation
Increasing security measures, he points out, only “increases the feeling of insecurity and fear among the people.” Such attacks are “disastrous to the economy,” especially “if they occur regularly.”
Derailing trains to achieve mass casualties has attracted al Qaeda’s planners for years. Computer files recovered during the 2011 raid on Osama bin Laden’s hideout in Pakistan indicated that at the time of his death, the leader of al Qaeda was looking for ways to carry out a major terrorist attack in the United States in order to demonstrate that the jihadist enterprise was still in business ten years after 9/11. Reportedly, his proposed plan, which dated back to February 2010, was to derail a passenger train as it crossed a high bridge, sending the coaches plunging into a river or deep valley, potentially killing hundreds. Al-Asri goes on to describe two ways to target rail lines. The first is to destroy rail lines to create delay and disruption. The second is to destroy the line just “minutes before the train arrives, so as to derail the train.” In this report, we have divided railway attacks into attacks on rails and other infrastructure intended to cause disruption and attacks intended to cause derailments of passenger trains.
Trains careening into ravines are a common terrorist fantasy. We do not know what may have inspired Osama bin Laden’s 2010 scenario. Deadly accidents have sometimes provided ideas for terrorists. In Pakistan, bin Laden would have been able to read about the numerous accidents as well as incidents of sabotage that affected both Pakistan and India. Derailments, accidental or deliberate, are not uncommon in these two countries. Together, India and Pakistan account for 56percent of both track and derailment attacks, and more than 50percent of attempted derailments.
Issue 17 of Inspire displays a timeline of train major derailments in America dating back to 1904. None of these were the result of sabotage, but are offered as evidence of the significant casualties that are possible when a train derails. The feature story of Issue 17 provides a plotted history of transportation in the modern world followed by a discussion of how trains stay on rails. It illustrates a portable derailer, which is used by railroads in situations where it is necessary to ensure that unauthorized train movements or unattended rolling stock do not accidentally proceed beyond some point.
The magazine then describes a “design concept for the homemade derail tool,” using reinforced concrete, and provides step-by-step instructions for making one and advice on how to place it to cause maximum death and destruction. It notes that the “lone Mujahid (or warrior) will have to be aware of train routes and traffic patterns and should try to place the device about ten minutes before the targeted train passes.” To assist, the magazine includes a list of the major passenger train routes in America and a map displaying railroad lines by ownership.
The information on routes is readily available on the Internet and far too general to be operationally useful, while the operation called for is more challenging than the article implies. Some of the techniques things described in previous issues of Inspire probably would not work, and it is not clear that the derailing device as described would derail a speeding train or instead be knocked off the tracks or pulverized by the wheels.
5 Attempts to Derail Passenger Trains and Disrupt Rail Transportation
As with all propaganda, terrorist propaganda is aimed primarily at the home front—would-be jihadists. The objective of such articles is to motivate followers to do things that are theoretically within their reach, but also to enable its readers to fantasize that, even if they don’t build derailers, which few will do, they are in on the jihad. Rather than boring sermons on ideology or theoretical discussions of tactics, illustrated instructions on how to build terrorist devices, beyond any instructional value, are a means of engaging the intended audience (at least vicariously) in the armed struggle. It introduces eager readers into the realm of violence, encouraging them to think as if they themselves were engaged in “the real thing,” a dangerous and exciting campaign of death and destruction. It is terrorist porn. A third objective is to enable the jihadist organizations to claim credit for events that subsequently occur. It makes no difference if an attack was actually inspired by the jihadist appeal —a tactic was proposed, and an attack took place.
MTI’S 2010 STUDY OF DELIBERATE DERAILMENTS
This is not a new area of MTI inquiry. In a 2010 report, MTI published the results of an analysis of the 181 derailment attempts then in its database, most of them by terrorists, including environmental extremists, as well as other adversaries; 170 of these occurred after 1970. (The 11 other cases, which took place between 1920 and 1969, were set aside because of lack of data during this period about anything but the most spectacular and lethal attacks.)
In the eight years since the 2010 study, MTI has updated its database, has added some incidents previously missed or about which little information was available at the time, and was able to obtain additional details on other incidents. All of this enabled the authors to take a more detailed look at these tactics. The following brief review of the 2010 findings points out further changes to the earlier analysis.
This 2010 analysis found that derailment attacks overall between 1970 and the end of 2009 accounted for 10.5 percent of the all attacks on public surface transportation and 9.5 percent of all fatalities.2
South Asia accounted for roughly a third of events, followed by Western Europe, Russia and the NIS (Newly Independent States of the former Soviet Union), the Middle East, and Southeast Asia.3 By country, India, Russia, Pakistan, United Kingdom, and Thailand lead
the list. The distinction between the “developed” and “developing” world is blurring and these terms are used less frequently, but dividing the world according to this old concept it appears that the majority of the attacks occurred in the “developing” world, again led by India and Pakistan, which together accounted for about a third of all incidents. The average number of fatalities per attack in the “developed” world was 2.3 compared to 4.7 fatalities per attack in the “developing” world.
Mineta Transportation Institute
6 Attempts to Derail Passenger Trains and Disrupt Rail Transportation
Terrorists and other adversaries may attempt to derail trains by placing improvised explosive devices (IEDs) next to the tracks or burying them beneath the rails. We refer to these devices in the database as “track bombs.” Alternatively, saboteurs may attempt to derail trains by removing spikes; loosening or removing the spikes, bolts and plates that hold the rails in place; or removing portions of the track itself. In a few cases, saboteurs have attempted to derail trains by placing concrete blocks or other objects on the rails. We refer to these various methods here as “mechanical means.”
When there are no bombs, it is not always clearly established that a derailment is deliberate. In a few cases where operators have claimed or authorities have suspected sabotage, allegations also have been made that operators were trying to avoid responsibility for poor maintenance by blaming imaginary saboteurs.
The 2010 study did not try to count track attacks as a separate category from derailment attempts. It focused exclusively on derailment attempts, although the authors noted that in a few cases it was not always clearly established that a derailment was the objective. This was especially true in cases where mechanical sabotage was involved, or instead the attempt was intended simply to disrupt the railway system. (We have since reexamined these cases, imposing a tighter definition on apparent derailment attempts. As a result, we have recategorized 10 of the cases as being disruptive attacks rather than attempted derailments, leaving 171 derailments or attempted derailments to be included in the present study.)
The adversaries succeeded in derailing a train in 69 cases. In 40 more cases, they clearly intended to derail a train, but the train passed over but failed to detonate the bomb; the bomb detonated but failed to derail the train; or the train was able to stop before reaching the point where an explosion had occurred. The intent of the remaining 72 cases is not clear. Some appear to have been attempted derailments, but authorities discovered the bomb before it detonated. In other cases, the attack may have been intended to merely cause disruption, and these have been recategorized as track attacks in the present study. Although bombs were almost four times more likely to be used than mechanical means of sabotage, the latter proved more effective in derailing trains than bombs. In 149 bomb attacks, terrorists were able to derail all or a portion of 47 trains. However, when we limited the cases to those where it was clearly the intent of adversaries to derail a train, then in 81 attempted derailments they succeeded 47 times or 58 percent of the time. In contrast, of 22 attempted derailments using mechanical means, the adversaries succeeded 19 times or 86.4 percent of the time.
Mechanical means of sabotage also caused more casualties per incident. Events involving explosives resulted in an average of four fatalities per event, while events involving mechanical sabotage involved an average of 15 fatalities per event.
In sum, attempted derailments accounted for about a tenth of all incidents and fatalities. Most of the attacks and the deadliest attacks occurred in the developing world. Bombs were used more often than mechanical sabotage, but mechanical sabotage was more effective than explosives in derailing trains and causing casualties. We will see how the new study alters these findings.
7
II. THE CURRENT ANALYSIS
This current of analysis covers events between 1970 and December 31, 2017. In addition to adding the cases that occurred between 2010 and the end of 2017, the analysis encompasses a broader array of attacks compared to the 2010 report discussed above. The researchers have now included attacks designed to destroy or damage railway infrastructure, designed more broadly to include not just attacks against railway tracks, bridges and tunnels, but against another set of railway infrastructure targets. These include the following targets: (1) Railway Signals, Communications (abbreviated in charts as “Comm.”) and Power Systems; (2) Train Service Facilities or Equipment; (3) Maintenance or Inspection Trains; (4) Railway Personnel or Company Offices, (5) Track-related Personnel Security; and (6) Construction Sites. There are 817 attacks in the time period studied.
As mentioned above, we recently reclassified a number of the incidents included in the 2010 report, and the number of derailment attacks for the 1970 to 2009 period decreased from 181 to 171. The current analysis, however, includes 111 additional derailment attacks for a total of 282. Using the revised figure for the 1970 to 2009 period and comparing it to the increased figure for 1970 to 2017, we see that derailment attacks account for roughly the same percentage of attacks on public surface transportation as shown in Table 1.
Table 1. Derailments as % of Train Passenger Attacks
Time Period Derailment Attacks % of All Passenger Train Attacks % of All Attacks
1/1/1970 - 12/31/2009 171 22.2% 5.9%
1/1/1970 - 12/31/2017 282 24.0% 5.3%
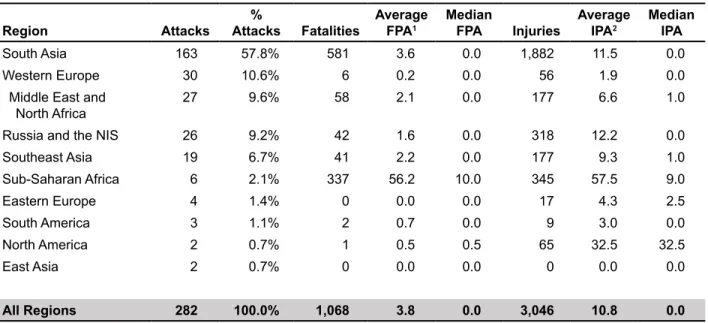
Looking at the regions of the world, South Asia leads in the number of derailment attempts, with 57.8 percent of the attacks, followed by Western Europe and the Middle East and North Africa (see Table 2). The distribution of fatalities has South Asia accounting for 54.4 percent of the total number of fatalities, followed by sub-Saharan Africa, and the Middle East and North Africa. While Western Europe accounts for 10.9 percent of the attacks, it accounts for less than one percent of the fatalities worldwide. The overall average of fatalities per attack (FPA) is 3.8. Sub-Saharan Africa has the highest FPA average at 56.2. Putting aside one exceptionally deadly incident in Angola, which drives this figure, the region still has an FPA of 15.6. By contrast, western Europe has an FPA of 0.02.
Mineta Transportation Institute
8 The Current Analysis
Table 2. Derailment Attacks by Region
Region Attacks Attacks% Fatalities Average FPA1 Median FPA Injuries Average IPA2 Median IPA
South Asia 163 57.8% 581 3.6 0.0 1,882 11.5 0.0 Western Europe 30 10.6% 6 0.2 0.0 56 1.9 0.0
Middle East and
North Africa 27 9.6% 58 2.1 0.0 177 6.6 1.0 Russia and the NIS 26 9.2% 42 1.6 0.0 318 12.2 0.0 Southeast Asia 19 6.7% 41 2.2 0.0 177 9.3 1.0 Sub-Saharan Africa 6 2.1% 337 56.2 10.0 345 57.5 9.0 Eastern Europe 4 1.4% 0 0.0 0.0 17 4.3 2.5 South America 3 1.1% 2 0.7 0.0 9 3.0 0.0 North America 2 0.7% 1 0.5 0.5 65 32.5 32.5 East Asia 2 0.7% 0 0.0 0.0 0 0.0 0.0 All Regions 282 100.0% 1,068 3.8 0.0 3,046 10.8 0.0 Notes:
1 FPA = Fatalities per attack. 2 IPA = Injuries per attack.
Turning to individual countries, India alone accounts 29.1% of the attacks, followed by Pakistan with 23.4%, and then the Russian Federation with 7.8% (see Table 3). In terms of fatalities, India accounts for 45.8 percent of all fatalities from derailments, followed by Angola, which had one spectacular case involving 259 fatalities. Pakistan comes next with 6.3 percent of the fatalities. Once again, the overall FPA is 3.8, and other than Angola and Mozambique, which also had a single derailment killing 58 people, the above average FPAs were attained in Cambodia (9.3), Algeria (7.3) and finally India (6.0), with a surprisingly lower FPA in Pakistan (1.0). The lethality of derailments in Western Europe was very low, with the highest being Italy (0.9).
Table 3. Derailment Attacks by Country
Country Attacks Attacks% Fatalities Average FPA1 Median FPA Injuries Average IPA2 Median IPA
India 82 29.1% 489 6.0 0.0 1,334 16.3 0.0 Pakistan 66 23.4% 67 1.0 0.0 361 5.5 0.0 Russian Federation 22 7.8% 42 1.9 0.0 318 14.5 0.0 Turkey 11 3.9% 6 0.5 0.0 59 5.4 1.0 Bangladesh 10 3.5% 25 2.5 0.0 179 17.9 7.0 Thailand 10 3.5% 4 0.4 0.0 71 7.1 0.5 Algeria 7 2.5% 51 7.3 8.0 97 13.9 20.0 Italy 7 2.5% 6 0.9 0.0 54 7.7 0.0 United Kingdom 7 2.5% 0 0.0 0.0 1 0.1 0.0 Germany 6 2.1% 0 0.0 0.0 1 0.2 0.0 France 5 1.8% 0 0.0 0.0 0 0.0 0.0 Israel 4 1.4% 0 0.0 0.0 3 0.8 0.5 Spain 4 1.4% 0 0.0 0.0 0 0.0 0.0
9 The Current Analysis
Country Attacks Attacks% Fatalities Average FPA1 Median FPA Injuries Average IPA2 Median IPA
Sri Lanka 4 1.4% 0 0.0 0.0 8 2.0 2.0 Cambodia 3 1.1% 28 9.3 13.0 85 28.3 5.0 Myanmar 3 1.1% 9 3.0 0.0 9 3.0 2.0 Georgia 3 1.1% 0 0.0 0.0 0 0.0 0.0 Angola 2 0.7% 278 139.0 139.0 167 83.5 83.5 Peru 2 0.7% 2 1.0 1.0 9 4.5 4.5 Syria 2 0.7% 1 0.5 0.5 18 9.0 9.0 United States 2 0.7% 1 0.5 0.5 65 32.5 32.5 Egypt 2 0.7% 0 0.0 0.0 0 0.0 0.0 Indonesia 2 0.7% 0 0.0 0.0 12 6.0 6.0 Mozambique 1 0.4% 58 58.0 58.0 160 160.0 160.0 Zambia 1 0.4% 1 1.0 1.0 12 12.0 12.0 Argentina 1 0.4% 0 0.0 0.0 0 0.0 0.0 Czech Republic 1 0.4% 0 0.0 0.0 0 0.0 0.0 Djibouti 1 0.4% 0 0.0 0.0 6 6.0 6.0 Ethiopia 1 0.4% 0 0.0 0.0 0 0.0 0.0 Iraq 1 0.4% 0 0.0 0.0 0 0.0 0.0 Ireland 1 0.4% 0 0.0 0.0 0 0.0 0.0 Japan 1 0.4% 0 0.0 0.0 0 0.0 0.0 Kosovo 1 0.4% 0 0.0 0.0 5 5.0 5.0 Lithuania 1 0.4% 0 0.0 0.0 0 0.0 0.0 Macedonia 1 0.4% 0 0.0 0.0 0 0.0 0.0 Malaysia 1 0.4% 0 0.0 0.0 0 0.0 0.0 Nepal 1 0.4% 0 0.0 0.0 0 0.0 0.0 North Korea 1 0.4% 0 0.0 0.0 0 0.0 0.0 Poland 1 0.4% 0 0.0 0.0 12 12.0 12.0 All Countries 282 100% 1,068 3.8 0.0 3,046 10.8 0.0 Notes:
1 FPA = Fatalities per attack. 2 IPA = Injuries per attack.
Bombs were the preferred method of derailing trains, accounting for 212 (or 75.7 percent) of the 282 attempts. Ten additional incidents saw derailments using explosives combined with subsequent armed assaults on the passengers, bringing the total of bombings to 75.9 percent.
Fatalities from derailments caused by mechanical means, however, account for 48.8 percent of the deaths. Mechanical means of sabotage had an FPA of 9.8, more than eight times the FPA of those caused by bombings, with an FPA of 1.2. Derailments from bombings accounted for only 23.6 percent of the total number of deaths.
Mineta Transportation Institute
10 The Current Analysis
The deadliest attacks were those which combined derailments with armed assaults. These accounted for 27.6 percent of total fatalities, but again a single episode in Angola drives these figures up. If this incident is excluded, the figures shift somewhat, but the conclusion remains the same. Derailments caused by mechanical sabotage account for 64.4 percent of the fatalities, while derailments by bombings alone account for 31.1 percent of the fatalities. Comparing mechanical derailments with broader sets of data shows how lethal they are. For example, looking at attacks against passenger train targets, which includes train stations, mechanical derailments are the 3rd most lethal attack method. If we exclude two
incidents involving multiple weapon combinations (one of which involves a derailment in Angola killing 259, and the other an attack in Cambodia killing 150), however, it becomes clear that mechanical derailments are in fact the most lethal passenger train attack method. If we look only at passenger trains with these same exclusions, and also exclude arson (heavily weighted by the 198 people killed by a suicidal arsonist in South Korea in 2003, and a single attack involving dynamite on a train in China in 1989), the same conclusion applies. Mechanical derailment is very lethal.
Looking more closely at bomb and mechanical derailments, several points need to be made. Mechanical derailments most typically involve removing tracks, sabotaging switches, or placing metal objects in the train’s path. Sixteen out of 53 mechanical sabotage attacks resulted in fatalities. Of the nine mechanical derailments that killed five or more persons, six took place in India, one in Pakistan, and one in Bangladesh. The three most lethal mechanical attacks took place in India. Indian train systems feature very crowded trains, which means that derailments are likely to cause heavy casualties, and sometimes it is not clear whether a mechanical derailment was a terrorist act or an accident. This may affect the high lethality seen in mechanical derailments.
11
III. HOW MANY DERAILMENT ATTEMPTS
ARE SUCCESSFUL?
This is a difficult question to answer with precision, but some estimates can be made. There are several approaches.
First, for bomb derailments it is possible to determine in how many cases a device or mechanical sabotage was detected beforehand, which is, of course, a failure if the intent is derailment rather than mere disruption. In 27 (or 10 percent) of the 282 attempts, a device was found or tampering with the tracks was discovered and the attack was prevented. In most cases, it is unclear who discovered the sabotage or found the explosive device, but in 18 (6.4%) of the attacks it is known who stopped the attack or found the bomb. These percentages are about the same as for attacks against all public surface transportation targets. For derailments, the action was taken by security officials or police in five attacks (1.8%), transit employees in five attacks (1.8%), members of the public in five attacks (1.8%), and drivers or crew in three attacks (1.1%).
We can also looked at the outcome of the bombs placed. Table 4 indicates that 279 devices were used in the 222 attacks involving bombs (often more than one device is used in a bomb attack). Of the 279 devices, 162 (58.1%) detonated at the right time and on target, while 116 (41.6%) failed to detonate, malfunctioned or detonated early, or were found and rendered safe. There is a difference, however, between detonating the bomb on target and on time, and a resulting derailment. The bomb may not have been placed properly, or the explosion was not powerful enough. Therefore it is incorrect to assume that in the 141 or exactly 50% of the attacks where at least one device detonated on time and on target, the train actually derailed.
It is more difficult to determine the success rate of mechanical sabotage. Some acts of mechanical sabotage may be disguised to appear as maintenance flaws or employee errors. The reverse is also true—saboteurs may falsely claim responsibility for accidents. It is also difficult to determine whether terrorists face greater challenges derailing trains with explosive devices or employing mechanical means of sabotage. Explosive devices require knowledge and experience to build. Bombmakers are a precious commodity in terrorist organizations. The placement and timing of the detonation have to be precise. Even large quantities of explosives may not suffice to derail a train. Mechanical means also require a degree of knowledge, which not all attackers possess. Inside knowledge is especially valuable.
Mineta T
ransportation
Institute
12
How Many Derailment
Attempts are Successful?
Table 4. Outcome of Devices
Device Outcome Devices Total % of Fatalities Average FPD1 Median FPD Average FPDE2 Injuries Average IPD3 Median IPD Average IPDE4
Detonated or Released on Target 162 58.1% 532.0 3.3 0.0 3.3 1,699.8 10.5 1.0 10.5 EOD5 Successful, Rendered Safe 58 20.8% 7.0 0.1 0.0 0.0 12.7 0.2 0.0 0.0
Detonated Early or Away from Target, or Malfunctioned 53 19.0% 5.0 0.1 0.0 0.0 9.0 0.2 0.0 0.0 Failed to Detonate or Release 5 1.8% 3.0 0.6 0.0 0.0 15.5 3.1 0.3 0.0
Unknown 1 0.4% 0.0 0.0 0.0 0.0 0.0 0.0 0.0 0.0
All Devices 279 100% 547 2.0 0.0 3.4 1,737 6.2 0.0 10.7
Notes:
1 FPD = Fatalities per device.
2 FPDE = Fatalities per device exploded. 3 IPD = Injuries per device.
4 IPDE = Injuries per device exploded. 5 EOD = Explosive ordinance disposal.
13 How Many Derailment Attempts are Successful?
We did review each derailment attempt and made a judgment as to whether the passenger train entirely, or at least in part, left the tracks—in other words, actually derailed (see Table 5). The findings are notable: the train derailed in 118 cases (41.8%), and in another 39 cases (13.8%) a bomb exploded but the train did not derail. By contrast, the derailment failed (usually because the timing was wrong or the device or mechanical sabotage simply did not work) in 92 cases (32.6%). In another 26 cases (9.2%), the derailment was prevented by employees, citizens, drivers or security officials or police who detected the attempt and stopped the train. The remaining seven cases (2.6%) involve instances where it was not clear whether a derailment occurred or not.
Looking further at the rate of successful derailments only when bombs or mechanical means were used, we find that in the 222 attempts involving bombs, 76 or 34.2 percent resulted in actual derailments. In the remaining 60 instances where mechanical derailments were attempted, 42 or 70 percent resulted in derailments, a much higher percentage, recognizing however as mentioned previously, some accidents are claimed as derailments, and some terrorist derailments are claimed as accidents.
Table 5. Outcome of Derailment Attempts
Outcome # of Attempts % of Total
Derailed 118 41.8%
Derail Failed 92 32.6%
Derail Failed but Bomb Exploded near Train 39 13.8%
Derail Prevented 26 9.2%
Derail Unclear but Bomb Exploded near Train 7 2.5%
All Outcomes 282 100.0%
TRENDS OVER TIME
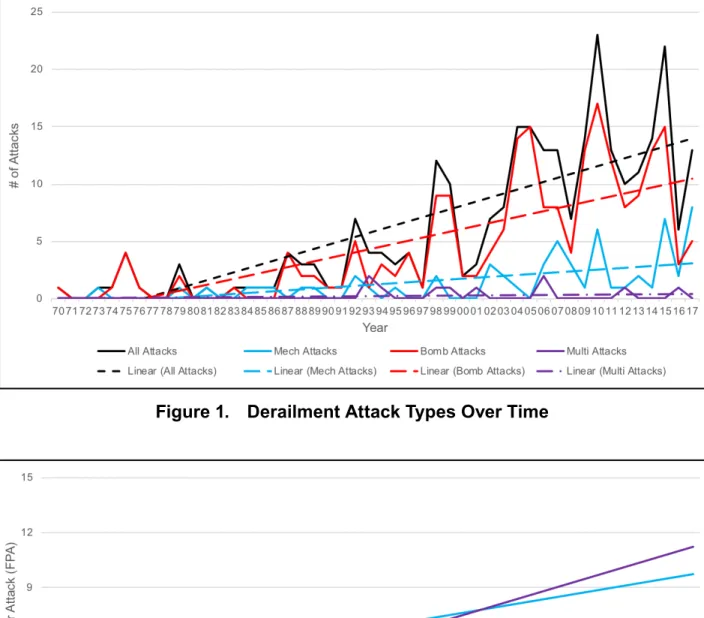
The 2010 study viewed time as flat—it did not explore trends over time. This new analysis does examine the derailment attempts over time to see what trends might be discernible. As Figure 1 shows, the rates of bomb-caused and mechanical (shortened in the graph to be “mech”) derailments have both increased over time, with bomb attacks showing the greater increase. Multiple weapon attacks (where a derailment is followed by an armed assault on the derailed train) have remained static and few in number.
Lethality, however, has increased only slightly (see Figure 2). The reason for a slight (rather than large) increase appears due mainly to the declining lethality of derailment attacks involving bombs, whereas the lethality of mechanical attacks appears to have increased significantly.
Mineta Transportation Institute
14 How Many Derailment Attempts are Successful?
Attacks on tracks have a very low FPA, which remains low. We caution, however, that it may be that the declining FPAs merely reflect better reporting or that more low-level attacks are taking place now than in the 1970s and 1980s.
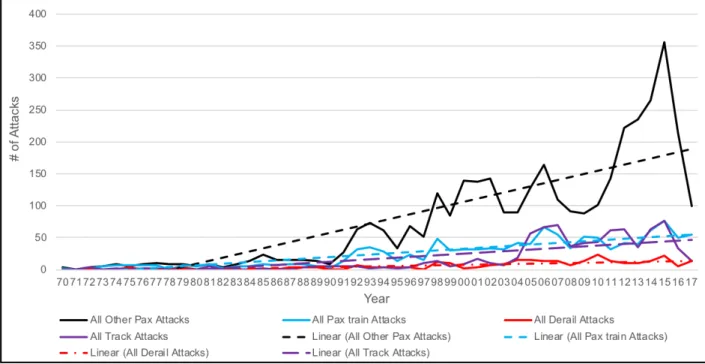
What this seems to be indicating is that while derailments are increasing, they are not increasing as fast as other groups of attacks. However, their lethality is increasing, albeit slightly, while the lethality of other attack methods is actually decreasing, a significant finding.
Figure 1. Derailment Attack Types Over Time
15 How Many Derailment Attempts are Successful?
Figure 3. Comparison of Different Attacks on All Passenger Public Surface Transport Targets Over Time
Figure 4. Comparison of Different Attack Lethality on All Passenger Public Surface Transport Targets Over Time
Mineta Transportation Institute
16
IV. TRACK ATTACKS—FREQUENT BUT NOT LETHAL
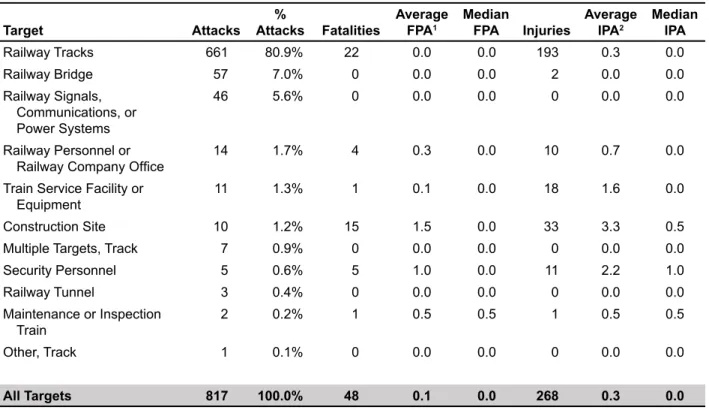
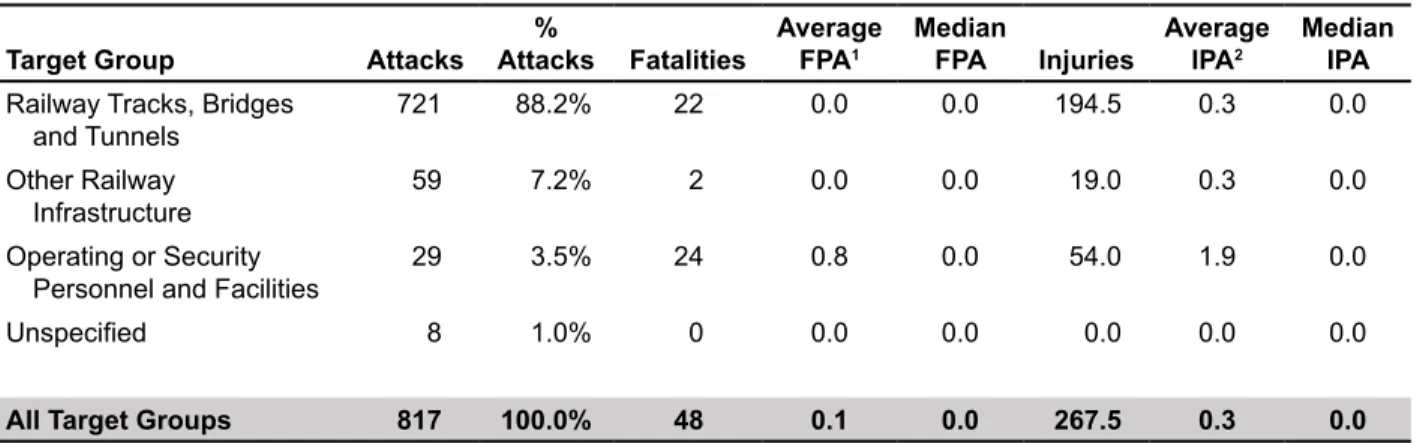
As already shown, the lethality of attacks on railway infrastructure is very low. These attacks are designed to disrupt, not to kill. Only 48 persons were killed and 268 injured in 817 attacks.
The targets that make up railway infrastructure are mostly railway tracks, bridges and tunnels, but they also include other targets, such as power, communications and signaling systems, service facilities and equipment, office buildings, construction sites, and others. Security personnel (typically guarding tracks) are also included in this category. Table 6 shows how attacks are spread amongst the various targets. It is no surprise that the highest lethality is achieved when offices or construction sites are attacked, followed by attacks on rail security personnel, sometimes with bombs or incendiaries, and also with automatic or semi-automatic weapons. Although these incidents are included in the category of railway infrastructure, it is clear that sometimes the targets are people, not things.
Table 6. Track Attacks by Target
Target Attacks Attacks Fatalities% Average FPA1 Median FPA Injuries Average IPA2 Median IPA
Railway Tracks 661 80.9% 22 0.0 0.0 193 0.3 0.0 Railway Bridge 57 7.0% 0 0.0 0.0 2 0.0 0.0 Railway Signals, Communications, or Power Systems 46 5.6% 0 0.0 0.0 0 0.0 0.0 Railway Personnel or
Railway Company Office 14 1.7% 4 0.3 0.0 10 0.7 0.0 Train Service Facility or
Equipment 11 1.3% 1 0.1 0.0 18 1.6 0.0
Construction Site 10 1.2% 15 1.5 0.0 33 3.3 0.5 Multiple Targets, Track 7 0.9% 0 0.0 0.0 0 0.0 0.0 Security Personnel 5 0.6% 5 1.0 0.0 11 2.2 1.0 Railway Tunnel 3 0.4% 0 0.0 0.0 0 0.0 0.0 Maintenance or Inspection Train 2 0.2% 1 0.5 0.5 1 0.5 0.5 Other, Track 1 0.1% 0 0.0 0.0 0 0.0 0.0 All Targets 817 100.0% 48 0.1 0.0 268 0.3 0.0 Notes:
1 FPA = Fatalities per attack. 2 IPA = Injuries per attack.
Looking at the same attacks, Table 7 shows them broken down into four groups. Of the 817 attacks, 721 (88.2%) are against railway tracks, bridges and tunnels; another 59 (7.2%) are against other rail infrastructure such as railway signals, communications or power systems; 29 (3.5%) are against operating and security personnel and their facilities, and eight (1.0%) were against unspecified track targets. With the exception of attacks against security or operating personnel (where the average fatality per attack is 0.8), the rest of the attacks killed only 22 people, suggesting that the intent of these attacks was mainly disruption.
17 Track Attacks—Frequent but Not Lethal
Table 7. Track Attacks by Target Group
Target Group Attacks Attacks Fatalities% Average FPA1 Median FPA Injuries Average IPA2 Median IPA
Railway Tracks, Bridges
and Tunnels 721 88.2% 22 0.0 0.0 194.5 0.3 0.0 Other Railway
Infrastructure 59 7.2% 2 0.0 0.0 19.0 0.3 0.0 Operating or Security
Personnel and Facilities 29 3.5% 24 0.8 0.0 54.0 1.9 0.0
Unspecified 8 1.0% 0 0.0 0.0 0.0 0.0 0.0
All Target Groups 817 100.0% 48 0.1 0.0 267.5 0.3 0.0
Notes:
1 FPA = Fatalities per attack. 2 IPA = Injuries per attack.
Looking at attack methods (see Table 8), attacks involving explosive devices (IEDs, mines, grenades, dynamite, and other devices) predominate, accounting for 702 incidents or 85.9 percent of the attacks, followed by mechanical sabotage and arson. Mechanical sabotage—removing bolts and tracks—accounts for a mere 1.8 percent of the total number of infrastructure attacks or just 2.0 percent of the 721 attacks on railway tracks, tunnels and bridges. This contrasts with mechanical sabotage, accounting for 18.8 percent of the derailment attacks. It suggests that some cases of mechanical sabotage may go unreported as such unless they lead to a derailment. (It should be noted that there were two instances of a train derailment included in track attacks. However, these were attacks on maintenance or inspection trains and therefore are not counted as passenger train derailments).
The mechanical cases involved zero casualties, which is not surprising since the only way they would cause casualties is if they led to a derailment. The highest lethality was achieved in attacks involving automatic and semi-automatic weapons, explosives (including VBIEDs – Vehicle-Borne Improvised Explosive Devices), and RPGs (Rocket-Propelled Grenades) deliberately directed at human targets—construction crews, company officials, and security personnel.
Table 8. Track Attacks by Weapon and Method of Attack
Attack and Weapon Attacks
% of Total
Attacks Fatalities Average FPA Median FPA Injuries Average IPA Median IPA
IED, Unspecified 669 81.9% 28 0.0 0.0 218 0.3 0.0 Sabotage, Other 41 5.0% 0 0.0 0.0 0 0.0 0.0
Arson 22 2.7% 0 0.0 0.0 0 0.0 0.0
IID (Improvised Incendiary
Mineta Transportation Institute
18 Track Attacks—Frequent but Not Lethal
Attack and Weapon Attacks
% of Total
Attacks Fatalities Average FPA Median FPA Injuries Average IPA Median IPA
Assault, Automatic or Semi-Automatic Weapons
5 0.6% 16 3.2 1.0 17 3.4 1.0
IED, Hoax Device 4 0.5% 0 0.0 0.0 0 0.0 0.0 Assault, Unspecified or
Other 3 0.4% 0 0.0 0.0 5 1.7 0.0
Kidnapping 3 0.4% 0 0.0 0.0 0 0.0 0.0
Multiple Weapons, IED/IID
& Other 3 0.4% 0 0.0 0.0 0 0.0 0.0
Unknown 3 0.4% 0 0.0 0.0 0 0.0 0.0
Derailment, Track
Bomb-IED, Unspecified 2 0.2% 1 0.5 0.5 1 0.5 0.5
IED, Other 2 0.2% 0 0.0 0.0 0 0.0 0.0
Multiple Weapons, IED/IID & Automatic or Semi-Automatic Weapons 2 0.2% 0 0.0 0.0 0 0.0 0.0 Armed Robbery 1 0.1% 0 0.0 0.0 0 0.0 0.0 Assault, RPG 1 0.1% 0 0.0 0.0 2 2.0 2.0 Assault, Stabbings 1 0.1% 0 0.0 0.0 14 14.0 14.0 IED, Bicycle-Borne 1 0.1% 3 3.0 3.0 6 6.0 6.0 Mortar 1 0.1% 0 0.0 0.0 0 0.0 0.0 VBIED3 1 0.1% 0 0.0 0.0 0 0.0 0.0
All Attacks and Weapons 817 100.0% 48 0.1 0.0 268 0.3 0.0
Notes:
1 FPA = Fatalities per attack. 2 IPA = Injuries per attack.
3 VBIED = Vehicle-Borne Improvised Explosive Device.
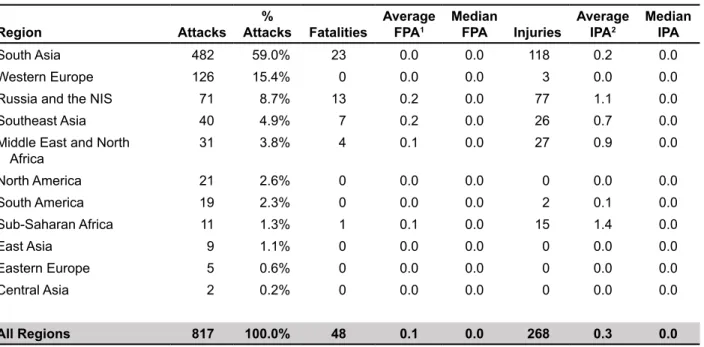
There seems to be some correlation between where derailment attacks take place and where track attacks take place, as can be seen in Table 9 for regions, followed by Table 10 for countries. Again, Western Europe comes in second in terms of the volume of track attacks, but there are no fatalities and only a few injuries associated with these. The volume of attacks owes mainly to the terrorist campaigns of the Irish Republican Army (IRA) in the United Kingdom and the Basque separatists in Spain.4 Both campaigns against rail
targets were largely disruptive rather than intended to cause heavy casualties. There is no meaningful difference in lethality between regions, which is low overall.
19 Track Attacks—Frequent but Not Lethal
Table 9. Track Attacks by Region
Region Attacks Attacks Fatalities% Average FPA1 Median FPA Injuries Average IPA2 Median IPA
South Asia 482 59.0% 23 0.0 0.0 118 0.2 0.0 Western Europe 126 15.4% 0 0.0 0.0 3 0.0 0.0 Russia and the NIS 71 8.7% 13 0.2 0.0 77 1.1 0.0 Southeast Asia 40 4.9% 7 0.2 0.0 26 0.7 0.0 Middle East and North
Africa 31 3.8% 4 0.1 0.0 27 0.9 0.0 North America 21 2.6% 0 0.0 0.0 0 0.0 0.0 South America 19 2.3% 0 0.0 0.0 2 0.1 0.0 Sub-Saharan Africa 11 1.3% 1 0.1 0.0 15 1.4 0.0 East Asia 9 1.1% 0 0.0 0.0 0 0.0 0.0 Eastern Europe 5 0.6% 0 0.0 0.0 0 0.0 0.0 Central Asia 2 0.2% 0 0.0 0.0 0 0.0 0.0 All Regions 817 100.0% 48 0.1 0.0 268 0.3 0.0 Notes:
1 FPA = Fatalities per attack. 2 IPA = Injuries per attack.
As seen in Table 10, Pakistan and India trade first and second place in terms of their overall share of total attacks, but together account for 57.6 percent of the railway infrastructure attacks as opposed to 52.5 percent of the derailment attacks. The United Kingdom replaces Russia for third place.
Table 10. Track Attacks by Country
Country Attacks Attacks Fatalities% Average FPA Median FPA Injuries Average IPA Median IPA
Pakistan 262 32.1% 6 0.0 0.0 63 0.2 0.0 India 208 25.5% 17 0.1 0.0 55 0.3 0.0 United Kingdom 41 5.0% 0 0.0 0.0 0 0.0 0.0 Russian Federation 37 4.5% 13 0.4 0.0 77 2.1 0.0 Thailand 34 4.2% 7 0.2 0.0 25 0.7 0.0 Italy 29 3.5% 0 0.0 0.0 3 0.1 0.0 Ukraine 28 3.4% 0 0.0 0.0 0 0.0 0.0 Spain 26 3.2% 0 0.0 0.0 0 0.0 0.0 Germany 19 2.3% 0 0.0 0.0 0 0.0 0.0 United States 19 2.3% 0 0.0 0.0 0 0.0 0.0 Egypt 13 1.6% 1 0.1 0.0 7 0.5 0.0 Colombia 12 1.5% 0 0.0 0.0 0 0.0 0.0 Japan 9 1.1% 0 0.0 0.0 0 0.0 0.0
Mineta Transportation Institute
20 Track Attacks—Frequent but Not Lethal
Country Attacks Attacks Fatalities% Average FPA Median FPA Injuries Average IPA Median IPA
Georgia 5 0.6% 0 0.0 0.0 0 0.0 0.0 Bangladesh 4 0.5% 0 0.0 0.0 0 0.0 0.0 France 4 0.5% 0 0.0 0.0 0 0.0 0.0 Iraq 3 0.4% 1 0.3 0.0 0 0.0 0.0 Ireland 3 0.4% 0 0.0 0.0 0 0.0 0.0 Kosovo 3 0.4% 0 0.0 0.0 0 0.0 0.0 Syria 3 0.4% 0 0.0 0.0 0 0.0 0.0 Argentina 2 0.2% 0 0.0 0.0 0 0.0 0.0 Cambodia 2 0.2% 0 0.0 0.0 0 0.0 0.0 Chile 2 0.2% 0 0.0 0.0 1 0.5 0.5 Czech Republic 2 0.2% 0 0.0 0.0 0 0.0 0.0 Ethiopia 2 0.2% 0 0.0 0.0 0 0.0 0.0 Myanmar 2 0.2% 0 0.0 0.0 0 0.0 0.0 Nepal 2 0.2% 0 0.0 0.0 0 0.0 0.0 Peru 2 0.2% 0 0.0 0.0 1 0.5 0.5 Austria 1 0.1% 0 0.0 0.0 0 0.0 0.0 Belgium 1 0.1% 0 0.0 0.0 0 0.0 0.0 Brazil 1 0.1% 0 0.0 0.0 0 0.0 0.0 Canada 1 0.1% 0 0.0 0.0 0 0.0 0.0 Greece 1 0.1% 0 0.0 0.0 0 0.0 0.0 Indonesia 1 0.1% 0 0.0 0.0 0 0.0 0.0 Israel 1 0.1% 0 0.0 0.0 0 0.0 0.0 Kenya 1 0.1% 0 0.0 0.0 14 14.0 14.0 Lithuania 1 0.1% 0 0.0 0.0 0 0.0 0.0 Mexico 1 0.1% 0 0.0 0.0 0 0.0 0.0 Philippines 1 0.1% 0 0.0 0.0 1 1.0 1.0 Switzerland 1 0.1% 0 0.0 0.0 0 0.0 0.0 Tajikistan 1 0.1% 0 0.0 0.0 0 0.0 0.0 Uzbekistan 1 0.1% 0 0.0 0.0 0 0.0 0.0 Zambia 1 0.1% 0 0.0 0.0 0 0.0 0.0 Zimbabwe 1 0.1% 0 0.0 0.0 0 0.0 0.0 All Countries 817 100.0% 48 0.1 0.0 268 0.3 0.0 Notes:
1 FPA = Fatalities per attack. 2 IPA = Injuries per attack.
Mineta T
ransportation
Institute
Track
Attacks—Frequent but Not Lethal
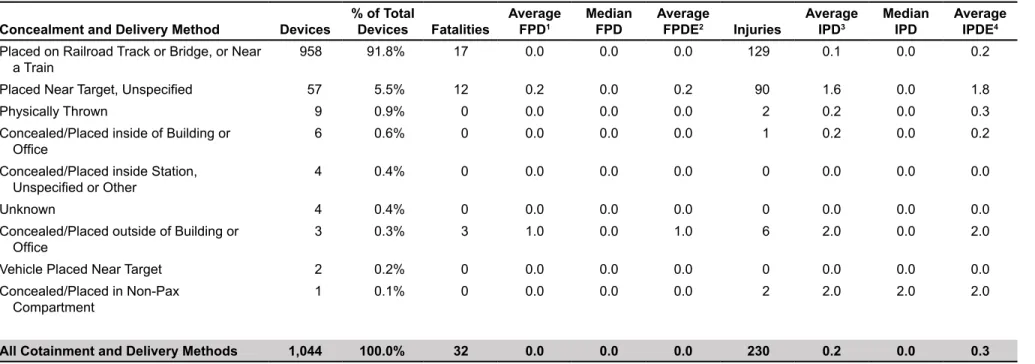
Table 11 shows the delivery and concealment method for explosive or incendiary devices, with 91.8 percent of the devices placed on railroad tracks, a bridge or a tunnel.
Table 11. Track Attacks by Bomb Delivery Method
Concealment and Delivery Method Devices % of Total Devices Fatalities Average FPD1 Median FPD Average FPDE2 Injuries Average IPD3 Median IPD Average IPDE4
Placed on Railroad Track or Bridge, or Near
a Train 958 91.8% 17 0.0 0.0 0.0 129 0.1 0.0 0.2
Placed Near Target, Unspecified 57 5.5% 12 0.2 0.0 0.2 90 1.6 0.0 1.8
Physically Thrown 9 0.9% 0 0.0 0.0 0.0 2 0.2 0.0 0.3
Concealed/Placed inside of Building or
Office 6 0.6% 0 0.0 0.0 0.0 1 0.2 0.0 0.2
Concealed/Placed inside Station,
Unspecified or Other 4 0.4% 0 0.0 0.0 0.0 0 0.0 0.0 0.0
Unknown 4 0.4% 0 0.0 0.0 0.0 0 0.0 0.0 0.0
Concealed/Placed outside of Building or
Office 3 0.3% 3 1.0 0.0 1.0 6 2.0 0.0 2.0
Vehicle Placed Near Target 2 0.2% 0 0.0 0.0 0.0 0 0.0 0.0 0.0
Concealed/Placed in Non-Pax
Compartment 1 0.1% 0 0.0 0.0 0.0 2 2.0 2.0 2.0
All Cotainment and Delivery Methods 1,044 100.0% 32 0.0 0.0 0.0 230 0.2 0.0 0.3
Notes:
1 FPD = Fatalities per device.
2 FPDE = Fatalities per device exploded. 3 IPD = Injuries per device.
Mineta T
ransportation
Institute
22
Track
Attacks—Frequent but Not Lethal
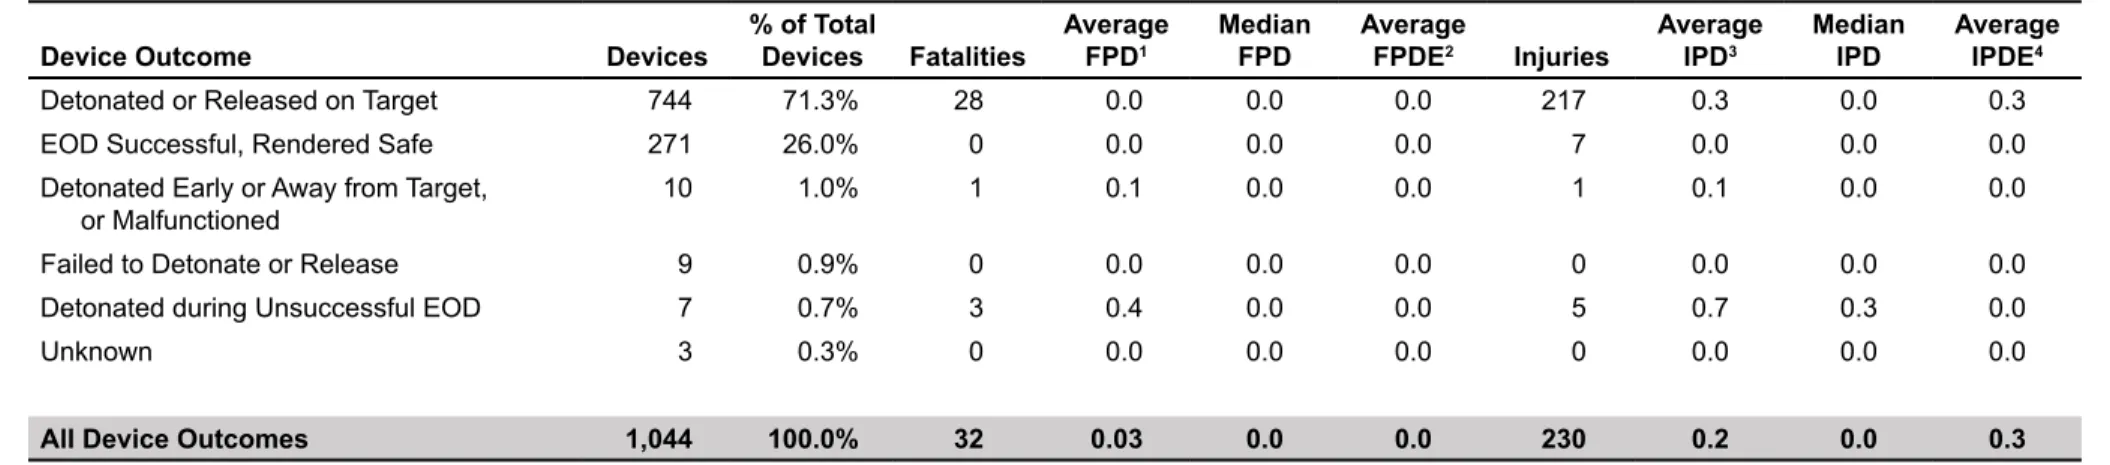
How successful were the saboteurs? As Table 12 indicates, 71.3 percent of their devices detonated on target. Another 1.9 percent failed to detonate, were improperly placed, or malfunctioned. Interestingly, 26.0 percent of the devices were found and rendered safe while another 0.7 percent were detonated during unsuccessful attempts to disarm them. This means that 26.7 percent of the devices were discovered before they were supposed to explode. This is a remarkable number and merits closer examination.
Table 12. Track Attacks by Bomb Outcome
Device Outcome Devices % of Total Devices Fatalities Average FPD1 Median FPD Average FPDE2 Injuries Average IPD3 Median IPD Average IPDE4
Detonated or Released on Target 744 71.3% 28 0.0 0.0 0.0 217 0.3 0.0 0.3 EOD Successful, Rendered Safe 271 26.0% 0 0.0 0.0 0.0 7 0.0 0.0 0.0 Detonated Early or Away from Target,
or Malfunctioned 10 1.0% 1 0.1 0.0 0.0 1 0.1 0.0 0.0
Failed to Detonate or Release 9 0.9% 0 0.0 0.0 0.0 0 0.0 0.0 0.0
Detonated during Unsuccessful EOD 7 0.7% 3 0.4 0.0 0.0 5 0.7 0.3 0.0
Unknown 3 0.3% 0 0.0 0.0 0.0 0 0.0 0.0 0.0
All Device Outcomes 1,044 100.0% 32 0.03 0.0 0.0 230 0.2 0.0 0.3
Notes:
1 FPD = Fatalities per device.
2 FPDE = Fatalities per device exploded. 3 IPD = Injuries per device.
Mineta T
ransportation
Institute
Track
Attacks—Frequent but Not Lethal
Another way of looking at devices is to see how many were found before they detonated. As Table 13 indicates, the attackers provided warnings to the authorities in only 0.4 percent of the total number of devices cases, while intelligence efforts led to just another 0.1 percent of the devices being located and rendered safe (although we only know of cases in which intelligence are reported to be involved—there may be more). Police, military personnel, other security officials, drivers, crew, and other employees, passengers and ordinary citizens were responsible for finding 96 (or 9.2 percent) of the devices. The circumstances are unknown in 13.5 percent of the cases. Looking at only devices detected before an attack took place, 238 or 23% of the total were detected, which is about 7 percent higher than the average for all public surface transportation targets combined (15.6%) and about eight percent higher than for all attacks against all passenger targets (14.4%).
Table 13. Track Bombs Detected Before Attacks
Devices Detected Before Attacks Devices % of Total Devices Fatalities Average FPD1 Median FPD Average FPDE2 Injuries Average IPD3 Median IPD Average IPDE4
Not Detected 715 68.5% 31 0.0 0.0 0.0 214 0.3 0.0 0.3
Unknown 141 13.5% 1 0.0 0.0 0.3 3 0.0 0.0 0.8
EOD after Some Devices Detonated in Attack 86 8.2% 0 0.0 0.0 0.0 9 0.1 0.0 0.2
Police 31 3.0% 0 0.0 0.0 0.0 0 0.0 0.0 0.0
Security Officials 26 2.5% 0 0.0 0.0 0.0 2 0.1 0.0 1.0
Transit Employees 14 1.3% 0 0.0 0.0 0.0 0 0.0 0.0 0.0
Citizens 13 1.2% 0 0.0 0.0 0.0 2 0.2 0.0 0.0
Attacker Warning to Authorities 4 0.4% 0 0.0 0.0 0.0 0 0.0 0.0 0.0
Driver or Crew 4 0.4% 0 0.0 0.0 0.0 0 0.0 0.0 0.0
Military 4 0.4% 0 0.0 0.0 0.0 0 0.0 0.0 0.0
Passengers 3 0.3% 0 0.0 0.0 0.0 0 0.0 0.0 0.0
Combination 1 0.1% 0 0.0 0.0 0.0 0 0.0 0.0 0.0
EOD after No Device Detonated in Attack 1 0.1% 0 0.0 0.0 0.0 0 0.0 0.0 0.0
Intelligence 1 0.1% 0 0.0 0.0 0.0 0 0.0 0.0 0.0
All Devices Detected Before Attacks 1,044 100.0% 32 0.0 0.0 0.0 230 0.2 0.0 0.3
Mineta Transportation Institute
24
V. ANALYSIS OF FOUR DIFFERENT GROUPS USING
DERAILMENT AND TRACK ATTACKS
Treating all attacks as a single universe can be misleading. It portrays all of the perpetrators as a single generic adversary. The MTI database confirms that diverse individuals and groups have carried out track attacks and attempted to derail trains, including the Irish Republican Army in the United Kingdom, neofascists in Italy, Marxist guerrillas in Colombia, anarchists, environmental extremists, extortionists, and mentally disturbed individuals in Europe and elsewhere. Many attacks are one-offs. Others are part of long-running campaigns of sabotage. This section examines the derailment and track attacks by four sets of adversaries who have such campaigns, some long-running: first, the least lethal group -- an assemblage of European anarchists and environmental extremists; next, Maoist, sometimes referred to Naxalite, guerrillas in India; third, Islamic separatists in southern Thailand; finally, operatives motivated by jihadist ideology—by far the most lethal group. These groups illustrate significant differences in motives, objectives, and modes of operating. This shows up vividly in a comparison of both the frequency and the lethality of their attacks, which will be shown in Tables 14 and 15.
First, however, some caveats are in order. Together, the attacks carried out by the four groupings reviewed here comprise 57 (24%) of the 282 attempted derailments, and 209 (26%) of the 817 attacks against rail infrastructure recorded in the MTI database between 1970 and the end of 2017. While the Internet has improved access to information about incidents that occur, no claim can be made that all attacks are captured. This is truer of derailments and rail infrastructure attacks conducted using mechanical sabotage, rather than those that involve bombings, which may be more widely covered in the media. It is especially true if there were few if any fatalities, particularly in developing countries. In some developing countries there may be an effort to minimize the particular terrorist threats, leading some governments, such as India, to downplay public reporting of the actual number of incidents. At the same time, there are also reports that in these same countries, railroad officials may blame saboteurs for derailments or track problems that were due to poor maintenance.
The MTI database deliberately excludes incidents that occur in war zones during active military hostilities. We monitor these conflicts, but exclude them from the statistical analysis. This decision reflects a concern that the high volumes of all forms of violence connected with the war would distort the data and lead to conclusions that would not be relevant to transportation operators or authorities charged with security in the rest of the world. Obviously, judgments may vary as to what counts as a war zone. We exclude events in Afghanistan, but not in Pakistan. Finally, we require a high level of confidence in attributing attacks to specific adversaries—there is either a credible claim or enough evidence to reasonably surmise that a specific group was responsible. That means some incidents, which may be the work of the four groups examined here, are omitted.
As a result of these limitations, the numbers presented below should be seen as illustrative of the activity rather than representing the entire universe of actions.