Theses and Dissertations Theses, Dissertations, and Senior Projects
1-1-2018
Electroencephalogram Signal Processing For
Hybrid Brain Computer Interface Systems
Md. Ali Haider
Follow this and additional works at:https://commons.und.edu/theses
This Dissertation is brought to you for free and open access by the Theses, Dissertations, and Senior Projects at UND Scholarly Commons. It has been accepted for inclusion in Theses and Dissertations by an authorized administrator of UND Scholarly Commons. For more information, please contact
Recommended Citation
Haider, Md. Ali, "Electroencephalogram Signal Processing For Hybrid Brain Computer Interface Systems" (2018).Theses and Dissertations. 2225.
PROCESSING FOR HYBRID BRAIN
COMPUTER INTERFACE SYSTEMS
by Md. Ali Haider
Bachelor of Science, Bangladesh University of Engineering & Technology Master of Science, South Dakota State University
A Dissertation
Submitted to the Graduate Faculty of the
University of North Dakota in partial fulfillment of the requirements
for the degree of Doctor of Philosophy Electrical Engineering
Grand Forks, North Dakota May
Title Electroencephalogram Signal Processing for Hybrid Brain Computer Interface Systems
Department Electrical Engineering
Degree Doctor of Philosophy
In presenting this dissertation in partial fulfillment of the requirements for a graduate degree from the University of North Dakota, I agree that the library of this University shall make it freely available for inspection. I further agree that permission for extensive copying for scholarly purposes may be granted by the professor who supervised my dissertation work or, in his absence, by the Chairperson of the department or the dean of the Graduate School. It is understood that any copying or publication or other use of this dissertation or part thereof for financial gain shall not be allowed without my written permission. It is also understood that due recognition shall be given to me and to the University of North Dakota in any scholarly use which may be made of any material in my dissertation.
Md. Ali Haider April 20, 2018
LIST OF FIGURES ... IX
LIST OF TABLES ... XII
ACKNOWLEDGMENTS ... XIII
ABSTRACT ... XVI
1 CHAPTER I: INTRODUCTION AND BACKGROUND ... 1
1.1 Introduction ... 1
1.2 Research Objectives of This Study ... 2
1.3 EEG Signal ... 4
1.3.1 EEG Measurement ... 7
1.3.2 Applications of EEG Signal ... 8
1.4 Signal Acquisition ... 8
1.4.1 Wired EEG Systems ... 11
1.4.2 Wireless EEG systems ... 12
1.5 Brain-Computer Interfaces (BCI): Definition and Categories ... 12
1.5.1 BCI Systems and Modalities ... 13
1.5.2 Dependent and Independent BCI ... 14
1.5.3 Invasive and Non-invasive BCI ... 14
1.5.4 Synchronous and Asynchronous (self-paced) BCI ... 17
1.5.5 Active, Reactive and Passive BCI ... 18
1.6.2 Power Spectral Density (PSD) ... 25
1.6.3 Canonical Correlation Analysis (CCA)... 26
1.6.4 Independent Component Analysis (ICA) ... 26
1.6.5 Minimum Energy (ME) Method ... 29
1.6.6 Principal Component Analysis (PCA) ... 31
1.7 Classifiers Used in EEG Based BCI Systems ... 31
1.7.1 Support Vector Machine (SVM) ... 32
1.7.2 Linear Discriminant Analysis (LDA) ... 35
1.7.3 Neural Networks ... 37
1.8 EEG Detectable Neurophysiological Potentials ... 38
1.8.1 Event-related Potentials (ERPs): P300 Potentials ... 38
1.8.2 Visual-Evoked Potentials (VEPs) ... 40
1.8.3 Potentials in Spontaneous Signals ... 42
1.9 BCI Applications ... 43
1.10 Experimental Resources ... 43
1.11 Stimuli Presentation Devices ... 46
1.12 Stimulation Presentation Techniques ... 47
1.12.1 Visuospatial Presentation ... 47
1.12.2 Auditory Presentation ... 51
1.12.3 Tactile Presentation ... 52
1.13 Data Acquisition and Artifact Removal ... 53
2 CHAPTER II: P300-BASED BCI, MATERIALS AND METHODS ... 56
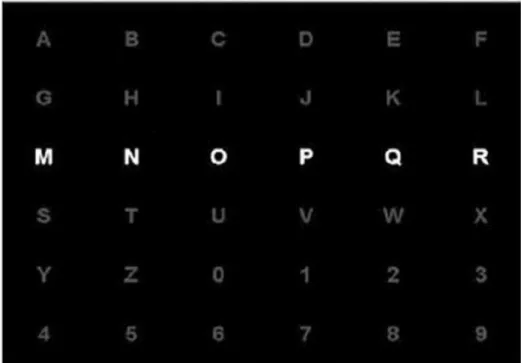
2.1 Standard P300 Speller ... 56
2.1.1 Region Based P300 Paradigm ... 58
2.1.2 Classification Architecture ... 60
2.2 Experimental Setup ... 60
2.2.1 Software Framework ... 63
2.3 Pre-processing and Feature Extraction ... 63
2.4 Performance Metrics ... 66
2.5 Result and Analysis ... 66
2.6 Conclusion ... 68
3 CHAPTER III: SSVEP-BASED BCI, MATERIALS AND METHODS ... 70
3.1 Standard SSVEP Speller ... 70
3.1.1 Region Based SSVEP Paradigm ... 70
3.1.2 SSVEP Detection Method ... 74
3.2 Experimental Setup ... 75
3.2.1 Software Framework ... 75
3.3 Pre-processing and Feature Extraction ... 76
3.4 Performance Metrics ... 77
3.5 Classification Methods ... 77
3.5.1 Minimum Energy Method ... 80
3.5.2 Result and Analysis ... 84
4 CHAPTER IV: HYBRID BCI, MATERIALS AND METHODS ... 89
4.1 Architectural review of Hybrid BCI ... 89
4.2 Paradigm Design ... 90
4.3 Classification Methods ... 93
4.4 Performance Evaluation ... 94
4.5 Results and Comparative Analysis ... 95
4.6 Conclusion ... 100
5 CHAPTER V: DISCUSSION ... 101
5.1 Contribution of This Work ... 101
5.2 Future Work ... 102
APPENDIX A ... 106
BIOMEDICAL RESEARCH INFORMED CONSENT FORM ... 106
INFORMED CONSENT ... 106
APPENDIX B ... 112
BCI QUESTIONNAIRES ... 112
QUESTIONS BEFORE A BCI TEST ... 112
TO BE COMPLETED AFTER BCI TEST ... 113
APPENDIX C ... 114
USERS FEEDBACK ... 114
Figure 1.1: Inner parts of human brain and its tasks [6]. ... 6
Figure 1.2: Electrode distribution in 10/20 international system (adapted from [16]). ... 9
Figure 1.3: EEG data acquisition using a hand-free BCI speller paradigm. ... 11
Figure 1.4: BCI types depending on the sensor placement [21]. ... 15
Figure 1.5: Sample EEG data recorded using a single electrode. ... 17
Figure 1.6: Pictorial illustration of SVM. SVM finds the optimal hyperplane (solid line) to separate two classes by maximizing the margin γ. It is defined by the vector w and the bias term b. Only support vectors (bordered circle) are necessary to calculate w and b. ... 34
Figure 1.7: SSVEP amplitude with different flickering frequency (adapted from [50]). . 42
Figure 1.8: EEG electrodes position for this research work. ... 45
Figure 1.9: g.tec equipment utilized for EEG data acquisition. ... 46
Figure 1.10: Flash Stimulus; a) LED stimulator, b) Computer Monitor. ... 49
Figure 1.11: Two sequential and colorful LCD frames containing targets either in a new state or a quasi-state. ... 49
Figure 1.12: BCI paradigm as a matrix presentation. ... 50
Figure 1.13: Region based paradigm with two levels. ... 51
Figure 1.14: Different stages of data acquisition and signal processing of a BCI system.. ... 53
Figure 2.1: The P300 speller interface is displayed as 6 by 6 row–column paradigm
(RCP) on the user’s screen. ... 57
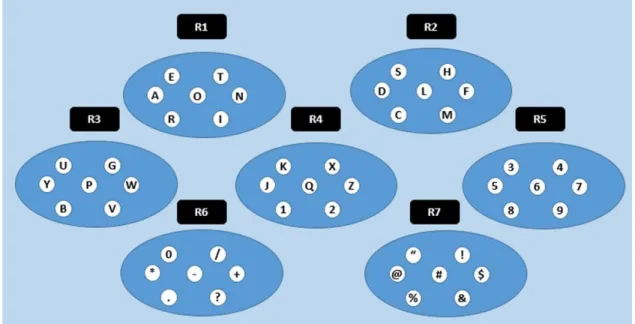
Figure 2.2: Basic architecture of a region-based paradigm with the locations of seven regions. Here, “Rn” represents region ‘n’ and each region contains seven characters. ... 60
Figure 2.3: LCD monitor display of P300 region-based paradigm at Level 1. ... 62
Figure 2.4: Real-time SIMULINK model for P300 experiment with the ‘g.USBamp’ amplifier, filter, signal processing and paradigm blocks. ... 62
Figure 2.5: EEG signal with P300 evoked potential generated by a flickering target. ... 65
Figure 2.6: EEG signal with no P300 evoked potential when non-target flickers. ... 65
Figure 3.1: First level of SSVEP region-based paradigm when the target is 5th region. .. 71
Figure 3.2: Frequencies are given in Hz for each of the seven regions. ... 72
Figure 3.3: Signal acquired using photodiode from a flickering object. ... 73
Figure 3.4: Highest peak appeared at 14 Hz after FFT analysis of the signal shown in Figure 3.3. ... 73
Figure 3.5: System architecture of the real-time and offline operation. ... 76
Figure 3.6: Simulink model with minimum energy combination algorithm. ... 80
Figure 3.7: Window to adjust minimum energy block parameters. ... 81
Figure 3.8: Frequency spectrum of EEG signal when the target is 10 Hz. ... 82
Figure 3.9: Real-time SIMULINK model for SSVEP BCI. ... 83
Figure 3.10: Pulse train to synchronize the stimulation with the EEG data acquisition. .. 85
Figure 4.1: Hybrid BCI architectures, a) simultaneous and b) sequential mode of operation. ... 89
Figure 4.3: Monitor frame at a single moment when both P300 and SSVEP stimulations are produced. ... 92 Figure 4.4: A single region with the characters (annotated from 1 to 7) stimulating P300.
These characters are located outside a white circle flickering at a single frequency. ... .93 Figure 4.5: SIMULINK model for the hybrid feature extraction, classification and
LIST OF TABLES
Table Page
Table 1.1 Basic brain waves and their characteristics ... 7
Table 1.2: Important measurement parameters of EEG signal ... 23
Table 1.3: Specifications of paradigm components ... 45
Table 2.1: Target characters with corresponding region indices ... 63
Table 2.2: Test results from P300 stimulation, pilot study with the word ‘WATER’ ... 67
Table 2.3: Test results from P300 stimulation, pilot study with the word ‘LUCAS’ ... 67
Table 2.4: Test results from P300 stimulation with the character set ‘ASB26/$’ ... 68
Table 3.1: SSVEP signal processing methods ... 77
Table 3.2: Degrading performance of MEC ... 82
Table 3.3: Specifications of SSVEP SIMULINK model ... 83
Table 3.4: Test results from SSVEP stimulation, pilot study with ‘FLASH’ ... 85
Table 3.5: Test results from SSVEP stimulation, pilot study with ‘WATER’ ... 86
Table 3.6: Test results from SSVEP stimulation with the character set ‘ASB26/$’ ... 87
Table 4.1: Flickering frequency of 7 regions ... 94
Table 4.2: Test results from the Hybrid speller (acronym: subj.=subject, L1=Level 1, L2=Level 2, T1=Trial 1, T2=Trial 2, Acc.=accuracy in percentage) ... 96
Table 4.3: Test results from Hybrid stimulation with the character set ‘ASB26/$’ ... 98
Table 4.4: Performance comparison of three BCI systems... 99
ACKNOWLEDGMENTS
First of all, I wish to convey my heartiest thanks to my Ph.D. advisor Dr. Reza Fazel-Rezai, director and head of the Biomedical Image and Signal Processing (BISP) Laboratory, for his encouragement and scientific discussions about BCI and human brain. Moreover, it’s my honor to state that I am heavily assisted by Dr. Reza numerous times in need. Dr. Reza is a very supportive, friendly and amiable personality. He was very considerable in many occasions when my actions needed some adjustments and guided me through to generate pragmatic results. His suggestions and advice are beneficial to anybody who like to work with him.
I would also like to express my sincere appreciation to the members of my advisory committee for their guidance, support, time and commitment during my stay at the University of North Dakota. Also, I would like to express my thanks to Dr. Sima Noghanian for suggesting about future directions the BCI research can follow. She paid time and thought to give me some light on future possibilities in BCI research. I took her course which was very helpful, too. I can’t stop saying about Dr. Kurt Zhang who is a very good statistician and always motivating. Dr. Zhang shared valuable advice on statistical analysis about the BCI results. Usually, addition of such analysis increases the acceptability of the research result. Again, I would always feel excited to talk with Dr. Kathy Smart. Dr. Kathy liked to get the update of my work and she enjoyed any progress I made toward the BCI system developments.
The discussions I had with my advisory committee had helped me in advancing my knowledge and significantly enriched my education. With a similar note, I would like to express my appreciation to North Dakota Experimental Program to Stimulate Competitive Research (ND EPSCoR) and the University of North Dakota Graduate School for the financial assistance during my research and travel to conferences. I would like to thank every BCI subject for taking their time to help me with the experiments over the years. I am also grateful to my lab mates as they were almost always ready to talk about any and every matter came on the way of my stay at Electrical Engineering department. Finally, I appreciate the efforts of the Electrical Engineering department toward maintaining a very warm and welcoming environment for nurturing research and educational upbringing.
To my Mother, for her unconditional love, care & affection.
ABSTRACT
The goal of this research was to evaluate and compare three types of brain computer interface (BCI) systems, P300, steady state visually evoked potentials (SSVEP) and Hybrid as virtual spelling paradigms. Hybrid BCI is an innovative approach to combine the P300 and SSVEP. However, it is challenging to process the resulting hybrid signals to extract both information simultaneously and effectively. The major step executed toward the advancement to modern BCI system was to move the BCI techniques from traditional LED system to electronic LCD monitor. Such a transition allows not only to develop the graphics of interest but also to generate objects flickering at different frequencies. There were pilot experiments performed for designing and tuning the parameters of the spelling paradigms including peak detection for different range of frequencies of SSVEP BCI, placement of objects on LCD monitor, design of the spelling keyboard, and window time for the SSVEP peak detection processing. All the experiments were devised to evaluate the performance in terms of the spelling accuracy, region error, and adjacency error among all of the paradigms: P300, SSVEP and Hybrid. Due to the different nature of P300 and SSVEP, designing a hybrid P300-SSVEP signal processing scheme demands significant amount of research work in this area. Eventually, two critical questions in hybrid BCl are: (1) which signal processing strategy can best measure the user's intent and (2) what a suitable paradigm is to fuse these two techniques in a simple but effective way. In order to answer these questions, this project focused mainly on developing signal processing and
classification technique for hybrid BCI. Hybrid BCI was implemented by extracting the specific information from brain signals, selecting optimum features which contain maximum discrimination information about the speller characters of our interest and by efficiently classifying the hybrid signals. The designed spellers were developed with the aim to improve quality of life of patients with disability by utilizing visually controlled BCI paradigms. The paradigms consist of electrodes to record electroencephalogram signal (EEG) during stimulation, a software to analyze the collected data, and a computing device where the subject’s EEG is the input to estimate the spelled character. Signal processing phase included preliminary tasks as preprocessing, feature extraction, and feature selection. Captured EEG data are usually a superposition of the signals of interest with other unwanted signals from muscles, and from non-biological artifacts. The accuracy of each trial and average accuracy for subjects were computed. Overall, the average accuracy of the P300 and SSVEP spelling paradigm was about 84% and 68.5 %. P300 spelling paradigms have better accuracy than both the SSVEP and hybrid paradigm. Hybrid paradigm has the average accuracy of 79 %. However, hybrid system is faster in time and more soothing to look than other paradigms. This work is significant because it has great potential for improving the BCI research in design and application of clinically suitable speller paradigm.
1
CHAPTER I: INTRODUCTION AND BACKGROUND
1.1 Introduction
In every society, people with disabilities need to communicate with others. However, their economic and educational status are predominantly limited by the unavailability of tools and technologies to satisfy their special needs. There is a necessity for technological solutions to constantly increase to overcome their difficulties with everyday activities. A hands-free speller is such a tool which can help motion impaired people to express their opinions and ideas, and communicate with others[1].
In fact, the evolution of brain technology has offered limitless opportunities and possibilities for impaired as well as healthy members to contribute and participate in the society. Brain Computer Interface (BCI) systems enable the human brain to communicate with an external device bypassing the explicit pathways formed by a natural nervous system [2]. With the help of human brain signals or an electroencephalogram (EEG), brain activity in the neocortex is measured as voltage differences over the scalp. Information on subjects’ intentions and thoughts is encompassed by EEG electrical patterns, which is decoded as important signatures of brain activity. The status quo BCI technology and associated signal processing schemes are advancing fast with an exciting promise to conquer disabilities through neuroprosthetics and rehabilitation. It will also improve control of devices in space, people’s lives in e-home, or communication in novel ways [3].
To obtain a better understanding, a brief description of the human brain structure which leads to EEG generation will be useful. This work is mainly divided with two major steps: System design where paradigm is one of the major components to evoke the BCI potential. Another step is to collect and analyze the data for system evaluation. However, BCI systems usually suffers from unexpected behavior in some situations due mainly to loss of user concentration, interference from electromagnetic waves, noises from power lines or measuring electronics which poses challenges to BCI development. Sometimes the systems come with the eye fatigue caused during the training stage, the occurrence of tearful eyes, dizziness and postural discomfort.
1.2 Research Objectives of This Study
An injury or a disease may severely damage certain neuron pathways, what once were simple tasks may become impossible or very cumbersome to complete. Such a tragic event causes a loss of any natural way communication with the environment. Under such circumstances, recovery of neuronal becomes very difficult. The motor pathway can’t be re-established to its full strength. BCI is the only alternative to this disconnected communication. This manuscript presents the BCI research which focuses on the study of EEG signal processing and classification techniques to design a speller suitable for the users in need as a tool to communicate with others. BCI research arena have observed significant achievements. However, the BCI research field is still growing and cherishes a promising future ahead. In order to make it a mature technology, still room for numerous possible improvements. Among these, few important aspects have been addressed in this work. First of all, design of a speller paradigm to lessen the fatigue and discomfort of the
Secondly, develop the associated signal processing algorithm to improve the information transfer rate. Signal processing algorithm was realized to conduct BCI experiments in real time with the following offline analysis. Finally, constitute a hybrid paradigm by the fusion of two different BCI techniques and study the response of the users to this hybrid BCI speller.
Keeping these existing limitations in mind, the motive to perform this research study was to develop an efficient BCI system with following characteristics:
• High mobility, flexibility
• Meet user’s comfort
• High accuracy and speed
• Ready to be employed in clinical premise
• To expand the group of BCI users
The contributions, to this study, to accomplish these goals can be categorized into two major themes: design of better speller paradigm, and better EEG signal processing and classification. In fact, both of these tasks need to consider the subject specific variation based on the spectral or spatial components of one’s brain activity. Therefore, such study requires developing an algorithm which mathematically can interpret the EEG features as well as discard the subject bias so that the physiological information can be conveyed to the classifier in an interpretable fashion [2]. In summary, the research goals were
• to eliminate some of the BCI limitations by implementing BCI paradigms
on LCD monitor, and
1.3 EEG Signal
An EEG is a noninvasive medical imaging process that detects the electrical activity in human brain using small, flat metal discs (electrodes) attached to the scalp top surface and records this activity with the help of a conducting medium. Brain cells communicate via electrical impulses and are active all the time, even someone is asleep. This neurological activity appears as wavy lines on an EEG recording. EEG is graphically displayed along time axis as a difference in the generated voltages over two sites of brain. EEG is traditionally used for diagnostic purpose in clinics and hospitals such as for detecting epilepsy or other brain disorders, brain tumor, head injury, brain stroke, sleep disorders, dementia, to name a few. The most unique benefit of EEG is that it is risk free, safe and painless.
The local current flow is generated in the brain is due to the sodium potassium pumps at the neuronal level. The pumping of the positive ions Na+ (Sodium), K+ (Potassium), Ca++ (Calcium), and the negative ions of Cl- (Chlorine) through the channels in neuron membranes generate current in the brain as governed by membrane potential. Such activities create recordable but weak (just a few millionths of a volt) EEG signals between electrode and neuronal layers that can be amplified and stored in computer memory in digitized form. EEG was first recorded by Hans Berger in 1924 [4]. Berger first
announced the term “electroencephalogram” for describing the weak electric currents recorded as human brain signal. He used his ordinary radio equipment as an electric signal amplifier and found that EEG changes following the physiological state of human. For example, the transition from relaxation to alertness will imprint a consistent and recognizable alteration in brain signal. In addition, sleep, anaesthesia, lack of oxygen and certain neural diseases,
such as in epilepsy changes the functional status of brain. Hans Berger depicted that EEG can be recorded non-invasively without opening the skull.
Contemporary views about the origin and nature of EEG signals require a broad discussion about the brain and its functionalities. the brainstem, the cerebellum, and the cerebrum are the three principal parts of a brain [5]. The cerebrum is the largest part of the brain which is further divided into various lobes and structures. The cerebrum directs the conscious or unconscious thought and action through motor functions. The brainstem is the junction to the cerebral spinal column and acts as the base of the brain. the medulla, pons, and midbrain are the structures which constructs the brainstem. As an intersection, the brainstem’s primary function is to relay the cerebellum and cerebrum signals to the spinal column. Basic life functions such as breathing, heart rate, and body temperature are regulated by the brainstem. The brainstem also handles many involuntary or automatic responses, such as sneezing, coughing, and yawning. The cerebellum is located just under the cerebrum. The cerebellum’s handles motor learning, posture or coordination, and balance of the body. Voluntary movements require the combined action of a variety of different muscle groups, and the cerebellum plays a key role by coordinating the timing and actions of these different muscles. On the other hand, the cerebrum itself is separated into four different lobes: the frontal lobe, the parietal lobe, the occipital lobe, and the temporal lobe. Altogether, these four parts of the brain is known as the “cerebral cortex” which is further bisected into two different halves: the right hemisphere and left hemisphere. Figure 1.1shows the lateral view of the inner parts of the human brain along its functionalities.
Figure 1.1: Inner parts of human brain and its tasks[6].
The frontal lobe of the brain regulates one’s personality. In addition, planning, reasoning, emotions and problem-solving tasks are typically accomplished by the frontal lobe. Information from the other parts of the brain is received by the rear part of the frontal lobe or the motor cortex. The motor cortex also ensures that the body movement are carried out. The occipital lobe is responsible for the processing of visual information. This part of the brain receives visual information from the retinas in the eyes and then interprets that information for use. The top portion of the brain is known as parietal lobe whose main function is making visual perception of various stimuli, recognition of languages, orientation and reading. The parietal lobe is also home to the somatosensory cortex. The temporal lobe perceives speech information. The temporal lobe contains hippocampus which is associated with auditory function and memory. Any damage to temporal lobe pertains with loss of cognitive efficiencies such as memory problems and language deficiencies.
In case of clinical interpretation of EEG, sufficient understanding of normal EEG waveform is a key to identify the abnormality or any fluctuation of the normality in EEG throughout the entire lifecycle of a patient under a clinical diagnosis. However, in case of BCI study, it is not necessary to have deep clinical knowledge for EEG interpretation instead EEG measurement and waveform analyses incorporating frequency, morphology and voltage bear important aspects. Advanced analytical studies map the EEG signal attributes to measure physiological characteristics such as subject engagement, workload, fatigue and drowsiness.
1.3.1 EEG Measurement
It is interesting to know that EEG signal consists of oscillating waves with different characteristics which are identifiers of different brain states. Depending on the frequency, brain wave pattern gets different names which are given in Table 1.1.
Table 1.1 Basic brain waves and their characteristics
Frequency Band Frequency Range Brain States
Gamma () >35 Hz (mainly up to 45
Hz)
Problem Solving, Concentration
Beta () 12-35 Hz Anxiety dominant, active
mind, busy
Alpha () 8-12 Hz Very relaxed, passive
attention
Theta () 4-8 Hz Deeply relaxed, inward
focused
1.3.2 Applications of EEG Signal
There are several studies which have documented about the EEG area of applications. Tzallas et al [7] mentioned how better temporal resolution of EEG signal is engineered to detect epileptic seizures. For example, Adeli et al [8] found differences in the beta and gamma frequency bands after examining EEG signals collected form three different groups consisting of healthy (normal) subjects, epileptic subjects during a seizure-free interval (interictal) and epileptic subjects during a seizure (ictal). Yang [9], evaluated the effect of fatigue on functional corticomuscular coupling (fCMC). Gang et al [10] wanted to overcome accidents by developing a drowsiness detection system to find the parameters related to driver drowsiness. Apart from these, a research field of data mining has evolved to process the large volume of EEG data collected from multiple channels [11]–[13]. EEG analysis opened up another popular research field as sleep analysis. A study by Kassebaum [14] reported that a frequency domain-based state-space analysis of EEG is effective for identifying sleep stages. EEG is also used as a communication channel or a control signal in BCIs [15].
1.4 Signal Acquisition
Advancement in digital technology has laid the foundations of modern EEG equipment with high performance and low cost. Signal acquisition tools incorporate powerful computers for faster recording and data analysis. EEG signal acquisition system comprises recording electrodes with conductive media, amplifiers with filters, analog-to-digital (A/D) converter, and a recording device such as electronic devices or analog-to-digital memory. The 10/20 international electrode placement system is recommended by the
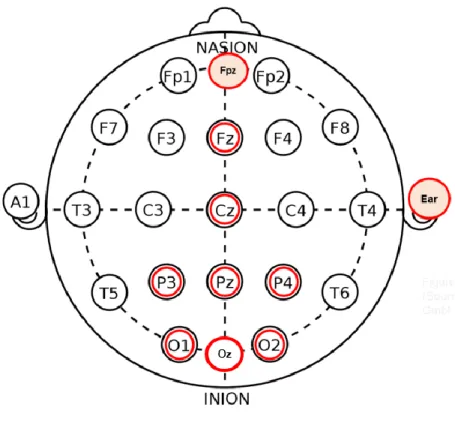
and right-side electrodes as even-numbered. In this convention, two adjacent electrodes are placed 10% or 20% apart of the skull. Figure 1.2 shows the 10/20 International Standard. It is noticeable that F stands for frontal regions, C described the central region, Z refers to skull midline on top or zenith, P is for parietal and T indicates temporal region. In addition, A symbolizes anterior and frontpolar is designated by FP. To identify a site, brain lobe is indicated by a letter and the hemisphere location is marked by a number. Sometimes10/20 system is modified with added electrodes such as electrocardiogram (EKG), eye tracking system, electromyogram (EMG), and extracerebral electrodes to get rid of signal artifact.
Figure 1.2: Electrode distribution in 10/20 international system (adapted from [16]).
The placement of the electrodes over the scalp maintains a pattern of connection between 16 or more electrodes which is termed as montage. The EEG can be monitored
with either a bipolar montage or a referential one. Bipolar montage includes two electrodes per single channel, so each channel (waveform) has a reference electrode. For example, the channel "Fp1-F3" is a bipolar montage which represents the difference in voltage between the Fp1 and F3 electrodes. The referential or unipolar montage means that a common reference electrode for all the channels and each channel represents the difference between a certain electrode and the designated reference electrode. EEG reference is connected to either ear. In addition, there are average reference montage and Laplacian montage. Average reference montage uses the average of all the electrodes and this averaged signal is considered as the common reference. Laplacian montage almost similar as average reference montage except that a weighted average of the surrounding electrodes is used as a reference. Indeed, there is an inappropriate practice of using “ground” and “reference” interchangeably. Though both “ground” and “reference” are established at a different position than the "recording" electrodes, the location of the ground could be placed anywhere on the subject body. In general, the ground does not have any standard position and is used to prevent power line noise at 60 Hz from interfering with the small biopotential of EEG signals of interest. By design, ground is used for common mode rejection and no standard position is required in this mode. Scalp midline positions on the forehead are popular choice for a ground electrode for EEG recordings as they do not amplify the brain signal in any half of the brain with respect to the other one. Another popular reference convention is “summed ears,” or "linked ears," which leads to a physical or mathematical average of electrodes attached to either earlobes or mastoids. EEG montage stages incorporate the data collection processes mainly with wired or wireless EEG systems. In case of wired EEG data collection, the electrodes are placed on different spots of the scalp
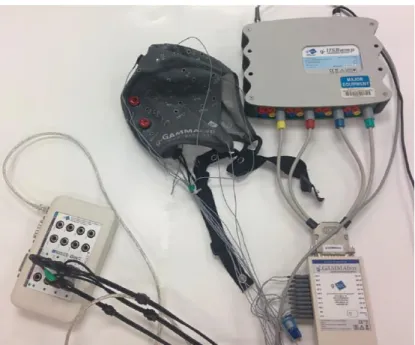
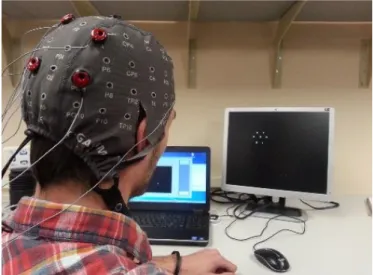
as designated by the type of application. For example, a wearable cap with the electrode tips is used to cover the head of a subject during EEG data acquisition for spelling words in a BCI speller (Figure 1.3). A short discussion on the merits and demerits of the wired or wireless EEG systems are presented below.
Figure 1.3: EEG data acquisition using a hand-free BCI speller paradigm.
1.4.1 Wired EEG Systems
1.4.1.1 Merits
Electrodes are easily identifiable.
Allows connection status and impedance checking.
1.4.1.2 Demerits
Setup time is longer than other, may take 5-10 minutes.
Long and loose wires may result in an antenna effect causing signal artifacts.
Restrict the subjects’ mobility from one place to another.
Large number of electrodes and connected wires may be perplexing to find the
1.4.2 Wireless EEG systems
1.4.2.1 Merits
First of all, such a system eliminates requirement of any wire connection and uses wireless transmission.
Allows the subject to move during data collection.
Subject is free to change and adjust the posture to be in comfortable position.
1.4.2.2 Demerits
As it does not have direct conduction medium, wireless system can easily be interrupted by external noise.
Accuracy is comparatively less than that of a wired system 1.5 Brain-Computer Interfaces (BCI): Definition and Categories
A Brain-Computer Interface allows controlling computers or external devices using neuronal activity for people with and without disabilities. According to Wolpaw et al. [17], BCI is a communication system between brain and machine which can learn and interpret the signals from an active brain to execute commands or control the devices bypassing the normal neuromuscular pathways. As the name suggests, BCI has evolved from an interdisciplinary study which is a combination of engineering, cognitive neuroscience, psychology, machine learning, human-computer interaction and others. It’s interesting to note that limited number of sensors results in overlapping of the measurable brain characteristics which are separated with the help of specific tasks performed by the BCI users. However, advances in digital technology, remarkable progress in cognitive
knowledge in understanding the brain functions to change the world with the application of BCI as a new modality in human-computer interactions. BCI extends its benefits not only to the disables through neuroprosthetics and rehabilitation, but also to the able bodies to live in smart homes along with embodied health monitoring and entertainment devices.
1.5.1 BCI Systems and Modalities
In order to identify user intentions in brain activity, invasive or noninvasive electrophysiological control signals can be collected and recorded applying suitable hardware and software technologies. BCI hardware captures physiological signals from the brain. Among these signals Electroencephalography (EEG), magneto encephalography (MEG), functional Magnetic Resonance Imaging (fMRI), functional Near Infrared Spectroscopy (fNIRS), Electrocorticography (ECoG) and Subcortical Electrode Arrays (SEA) are all in use for BCI system and analysis[18]. Distinctive cognitive functions are formulated by several patterns of brain activity. With the help of EEG, brain activity in the neocortex is measured as voltage differences over the scalp. Since the first paradigm design and experiment with a P300 BCI system in 1988 by Farwell and Donchin, many BCI applications have been developed and refined as assistive technology, device control, user state monitoring, training and education, gaming and entertainment, safety and security, speech synthesizers, assistive appliances and neural prostheses among others[19]. Many BCI applications are based on event-related potentials (ERP) which are potentially suited for patients with neurodegenerative diseases or severe motor impairment[20].
However, these nonmedical BCI applications are continuously facing the challenge of being transferred from the research laboratory into real-life situations regarding the usability and the acceptability, hardware convenience, cost of the equipment, setup time,
and interface with existing systems. Additionally, there is a step of significant difficulty experienced by BCI researchers in applying appropriate signal processing strategy. In this paper, efforts were made to address the existing solutions regarding the BCI signal processing. As many BCI communication and control systems have been realized with the EEG data acquisition, this study focuses on revealing the complexity and difficulty issues as well as the possibilities which lies under the fact that optimization of accuracy and speed heavily depends on a suitable signal processing scheme.
1.5.2 Dependent and Independent BCI
An independent BCI does not require any motor control by the user whereas a dependent BCI requires a volunteer action or certain level of motor control by the subject. Therefore, a dependent BCI mostly suit for the able-bodied persons. Dependent BCI systems are more comfortable and easier to use. To help the people with severe disability in any motor control, an independent BCI is more appropriate.
1.5.3 Invasive and Non-invasive BCI
Brain activities cause an influx of ions that depolarize the neurons and thousands of such spatially aligned neurons generates electrical potentials. The electrophysiological activity can be measured as the summation of these electrical potentials both invasively and noninvasively. Both of the invasive and noninvasive techniques are used in medical application to obtain high temporal and spatial resolution. BCI systems can vary depending on the different placements of sensors as portrayed in Figure 1.4.
In case of invasive technique, sensors are implanted under the skull. Electrocorticogram (ECoG) and intra-cortical neuron recording (INR) are two invasive
Figure 1.4: BCI types depending on the sensor placement [21].
techniques for recording electrophysiological signals. Both of these techniques result in a very good signal-to-noise ratio but at the cost of minor surgery. INR inserts micro-electrodes through the cortex layer while ECoG sets a group of micro-electrodes on surface of the cortex. Evidently, invasive techniques are limited only to specific applications. Moreover, invasive methods are not able to cover the whole cortex area. On the other hand, noninvasive positron emission tomography (PET), functional near-infrared spectrography (fNIRS) and functional magnetic resonance imaging (fMRI) involve with indirect measurement of the brain activity by estimating the cerebral blood flow optically and magnetically, respectively. In other words, these techniques use hemodynamic activity which causes the active neurons to obtain higher rate of blood glucose and oxygen than the inactive neurons making a difference in oxygen-rich and oxygen-poor blood. Eventually, these methods quantify the changes in blood-oxygen levels at various locations of the brain.
All of these methods suffer from the poor temporal resolution with delays around one to several seconds [22]. fNIRS technology is portable, safe and easy to use, resistant to motion artifacts and can be employed in a subjects’ natural environment. In this method, near infrared light is projected into the brain from the surface of the scalp and optical scattering at various wavelength are measured to localize and estimate blood volume and oxygenation changes. Such a quantification allows to generate a functional map of brain activities in terms of the degree of oxygen concentration. Likewise, fMRI and PET use the differences in blood-oxygen consumption levels. Though the fMRI system has very good spatial resolution, it is expensive and not portable as fNIRS. PET uses fludeoxyglucose (FDG) as a radioactive agent to map the neural metabolic activity in terms of regional glucose uptake. However, fNIRS, fMRI and PET share a common drawback of having a low temporal resolution. In general, these techniques require 2-5 seconds after the neural activity to detect the change of local blood flow.
Among other noninvasive techniques, such as MEG and EEG measures magnetic field and electric potential of the brain with a very good temporal but low spatial resolution. MEG device is almost as bulky and costly as fMRI, an exception to EEG. Among the current non-invasive methods, EEG is one of the popular and heavily used measurement techniques for BCI considering clinical as well as nonmedical applications. However, setting up the EEG sensors and probes might require several minutes. Due to the distance between the sensors and brain, the measured EEG signals are relatively noisy and weak in magnitude (5-100 μV) which needs to be filtered and amplified before further analysis. Afterward, these signals are translated into device output commands and feedback to user by BCI software. In fact, EEG became relatively simple to use and inexpensive as a result
of the recent advances in wireless systems and electronics. Therefore, last few decades’ plethora of BCI studies mainly focused on the EEG-based BCI system. A typical EEG signal window is presented in the Figure 1.5.
Figure 1.5: Sample EEG data recorded using a single electrode.
1.5.4 Synchronous and Asynchronous (self-paced) BCI
Functional connectivity within the cortex changes with the sensorimotor stimulation, motor behavior, and mental imagery. Such actions may cause amplitude suppression known as event-related desynchronization (ERD) or amplitude enhancements refereed to event-related synchronization (ERS) in certain frequency components (alpha and central beta). For instance, imagining a left-hand movement is known to trigger a decrease of power (ERD) in the μ and rhythms, over the right motor cortex. In case of a synchronous BCI, the users’ interaction with the targeted application is time controlled as the system informs the user of the moment when he has to interact with the application. So, the system does not respond to the user action if it falls outside the desired time period. Most attractive advantage of synchronous BCI is that the system knows the exact time span when the mental states should be classified. On the contrary, in an asynchronous or self-paced BCI, the user can perform a mental task to interact with the system any time while
can do nothing to stop the interaction or make the BCI system inactive. In ideal case, all BCI should be self-paced, flexible and comfortable. However, such a technique is difficult to implement, and need to monitor and analyze the brain signal at a continuous pace to detect whether the user is trying to interact with the system. In addition, the asynchronous BCI need to determine the mental task that the user is performing. As a consequence, vast majority of BCI systems are synchronous and BCI interests are just gradually started increasing to address the challenges of self-paced BCI.
1.5.5 Active, Reactive and Passive BCI
Depending on the extracted information and techniques, BCI systems fall under three different categories such as active, reactive and passive systems.
Motor imagery is an active BCI where the user, voluntarily and without any external intervention, practices a mental task to generate commands to control an external device or application. A machine algorithm is used to detect the specific pattern of brain activity in real time so that the resulting information is capitalized to control a device by thought. In addition to motor imagery, visual imagery, spatial imagery involving navigation in familiar surroundings and auditory imagery of music are some other active BCI systems. However, due to the potential use as communication channel for disable individuals, motor imagery is the most investigated area of research to design an active BCI. In fact, actual movement performance and activity during motor imagery shows similar pattern in brain wave. For example, mu rhythms of EEG are altered during actual motor activities in terms of hands or finger movements. The EEG can be recorded at sensorimotor cortex at its three primary frequency components: a component between
9-movement has been utilized as attractive motor imagery tasks for controlling cursor movement as well as navigating web pages. On the other hand, visual imagery is associated with the imaginary ‘observation’ of an object with the mind. This allows to study certain or entire characteristics of the object from the EEG signal. For instance, sensory features such as the form and color of the object may be used as specific attributes. Similarly, auditory prompts can be presented to the participants to classify food, tool, human faces, buildings, animals, or other man-made objects.
BCI systems designed with the use of visual evoked potentials and P300 are few examples of reactive BCI. In this technique, brain reaction to an external stimulation are measured and mapped to generate a system output. Therefore, the user indirectly modulates the brain action to perform a specific task. In reactive BCI, temporal and spectral characteristics of the EEG signal changes depending on the presented stimulus and the task to do. The two most popular techniques that use evoked potentials are (1) visual evoked potential (VEP), and (2) P300, which is a component of an event-related potential (ERP). Both of these potentials are greatly pronounced in the EEG signals. An ERP is the measured brain response that is the direct result of a specific sensory, cognitive or motor event. ERPs can be classified according to the latency at which their components occur after stimulus presentation. ERPs with short latency typically occur at < 100ms after stimulus. These components are generated during the sensory stimulus processing stages in the brain, and they are named exogenous components because they are a direct response to an outside stimulus source. ERPs with long latency occur at greater than 100ms after stimulus and represents the cortical processing stages. They are called endogenous components since they are less determined by the physical features of the stimulus. Neurophysiologic signal
P300 is the component of the ERP elicited by rare, task-relevant events in the process of decision making, and as such is an endogenous component. It is called P300 because it evokes a positive peak over the parietal lobe with a latency of around 300ms after a decision has been made and is recorded with EEG over the central-parietal scalp. P300 peak is evoked by an oddball paradigm where the users’ pay attention to rare or infrequent stimuli in a random series of stimulus events of two categories: target event and non-target event. This signal is present in every human and therefore requires little to no initial user training, making it a popular technique for BCIs. In fact, users are asked to count the number of times the object is flashing which make them focus on the assigned task and verify the counted number with the actual set value for each experiment. However, the day to day mental load and physical stress varies with the human body. So, a short survey is taken from the subject before every experiment to measure their cognitive state and rest level. For example, if they were not confident enough about proper rest, the test was kept on hold for later. However, a person with proper rest and relaxed condition still can get poor results in BCI tests if they are BCI illiterate. In order to take care all such unexpected possibilities, every test was conducted twice.
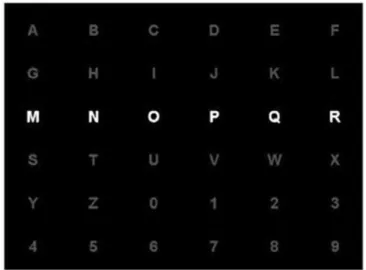
A speller with a 6x6 matrix consisting of English alphabets was the first P300 based BCI where rows and columns flashed randomly. After a few trials of random flashing, the target latter can be identified with the evoked P300. Decreasing the number of flashes per trial, it is possible to enhance the speed of speller paradigm. However, there is always a tradeoff between the spelling speed and classification accuracy. Likewise, a steady-state visual evoked potential (SSVEP) is developed in the visual cortex during an individual’s focus or constant attention to a visual object flickering with a frequency above 6 Hz.
SSVEP based BCI system can be used to control the cursor movement in multiple directions or to communicate with other persons. Depending on the user’s intention or application, flickering objects of different shapes, colors or other attributes can be employed to design a SSVEP based paradigm. The changing frames of monitor makes the eyes get tired quicker than P300 BCI. As a consequence, the observer can lose his interest resulting in inadequate attention. Eventually, this necessitates the change in color or intensity of the flickering objects which can bring better effect of visual feeling in the user’s mind. This action also points to the importance of electronic monitor over the LED arrays. Electronic monitor offers better resolution, soothing feeling of vision, adjustable intensity, and inter space between graphical objects. However, the high flickering graphics can be tearing to incomplete shapes causing frequency mismatch. A monitor with higher refresh rate can remove such limitations. Other reactive BCI examples are somatosensory and auditory potentials.
Passive BCI systems measures the user’s mental state from the arbitrary brain activity without any external stimulus or voluntary control. Workload, fatigue, excitement, level of engagement are some states of mind which are used to design a passive BCI. Human satisfaction and emotion is embodied with the human cognition that allows to evaluate human interaction, and therefore passive BCI may also be referred to as cognitive monitoring.
1.6 Feature Extraction Methods in EEG Based BCI Systems
In general, any signal processing is comprised of two different stages as feature extraction and algorithm for translating the features to a corresponding class. However, acquired EEG signals suffer from noise with very low signal-to-noise ratio. In addition,
sensor artifacts, sensor failure, or subject fatigue leads to non-stationarities due to various physiological and environmental factors. So, designing an effective interference tool is critical to extract information about the salient EEG features. Such step also aimed at preprocessing and artifacts removal.
The first stage is employed to reveal the brain signal features that can be modulated by a BCI user. However, various methods can be applied to the digitized EEG signal such as spatial and spectral analysis, measurements of voltage distribution, and detection of action potentials of individual neurons. This stage is immediately followed by translation procedure. All signal features are mapped to some classes representative of device commands by employing either linear or nonlinear method. These device independent signal features can be applied to build a functional or communicative relationship between the user and the device under operation. In order to satisfy the criteria of an application, BCI system needs an effective translational algorithm which requires adaptation to the specific signal features that can be either be controlled or learned by the user to improve individual performance. In sum, the effective interaction between the user and the BCI system necessitates incorporation of a better signal processing method.
Evoked potential or evoked response is different from spontaneous potentials. After the presentation of a stimulus to a human or an animal, electric potential shows significant voltage fluctuations resulting from evoked neural activity. In general, low amplitude evoked potentials are time-locked to the stimulus and amplified through signal averaging and other techniques. Signal averaging allows to average repeated responses thereby cancelling the random noises.
EEG recording for BCI research needs a large number of descriptors which are commonly used with cognitive research, too [23]. Key descriptors to categorize and describe the complex brain activity have been briefly highlighted in Table 1.2. Though behavioral and functional aspects are major concern in BCI, many other aspects of EEG activity such as spatial distribution, frequency, amplitude, morphology, and periodicity are identically worthwhile[24].
Table 1.2: Important measurement parameters of EEG signal
EEG Signal Features Description Comments
Morphology Waveshape
Brain activities form
waveshapes that are the identifier of some events or characteristics.
Repetition
Defines the re-occurrence of waveform types.
Rhythmical repetitive
waveforms. Also, may
gradually increase and then decrease in amplitude.
Frequency
Number of repetitions of similar waveforms in a single unit of time.
---
Amplitude
microvolts (μV);
peak-to-peak or from the calibrated zero reference
EEG Signal Features Description Comments
Distribution
Electrodes records electrical activity which are spatially oriented over different parts of the head
Spatial orientation is
described using electrode names, not by head regions or brain areas.
Phase Relation
Change in troughs and peaks of the wave components over time considering single or multiple channels
Phase refers to the temporal relationship between different components of a rhythm.
Timing
Relative occurrence of activity in time at different channels
---
Reactivity
Changes that can be
introduced by one or multiple features as mentioned above due to various maneuvers or functions; appears as some normal and abnormal patterns
Used to train or evaluate the subjects condition; study of drug addiction
1.6.1 Signal Amplitude
The temporal resolution of EEG signal can be utilized by extracting the EEG amplitude in a simplest but still efficient way. The time course of the EEG signal amplitude
feature vector is made up of the concatenated raw amplitudes of the signals from the different electrodes. Sometimes these feature values are preprocessed before feeding as input to a classifier. In general, the classification algorithm allows to reduce the amount of data to be used by preprocessing methods such as down sampling or spatial filtering. It is a very common feature extraction technique in P300 classification methods. Similar to as many other features, low signal to noise ratio of EEG signal need to be taken care of along with the variability of the responses to stimuli within a single subject [25].
1.6.2 Power Spectral Density (PSD)
The power of the different frequency contents of a signal is measured as Power Spectral Density (PSD) features from the user’s EEG signal within a preset time window. Such a frequency-based power distribution sometimes simply termed as power spectrum which gives valuable insight about the BCI signal. The major aspect of this feature is to estimate the signal-to-noise ratio of the power spectrum in each stimulus frequency [26]. As the fast Fourier transform (FFT) has low computational cost, PSD features can be computed by squaring the Fourier transform of a signal as a nonparametric power spectrum estimation method or by finding the Fourier transform of the autocorrelation function of the EEG signal [27]. PSD features have proved to be proficient in differentiating and detecting a large number of neurophysiological signals which leveraged it probably to be the widely used features for BCI applications [28]. However, PSD features from a single channel (or a bipolar montage) can be sensitive to noise once the signal-to-noise ratio is very small.
1.6.3 Canonical Correlation Analysis (CCA)
It is quite apparent from the previous sections that low amplitude of EEG signal has pinpoints to the necessity of improving signal-to-noise ratio and many different algorithms stride to reach this goal. With no exception, CCA processes the signal as a form of array using channel covariance information so that the BCI system may have improved the signal-to-noise ratio. CCA is a multivariable statistical method used to recognize the frequency. If a specific frequency is buried into the low power EEG signal, CCA employs another set of noise free data as a reference to determine any underlying correlation between these two sets of data. CCA is actually an extension of ordinary correlation where two sets of variables are employed [29], [30]. A pair of linear combinations are formed for two sets which are called canonical variables. CCA maximizes the correlation between the two canonical variables. In the following step, it computes a second pair of canonical variables which has a next highest correlation but completely uncorrelated with the first pair of canonical variables. This action is repeated to construct more canonical variables until the number of pairs of canonical variables equals the number of variables in the smaller set. Among the CCA generated canonical correlation coefficients, the largest coefficient has the best description capacity to describe the relation of the two corresponding sets. Note that although CCA generates multiple correlation coefficients, in this paper we only consider, which has the best description capacity.
1.6.4 Independent Component Analysis (ICA)
ICA is one of the better feature extraction and classification methods which maximizes the non-Gaussianity of statistically independent components (ICs). Many other
analysis [31]. However, some studies suggest that such action may also suppress the power spectrum of the underlying neural activity [32].
As ICs are generated after mixed signal decomposition, satisfaction of non-Gaussianity is critical to the estimation of original signal [33]. Typical ICA steps involve mixed signal separation, artifacts removal from EEG signal, and eliminating noises. Implementation of ICA results in removal of the irrelevant and redundant information, thereby a significant reduction in computational costs. Major advantage of ICA is that this statistical procedure blindly splits the mixed signals into its sources without any previous information on the nature of the signal. However, another lead assumption involved in ICA claims that the observed EEG signal comprises of mutually independent cognitive activities or artifacts.
ICA expresses an EEG signal x(t) in terms of their sources s(t)as:
𝒙(𝒕) = 𝒇(𝒔(𝒕)) + 𝒏 (1.1)
In equation (1.1), f is any unknown mixer function, and n is a random noise. The dimension
of s(t) depends on the number of sources. The dimension of output vector x(t) is same as
the number of data channels. In general, the number of sources is usually assumed to be less than or equal to the number of channels [34].
Source vector s(t) is estimated by inversion of f and then, by mapping x(t) to the
source space. Based on f function ICA can be defined for two different models, either a linear or nonlinear function. If the linear model appears too simple to explain the complexity of the observed data x(t), nonlinear assumption is applied in those cases.
In case of linear approximation, equation (1.2) can be re-written as a matrix multiplication where A is the mixing matrix:
𝒙(𝒕) = 𝑨𝒔(𝒕) + 𝒏 (1.2)
Above approximation in equation (1.1) works reasonably well in brain signal processing applications on the assumption that the observed data is noiseless or that the signal-to-noise ratio is too high [35], [36]. In addition, s(t) and A are obtained from x(t) by
means of certain algorithms such as Infomax [37]. Moreover, FastICA and JADE are two other widely used algorithms. Here, FastICA will be discussed in more detail.
Before applying FastICA algorithm, a whitening process need to be implemented. For any signal x, the whitening process involves linear transformation of the observed signal which
is applied to reduce the parameters to be estimated. The components of the transformed signal 𝑥̃ are uncorrelated with their unity variance as in equation (1.3).
𝛆{𝒙̃𝒙̃𝑻} =I (1.3)
The whitening transformation is always possible. A popular method is to use the eigenvalue decomposition of the covariance matrix, 𝛆{x̃x̃T} = 𝐄𝐃𝐄𝐓, where E is the orthogonal matrix of eigenvectors of 𝛆{𝐱̃𝐱̃𝐓} and D is the diagonal matrix of its eigenvalues. In equation (1.4), the whitening transformation is operated by
𝒙̃ = 𝑬𝑫𝟏𝟐𝑬𝑻𝒙 (1.4)
𝒙 = 𝑨𝒔 (1.5) In equation (1.5) s is the matrix of independent components and A is the activation matrix (s and A will be discussed later). Substituting equation (1.5) into equation (1.4) gives
𝒙̃ = 𝑬𝑫𝟏𝟐𝑬𝑻𝑨𝒔 = 𝑨̃𝒔 (1.6)
Where 𝑨̃ is an orthogonal matrix in equation (1.6) since
𝜺{𝒙̃𝒙̃𝑻} = 𝑨̃𝜺{𝒔𝒔𝑻}𝑨̃𝑻=I (1.7)
Therefore, the number of parameters to be estimated is reduced from n2 (in A) to n(n−1)2 (in
A) because 𝑨̃ has only n(n−1)2 degrees of freedom in equation (1.7). 1.6.5 Minimum Energy (ME) Method
The minimum energy combination method combines an arbitrary number of electrodes to cancel as much of the noise as possible. This purpose is satisfied by removing any potential SSVEP components from all the electrode signals. To accomplish this, SSVEP components are projected onto the orthogonal complement of the SSVEP model matrix X.
𝐘̇ =Y-X(XTX)-1XTY (1.8)
After this operation, 𝐘 ̇will contain only noise under the assumption that just slightly small unavoidable effect the projection in (1.8) has on the noise. In the next step a weight vector 𝐰 ̂ with unity norm is constructed to minimize the resulting energy of the set of electrode signals𝐘̇𝐰̂. So, following problem is optimized:
‖𝐘̇𝐰̂‖𝟐 𝐰̂ 𝐦𝐢𝐧 = 𝐰̂𝐓 𝐰̂ 𝐦𝐢𝐧 𝐘̇𝐓𝐘̇𝐰̂ (1.9)
The quadratic form on the right hand side in (1.9) is bounded by the minimal and maximal eigenvalues, λ1 and λNy (λ1 ≤ λNy ), of the symmetric matrix 𝐘̇𝐓𝐘̇.
So, the smallest eigenvector ν1 appears as the solution to the minimization problem, and the energy of the resulting channels combination equals the smallest eigenvalue λ1. Moreover, the matrix 𝐘̇𝐓𝐘̇ is symmetric, and the eigenvectors are orthogonal. Eventually, use of the second largest eigenvector ν2 to select the combination of the electrode signals
produces a second channel signal which is uncorrelated with the first channel, and results in somewhat higher energy λ2. Therefore, columns in the weight matrix W are chosen as
eigenvectors. Although the weight matrix W have some negligible effect, it is easy to
predict that the SSVEP response is more easily detectable in the first set of channels with the lowest possible content of noise components.
In particular, the weight matrix is chosen as in equation (1.10):
𝐖 = (√𝛌𝛎𝟏
𝟏
… 𝛎𝐍𝐬
√𝛌𝐍𝐬)
(1.10)
where, Ns denotes the number of channels. The normalization of each eigenvector with the
square-root of the corresponding eigenvalue resulting in channel signals s1, …., sN5, will
have the same energy. The number of eigenvectors to include in the weight matrix depends on the number of channels need to be produced. In summary, no single optimal solution exists for this model selection problem. In general, Ns is chosen to discard as close to 90%
1.6.6 Principal Component Analysis (PCA)
PCA is a second-order statistic used to maximally decorrelate the components of an input in temporal domain. These components are utilized to compute orthogonalized and normalized features. One of the advantages of PCA components is that the artifacts can be removed using PCA correlation to clean up EEG signal. For instance, PCA decomposes a multi-electrode EEG trial (such as 32 channels) into linearly uncorrelated components, and then reconstruction is performed by omitting unwanted artifact components such as EOG (originating from the eye). This technique also provides the insight of the data structure which reveals the simultaneous artifact by separating the data according to the variance [38].
1.7 Classifiers Used in EEG Based BCI Systems
The main purpose of a classifier is to translate the extracted features into commands using either regression or classification algorithms [39]. The algorithms used to classify the features are known as “classifiers”. However, BCI community mostly uses classification algorithms to identify the neurophysiological signals. Previously extracted feature vector is automatically assigned to a class in a classification step. The kind of mental task performed by the BCI user is represented by this class. Training sets are feed into a classifier in a training phase so that the classifier can learn to identify the class of a feature vector. The feature vectors of the training sets are labeled with their class of belonging. Depending on the taxonomy of the different classification algorithms, classifier families can be categorized into five main groups: linear classifiers, nonlinear Bayesian classifiers, artificial neural networks, nearest neighbor classifiers and hybrid classifier or
classifier combinations. Selection of classifiers depends on the classifier properties befitting a specific application. For example, discriminative classifiers learn to discriminate the classes or the class membership to classify the feature vectors. Such classifiers are associated with low complexity and stable performance so that any insignificant or small variations in training set does have very little to no effect on their classification performance. In general, linear classifier applies discriminative algorithms to discriminate or distinguish the classes with a linear function. Due to the nature of these algorithms, BCI societies favor Support Vector Machines (SVM) and Linear Discriminant Analysis (LDA) more than other nonlinear classifiers [40].
1.7.1 Support Vector Machine (SVM)
In fact, SVM is one of the popular modern classifiers that have been designed to provide several desirable performance characteristics. The major goal of a SVM is to find the hyperplane which apparently maximizes the data separation by keeping the nearest training points at possible farthest distance optimizing the generalization capabilities. The regularization parameter of SVM enables it to avoid data over-fitting. Like many other classifier, SVM can create both linear (linear support vector machine or, LSVM) and non-linear (Gaussian support vector machine, or GSVM) boundaries to classify the data. In that case, kernels are used to non-linearly map the input data to a high-dimensional space which is then linearly separable [41]. A number of different kernels exist, but the most popular in BCI literature is the Gaussian radial basis function (RBF) kernel. For example, the use of the RBF kernel adds another parameter that needs to be tuned through cross-validation, i.e., γ (kernel bandwidth, in equation (1.11)):
K(xi, xj ) = exp(−γ|| xi – xj||2 ), γ > 0. (1.11)
For the two linearly separable classes shown in Figure 1.6, binary classification is performed by constructing a hyperplane as described by the weight vector w and the bias term b. Each sample of training datasets is denoted as xiand the corresponding class labels
as yi. However, all of these can be achieved only at the expense of execution speed. Usually,
just one sequence of the observed signal is not enough for correct classification due to its noisy component. Therefore, it is recommended that several sequences need to be combined to generate final classification results.
The category label of an incoming data x can be predicted by using equation (1.12)
𝒇(𝒙) = 𝒘. 𝒙 + 𝒃 (1.12)
In equation (1.12), the input data vector x is projected on the weight vector w which is perpendicular to the separating hyperplane. The sign of the projection would unveil the predicted class label as either positive or negative. The hyperplane can be described by the vector w and bias term b, and w (in Figure 1.6) only for optimized separation. These necessary vectors are called support vectors [42].
Usually, w and b are tuned to maximize the distance between the parallel hyperplanes that separate the data. These hyperplanes can be constructed by the equations (1.13) and (1.14):
𝒘. 𝒙 − 𝒃 = 𝟏 (1.13)
![Figure 1.2: Electrode distribution in 10/20 international system (adapted from [16])](https://thumb-us.123doks.com/thumbv2/123dok_us/799203.2600999/27.918.287.685.509.884/figure-electrode-distribution-international-adapted.webp)
![Figure 1.4: BCI types depending on the sensor placement [21].](https://thumb-us.123doks.com/thumbv2/123dok_us/799203.2600999/33.918.188.770.149.481/figure-bci-types-depending-sensor-placement.webp)
![Figure 1.7: SSVEP amplitude with different flickering frequency (adapted from [50]).](https://thumb-us.123doks.com/thumbv2/123dok_us/799203.2600999/60.918.209.774.129.463/figure-ssvep-amplitude-different-flickering-frequency-adapted.webp)