Moving Big Data to The Cloud:
An Online Cost-Minimizing Approach
Linquan Zhang, Chuan Wu, Zongpeng Li, Chuanxiong Guo, Minghua Chen, and Francis C.M. Lau
Abstract—Cloud computing, rapidly emerging as a new com-putation paradigm, provides agile and scalable resource access in a utility-like fashion, especially for the processing of big data. An important open issue here is to efficiently move the data, from different geographical locations over time, into a cloud for effective processing. Thede factoapproach of hard drive shipping is not flexible or secure. This work studies timely, cost-minimizing upload of massive, dynamically-generated, geo-dispersed data into the cloud, for processing using a MapReduce-like frame-work. Targeting at a cloud encompassing disparate data centers, we model a cost-minimizing data migration problem, and propose two online algorithms: an online lazy migration (OLM) algorithm and a randomized fixed horizon control (RFHC) algorithm , for optimizing at any given time the choice of the data center for data aggregation and processing, as well as the routes for transmitting data there. Careful comparisons among these online and offline algorithms in realistic settings are conducted through extensive experiments, which demonstrate close-to-offline-optimum perfor-mance of the online algorithms.
Index Terms—Cloud Computing, Big Data, Online Algorithms
I. INTRODUCTION
T
HE CLOUD computing paradigm enables rapid on-demand provisioning of server resources (CPU, storage, bandwidth) to users, with minimal management efforts. Recent cloud platforms, as exemplified by Amazon EC2 and S3, Microsoft Azure, Google App Engine, Rackspace [1], etc., organize a shared pool of servers from multiple data centers, and serve their users using virtualization technologies.The elastic and on-demand nature of resource provision-ing makes a cloud platform attractive for the execution of various applications, especially computation-intensive ones [2], [3]. More and more data-intensive Internet applications,
e.g., Facebook, Twitter, and big data analytics applications, such as the Human Genome Project [4], are relying on the clouds for processing and analyzing their petabyte-scale data sets, with a computing framework such as MapReduce and Hadoop [5], [6]. For example, Facebook-like social media sites Manuscript received on December 1, 2012; revised on May 28, 2012. Some preliminary results were presented at IEEE INFOCOM 2013, mini-conference, Turin, Italy, April, 2013. Work supported by NSERC, Canada (RT733206), RGC, Hong Kong (717812, AoE/E-02/08, 411010, 411011), and National Basic Research Program of China (2012CB315904, 2013CB336700).
L. Zhang and Z. Li are with the Department of Computer Science, University of Calgary (e-mail:{linqzhan, zongpeng}@ucalgary.ca).
C. Wu and F. C.M. Lau are with the Department of Computer Science, The University of Hong Kong (e-mail:{cwu, fcmlau}@cs.hku.hk).
C. Guo is with Microsoft (e-mail: [email protected]).
M. Chen is with the Department of Information Engineering, The Chinese University of Hong Kong (e-mail: [email protected]).
Digital Object Identifier 10.1109/JSAC.2013.1312xx.
collect their Web server logs, Internet click data, social activity reports, etc., from various locations over time, and parse them using Mapreduce/Hadoop to uncover usage patterns and hidden correlations, in order to facilitate marketing decisions.
While most efforts have been devoted to designing better computing models for big data analytics, an important issue has largely been left out in this respect: How does one move the massive amounts of data into a cloud, in the very first place? The current practice is to copy the data into large hard drives for physically transportation to the data center [7], [8], or even to move entire machines [9]. Such physical transportation incurs undesirable delay and possible service downtime, while outputs of the data analysis are often needed to be presented to users in the most timely fashion [9]. It is also less secure, given that the hard drives are prone to infection of malicious programs and damages from road accidents. A safer and more flexible data migration strategy is in need, to minimize any potential service downtime.
The challenge escalates when we target at dynamically and continuously produced data from different geographical locations,e.g., astronomical data from disparate observatories [10], usage data from different Facebook Web servers. With dynamic data, an efficient online algorithm is desired, for timely guiding the transfer of data into the cloud over time. For geo-dispersed data sets, we wish to select the best data center to aggregate all data onto, for processing with a MapReduce-like framework, which is efficient to process data withinonedata center but not across data centers, due to the enormous overhead of inter-data center data moving in the stage of shuffle and reduce [11]. For example, Amazon Elastic MapReduce launches all processing nodes of a MapReduce job in the same EC2 Availability Zone [12].
As the first dedicated effort in the cloud computing lit-erature, this work studies timely, cost-minimizing migration of massive amounts of dynamically-generated, geo-dispersed data into the cloud, for processing using a MapReduce-like framework. Targeting a typical cloud platform that encom-passes disparate data centers of different resource charges, we carefully model the cost-minimizing data migration problem, and propose efficient offline and online algorithms, which optimize the routes of data into the cloud and the choice of the data center for data processing, at any give time. Our detailed contributions are as follows:
We analyze the detailed cost composition and identify the performance bottleneck for moving data into the cloud, and formulate an offline optimal data migration problem. The optimization computes optimal data routing and aggregation strategies at any given time, and minimizes the overall system 0733-8716/13/$31.00 © 2013 IEEE
cost and data transfer delay, over a long run of the system.
We propose a polynomial-time dynamic programming based algorithm to solve the offline optimal data migration problem, given complete knowledge of data generation in the temporal domain. The derived offline optimal strategies serve as a benchmark for our online algorithms.
Two efficient online algorithms are proposed to practically guide data migration over time: an online lazy migration (OLM) algorithm and a randomized fixed horizon control (RFHC) algorithm. Theoretical analyses show that the OLM algorithm achieves a worst-case competitive ratio of 2.55, without the need of any future information and regardless of the system scale, under the typical settings in real-world scenarios. The RFHC algorithm achieves a competitive ratio of 1 +l+11 κλ that approaches 1 as the lookahead window l
grows. Here κ and λ are system dependent parameters of similar magnitudes.
We conduct extensive experiments to evaluate the perfor-mance of our online and offline algorithms, using real-world meteorological data generation traces. The online algorithms can achieve close-to-offline-optimum performance in most cases examined, revealing that the theoretical worst-case com-petitive ratios are pessimistic, and only correspond to rare scenarios in practice.
In the rest of the paper, we discuss related work in Sec. II, describe the system and problem models in Sec. III, and present the offline and online solutions in Sec. IV and Sec. V respectively. Evaluation results are presented in Sec. VI. Sec. VII concludes the paper.
II. RELATED WORK
A series of recent work studies application migration to the cloud. Hajjat et al. [13] develop an optimization model for migrating enterprise IT applications onto a hybrid cloud. Cheng et al. [14] and Wu et al. [15] advocate deploying social media applications into clouds, for leveraging the rich resources and pay-as-you-go pricing. These projects focus on workflow migration and application performance optimization, by carefully deciding the modules to be moved to the cloud and the data caching/replication strategies in the cloud. The very first question ofhow to move large volumes of application data into the cloud is not explored.
Few existing work discussed such transfer of big data to the cloud. Cho et al.[16] design Pandora, a cost-aware planning system for data transfer to the cloud provider, via both the Internet and courier services. The same authors [17] later propose a solution to minimize the transfer latency under a budget constraint. Different from our study, they focus on static scenarios with a fixed amount of bulk data to transfer, rather than dynamically generated data; in addition, a single cloud site is considered, while our study pays attention to multiple data centers.
A number of online algorithms have been proposed to address different cloud computing and data center issues. For online algorithms without future information, Lin et al.[18] investigate energy-aware dynamic server provisioning, by proposing a Lazy Capacity Provisioning algorithm with
a 3-competitive ratio. Mathew et al. [19] tackle the energy-aware load balancing problem in the content delivery networks (CDNs) by an online Hibernate algorithm, which strikes a balance between energy consumption and customer service-level agreements (SLAs). However, no theoretical analysis on the performance, in terms of competitive ratio, is provided.
For online algorithms assuming lookahead into the future, Lu and Chen [20] study the dynamic provisioning problem in data centers, and design future-aware algorithms based on the classic ski-rental online algorithm, where the competitive ratios can be significantly improved by exploiting the looka-head information up to thebreak-even interval. Linet al.[21] investigate load balancing among geographically-distributed data centers, apply a receding horizon control (RHC) algo-rithm, and show that the competitive ratio can be reduced substantially by leveraging predicted future information, via relaxing the optimization variables. Due to the unique integer requirement on the decision variables, our problem cannot be transformed into the ski-rental framework, nor relaxed to utilize the RHC framework. Our RFHC algorithm handles the integer restriction via randomization instead.
This work fills gaps in the existing literature on the transfer of large amounts of data to the cloud in the following three aspects: 1, we focus on dynamically generated data rather than static scenarios with a fixed amount of bulk data; 2, our study pays attention to a cloud with multiple geo-distributed data centers, while existing work often focuses on a single cloud site; 3, existing techniques used to handle online problems in the cloud do not directly apply in our study, due to the unique structure of our data transfer problem.
III. THEDATAMIGRATIONPROBLEM A. System Model
We consider a cloud consisting of K geo-distributed data centers in a set of regions K, where K = |K|. A cloud user (e.g., a global astronomical telescope application) con-tinuously produces large volumes of data at a set D of multiple geographic locations (e.g., dispersed telescope sites). The user connects to the data centers from different data generation locations via virtual private networks (VPNs), with
GVPN gateways at the user side andK VPN gateways each collocated with a data center. Let G denote the set of VPN gateways at the user side, with G = |G|. An illustration of the system is in Fig. 1. A private (the user’s) network inter-connects the data generation locations and the VPN gateways at the user side. Such a model reflects typical connection approaches between users and public clouds (e.g., AWS Di-rect Connect [22], Windows Azure Virtual Network [23]), where dedicated, private network connections are established between a user’s premise and the cloud, for enhanced security and reliability, and guaranteed inter-connection bandwidth.
Inter-data centre connections within a cloud are usually dedicated high-bandwidth lines [24]. Within the user’s private network, the data transmission bandwidth between a data generation location d ∈ D and a VPN gateway g ∈ G is large as well. The bandwidthUgi on a VPN link(g, i)from user side gatewaygto data centeriis limited, and constitutes the bottleneck in the system.
Legend Data Location 1 Data Location 2 DC 1 DC 2 DC 3 DC 4 Gateways at
the user side
Gateways at the
data center side Intranet links in cloud Internet links
Intranet links at the user side
GW2' GW1' GW1 GW2 GW3 GW4 GW3' GW4' Fig. 1. An illustration of the cloud system.
B. Cost-minimizing Data Migration: Problem Formulation
Assume the system executes in a time-slotted fashion [15], [18], [19], with slot lengthτ.Fd(t)bytes of data are produced at locationdin slott, for upload to the cloud.ldgis the latency between data location d∈ D and user side gatewayg ∈ G,
pgi is the delay along VPN link(g, i), andηik is the latency between data centers i and k. These delays, which can be obtained by a simple command such asping, are dictated by the respective geographic distances.
A cloud user needs to decide (i) via which VPN connections to upload its data to the cloud, and (ii) to which data center to aggregate data, for processing by a MapReduce-like framework, such that the monetary charges incurred, as well as the latency for the data to reach the aggregation point, are jointly minimized. The total costCto be minimized has four components: bandwidth cost, aggregate storage and computing cost, migration cost, and routing cost.
Decision variables. Two types of optimization variables are formulated:
(1) Data routing variable xd,g,i,k(t),∀d ∈ D,∀g ∈ G,∀i ∈ K,∀k ∈ K, denotes the portion of data Fd(t) produced at location d in t, to be uploaded through VPN connection (g, i) and then migrated to data center k for processing.
xd,g,i,k(t) > 0 indicates that the data routing path d →
g → i → k is employed, and xd,g,i,k = 0 otherwise. Let
x= (xd,g,i,k(t))∀d∈D,∀g∈G,∀i∈K,∀k∈K, the set of feasible data routing variables are:
X =
x(t)|
g∈G,i∈K,k∈K
xd,g,i,k(t) = 1 andxd,g,i,k∈[0,1], ∀d∈ D,∀g∈ G,∀i∈ K,∀k∈ K
. (1) Here g∈G,i∈K,k∈Kxd,g,i,k(t) = 1 ensures that all data produced from location dare uploaded into the cloud int. (2) Binary variable yk(t), ∀k ∈ K, indicates whether data center kis target of data aggregation in time slot t (yk(t) = 1) or not (yk(t) = 0). Following the practical requirement of the current MapReduce framework, we require that at any given time, exactly one data center is chosen. Let y(t) =
(yk(t))∀k∈K, the set of possible data aggregation variables are: Y= y(t)| k∈K yk(t)=1andyk(t)∈ {0,1},∀k∈ K . (2)
Costs.The costs incurred in time slott, for uploading the data into the cloud and for processing the data at the selected data center, include the following components.
(1) The overall bandwidth cost for uploading data via the VPN connections, where
d∈D,k∈KFd(t)xd,g,i,k(t)is the amount
uploaded via (g, i), andfgi is the charge for uploading one byte of data via (g, i), derived from bandwidth prices set by the cloud provider:
CBW(x(t)) g∈G,i∈K (fgi d∈D,k∈K Fd(t)xd,g,i,k(t)). (3) (2) Storage and computation costs are important factors to consider in choosing the data aggregation point. In a large-scale online application, processing and analyzing in t may involve data produced not only in t, but also from the past, in the form of raw data or intermediate processing results. For example, data analytics in social networks may re-run the data parsing flow when new data arrives, together using the new data and old data (or previous parsing re-sults of the old data) [25]. Without loss of generality, let the amount of current and history data to process in t be F(t) = tν=1(αν
d∈DFd(ν)), where
d∈DFd(ν) is the total amount of data produced in time slot ν from different data generation locations, and weightαν ∈[0,1]is smaller for older timesν andαt= 1for the current timet. The value of
αν is determined by specific applications and can be obtained through statistical data. Assume all the other historical data, except those inF(t), are removed from the data centers where they were processed, since all needed information has been stored in the retained data. LetΨk(F(t))be a non-decreasing cost function for storage and computation in data centerkin
t (e.g., Ψk(F(t)) = skF(t) +vkF(t), if sk andvk are the per-byte per-time-slot costs for storing and processing in data center k, respectively. The value of sk is determined by the cloud provider and the value ofvk depends on both the cloud provider and the specific application). The aggregate storage and computing cost incurred in the cloud int is:
CDC(y(t))
k∈K
(3) The best data center for data aggregation can differ in t
than in t−1, due to temporal and spatial variations in data generation. Historical data needed for processing together with new data int, at the amount oft−1
ν=1(αν
d∈DFd(ν)), should be moved from the earlier data center to the current, and a
migration cost is incurred. Let φik(z)be the non-decreasing migration cost to move z bytes of data from data centeri to date centerk, satisfying triangle inequality:φik(z) +φkj(z)≥ φij(z). φik(z) corresponds to upload/download bandwidth charges for moving data out of/into a data center, and/or the delay between the two data centers based on geographic distance. The migration cost betweent−1 andtis:
CM Gt (y(t), y(t−1)) i∈K k∈K ([yi(t−1)−yi(t)]+ [yk(t)−yk(t−1)]+φik( t−1 ν=1 αν d∈D Fd(ν))). (5)
Here [a−b]+= max{a−b,0}. Since only one data center is selected for data processing in each time slot, there is at most one non-zero term in the above summation, corresponding to data centersifort−1andk(k=i) fort,[yi(t−1)−yi(t)]+= 1 = [yk(t)−yk(t−1)]+= 1.
(4) The latency incurred for data upload is an important performance measure, to be minimized in the data routing and aggregation process. Targeting both monetary cost mini-mization and delay minimini-mization, we formulate arouting cost
for delays along the selected routing paths, and combine it with other costs to be the optimization objective. The overall routing cost in the system in t is:
CRT(x(t))
d,g,i,k
Lxd,g,i,k(t)Fd(t)(ldg+pgi+ηik), (6) where xd,g,i,k(t)Fd(t)(ldg+pgi+ηik) is the product of data volume and delay along the routing pathd→g→i→k. The weighted formula suggests that transferring a large volume of data via a high latency path causes high cost. L is the routing cost weight convertingxd,g,i,k(t)Fd(t)(ldg+pgi+ηik) into a monetary cost, reflecting how latency-sensitive the user is. A cloud user specifies L as a constant a priori. Latency
ldg+pgi+ηik is fixed in each slot but can change over time. In summary, the overall cost incurred in tin the system is:
C(x(t), y(t)) =CBW(x(t)) +CDC(y(t))+
CM Gt (y(t), y(t−1)) +CRT(x(t)). (7)
The offline optimization problemof minimizing the overall cost of data upload and processing over a time interval[1, T]
can be formulated as: minimize T t=1 C(x(t), y(t)) (8) subject to: ∀t= 1, . . . , T, (8a) x(t)∈ X, (8b) d∈K,k∈KFd(t)xd,g,i,k(t)/τ ≤Ugi,∀i∈ K,∀g∈ G, (8c) xd,g,i,k(t)≤yk(t),∀d∈ D,∀g∈ G,∀i∈ K,∀k∈ K, (8d) y(t)∈ Y,
whereC(x(t), y(t)),X, andY are given in Eqn. (7), (1) and (2), respectively. Constraint (8b)states that the total amount
Time (t)
...
...
ܹሺ ݐǡ ݕԦ ሺݐ ሻሻ ܹሺݐ െ ͳǡ ݕԦͳሻ ܹሺݐ െ ͳǡ ݕԦʹሻ ܹሺݐǡ ݕԦʹሻ ܹሺݐǡ ݕԦͳሻ ܹሺݐ െ ͳǡ ݕԦܭሻ ܹሺݐǡ ݕԦܭሻFig. 2. An illustration of the offline dynamic programming algorithm.
of data routed via(g, i)into the cloud in each time slot should not exceed the upload capacity of (g, i). (8c) ensures that a routing pathd→g→i→kis used (xd,g,i,k(t)>0), only if data centerkis the point of data aggregation int (yk(t) = 1).
AnOnline Algorithmtakes input gradually as they become available, and computes output on the fly. An Offline Al-gorithm is given complete information into the future, and generates a solution once in its entirety [26]. Competitive ratiois widely accepted to measure the performance of online algorithms. A deterministic minimizing online algorithm A
is α-competitive iff ∀I, A(I) ≤ α· O(I), where I is a given sequence of input, A(I) is the total cost to complete
I by A, O(I) denotes the cost to serve I by the optimal offline algorithm. Similarly, a randomized minimizing online algorithmA isα-competitiveiff∀I,E(A(I))≤α·O(I).
IV. ANOPTIMALOFFLINEALGORITHM
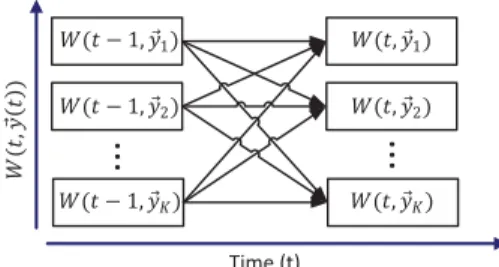
We first present an offline algorithm, which derives the the-oretical minimum cost given complete knowledge of data gen-eration in both temporal and spatial domains. The offline al-gorithm solves (8) by computing the optimal data routing and aggregation decisions, x∗(t) and y∗(t), t = 1, . . . , T, using dynamic programming. We construct a 2-D table W(t, y(t))
that denotes the minimum cost (Eqn. (7)) incurred to upload and process the data Fd(1), Fd(2), ..., Fd(t),∀d ∈ D, into the cloud, while ending with a specificy(t)∈ Y as the data aggregation decision at timet. Consider set Y defined in (2), which in fact has exactly K elements, corresponding to K
possible data aggregation decisions at any time t. Each data aggregation decision corresponds to selecting exactly one of the K data centers for data processing. Let vectoryi denote the decision in which data centeri is chosen, withyi(t) = 1 and yj(t) = 0,∀j = i. Hence Y = {y1, y2, . . . , yK}. The tableW(t, y(t))hasKrows corresponding toKpossible data aggregation decisions in Y, andT columns corresponding to
t= 1, . . . , T, (Fig. 2).
The algorithm begins with W(0, y(0))=0, ∀y(0)∈Y, and computes the entries inductively:
W(t, y(t)) = min y∈ Y, x(t): (8a)-(8c) W(t−1, y)+C(x(t), y(t)) . (9) Given y(t)(data aggregation decision int),W(t, y(t)) com-putes the minimum cumulative cost from time slot 1 up to
t, by choosing among all possible data aggregation decisions
y∈ Y int−1, and all feasible data routing decisionsx(t)in
t. The term W(t−1, y) is the minimum cumulative cost in [1, t−1]with the specific y as the data aggregation decision
Algorithm 1 The Optimal Offline Algorithm 1: t= 1; 2: Initialize:∀y(0)∈ Y, W(0, y(0)) = 0; 3: whilet≤T do 4: for ally(t)∈ Y do 5: for ally∈ Y do 6: Findx(t)∈ X to minimize: 7: W(t−1, y) +C(x(t), y(t))subject to(8a)−(8c);
8: Find the minimum value among the above computation results, store it asW(t, y(t))and record the decision path;
9: t=t+ 1;
10: Find min y(T)∈YW
(T, y(T))as the optimal value of (8);
11: y∗(T) = arg min
y(T)∈YW(T, y(T));
12: Trace back the optimal decision path from W(T, y∗(T)) to
W(0, y(0)), to derive the complete optimal solutions to the offline optimization problem (8).
att−1; the termC(x(t), y(t)), computed by Eqn. (7), is the cost incurred in time slott. Herey is related toC(x(t), y(t)), since it decides the potential migration cost CM G(y(t), y) in C(x(t), y(t)). If we cannot find a feasible solution to the minimization problem in (9), we setW(t, y(t)) = +∞.
The rationale of the dynamic programming approach (Alg. 1) is as follows. At each timet, fixing the choice of the data center used for data processing, we trace back and examine each of the K possible data center choices in time t −1, by adding the cost incurred in t to the minimum cumulative cost up to t−1; that is, we compute the cumulative costs up tot inKcases, that the historical data are migrated from different data center j ∈ K in t−1 to i in t, supposing data center i is selected in t. We then decide the minimum cumulative cost up to time t, via the best data center j in
t−1. Eventually when the table is completed, the minimum overall cost of the system in[1, T],i.e., the optimal objective function value of the offline optimization problem in (8), is given by min
y(T)∈YW(T , y(T)). The optimal data aggregation decision in time slot T is y∗(T) = arg min
y(T)∈Y
W(T , y(T)), and the optimal data routing decisionx∗(T)is the one leading toW(T , y∗(T))by solving (9). The optimal data routing and aggregation decisions in previous time slots can be derived accordingly, by tracing the optimal decision path in the table.
Theorem 1. Alg. 1 has a worst-case computation complexity of O(T γD3G3K8/ln(DGK2)), where γ is the number of bits required to represent the following linear program:
min
x(t)C(x(t), y(t)) =CBW(x(t)) +CRT(x(t)) (10) subject to: constraints(8a),(8b),(8c).
Proof sketch: To compute each W(t, y(t)) using (9), we can loop through the K possible values ofy ∈ Y, and when
y is fixed, the minimization problem reduces to the linear program in (10). For a linear program, efficient polynomial-time algorithms exist, with the current best worst-case com-plexity of O([n3/lnn]γ) by an interior-point method, where
n is the number of variables and γ is the number of bits required to represent the linear program [27], related to the numbers of variables and constraints and the number of bits
it takes to represent a constant in the LP. There are DGK2
variables, xd,g,i,k(t)’s, in this problem, leading to complex-ityO(γD3G3K6/ln(DGK2)). Therefore, the complexity to compute eachW(t, y(t))isO(K·γD3G3K6/ln(DGK2)) = O(γD3G3K7/ln(DGK2)). There are KT entries in the table, and hence the overall computation complexity of the op-timal offline algorithm is O(T γD3G3K8/ln(DGK2)).
V. TWOONLINEALGORITHMS A. The Online Lazy Migration (OLM) Algorithm
The offline optimization problem in (8) can be divided into
T one-shot optimization problems:
minimizeC(x(t), y(t)) subject to:(8a)(8b)(8c)(8d). (11) A straightforward algorithm solves the above optimization in each time slot, based on y(t−1) in the previous time slot. This can be far from optimal due to premature data migration. For example, assume data centerkwas selected att−1, and migrating data fromktojis cost-optimal attaccording to the one-shot optimization (e.g., because more data are generated in regionjint); the offline optimum may indicate to keep all data in k at t, if the volume of data generated in k int+ 1
surges. We next explore dependencies among the selection of the aggregation data center across consecutive time slots, and design a more judicious online algorithm accordingly.
We divide the overall cost C(x(t), y(t)) incurred in t into two parts: (i) migration cost Ct
M G(y(t), y(t−1)) defined in (5), related to decisions int−1; (ii) non-migration cost that relies only on current information att:
C−tM G(x(t), y(t)) =CBW(x(t)) +CDC(y(t)) +CRT(x(t)). (12) We design alazy migrationalgorithm (Alg. 2), whose basic idea is to postpone data center switching even if the one-shot optimum indicates so, until the cumulative non-migration cost (inC−tM G(x(t), y(t))) has significantly exceeded the potential data migration cost.
At the beginning (t=1), we solve the one-shot optimization in (11), and upload data via the derived optimal routesx(1)
to the optimal aggregation data center indicted by y(1). Let ˆ
t be the time of the data center switch. In each following time slot t, we compute the overall non-migration cost in [ˆt, t − 1], tν−1=ˆtC−νM G(x(ν), y(ν)). The algorithm checks whether this cost is at least β2 times the migration cost
CM Gˆt (y(ˆt), y(ˆt−1)). If so, it solves the one-shot optimization to derivex(t)andy(t)without considering the migration cost,
i.e., by minimizingC−tM G(x(t), y(t))subject to (8a)−(8d)
and an additional constraint, that the potential migration cost,
Ct
M G(y(t), y(t −1)), is no larger than β1 times the non-migration cost Ct
−M G(x(t), y(t)) at time t (to make sure that the migration cost is not too excessive). If a change of migration data center is indicated (y(t) = y(t−1)), the algorithm accepts the new aggregation decision, and migrates data accordingly. In all other cases, the aggregation data center remains unchanged fromt−1, while optimal data routing paths are computed given this aggregation decision, for upload of new data generated int.
Algorithm 2 The Online Lazy Migration (OLM) Algorithm 1: t= 1;
2: ˆt= 1; //Time slot when the last change of aggregation data center happens
3: Compute data routing decision x(1) and aggregation decision
y(1)by minimizingC(x(1), y(1))subject to(8a)−(8d); 4: ComputeCM G1 (y(1), y(0))andC−1M G(x(1), y(1)); 5: whilet≤T do 6: ifCM Gˆt (y(ˆt), y(ˆt−1))≤β12 t−1 ν=ˆtC ν −M G(x(ν), y(ν))then 7: Derivex(t)andy(t)by minimizingCt
−M G(x(t), y(t))in
(12) subject to(8a)−(8d)and constraintCt
M G(y(t), y(t−1))≤ β1C−tM G(x(t), y(t));
8: ify(t)=y(t−1)then
9: Use the new aggregation data center indicated byy(t);
10: ˆt=t;
11: ift < tˆ then//not to use new aggregation data center
12: y(t) =y(t−1), compute data routing decisionx(t)by solving (10)if not derived;
13: t=t+ 1;
Alg. 2 avoids aggressive switches of the aggregation data center, to prevent moving a large amount of data back and forth too often. Excessive “laziness” is also avoided. Pa-rameters β2 > 0 and β1 > 0 control the “laziness” and “aggressiveness” of the algorithm: a large β2 prolongs the inter-switch interval, while a large β1 invites more frequent switches.
Lemma 1. The overall migration cost in [1, t] is at most max{β1,1/β2} times the overall non-migration cost in this period, i.e., tν=1Cν
M G(y(ν), y(ν − 1)) ≤ max{β1,1/β2}tν=1Cν
−M G(x(ν), y(ν)).
Proof sketch: Potential migration cost in t is at most β1
times the non-migration costs. For migration cost incurred in previous time slots,i.e.,Cˆti
M G(x(ˆti), y(ˆti))whereˆti is the time of aggregation data center switch, ∀i = 1,2,· · ·, the non-migration cost in the period from when this non-migration occurs to the time before the next migration,i.e., in [ˆti,ˆti+1−1], is at least β2times the migration cost. Hence we have
t ν=1 CM Gν (y(ν), y(ν−1)) ≤1/β2 t−1 ν=1 C−νM G(x(ν), y(ν)) +β1C t −M G(x(t), y(t)) ≤max{β1,1/β2} t ν=1 C−νM G(x(ν), y(ν)). (13)
Lemma 2. The overall non-migration cost in [1, t] is at most times the total offline-optimal cost, i.e.,
t ν=1C ν −M G(x(ν), y(ν))≤ t ν=1C(x∗(ν), y∗(ν)), where = max ν∈[1,T] maxy(ν)∈Y,x(ν):(8a)−(8c)C−νM G(x(ν), y(ν)) miny(ν)∈Y,x(ν):(8a)−(8c)C−νM G(x(ν), y(ν))
is the maximum ratio of the largest over the smallest possible non-migration cost incurred in a time slot, with different data upload and aggregation decisions.
Proof sketch: By the definition of , at ν ∈ [1, t], the
non-migration cost of OLM is smaller than times the non-migration cost incurred by the optimal offline algorithm,i.e.,
Cν −M G(x(ν), y(ν))≤C−νM G(x∗(ν), y∗(ν)). We have t ν=1 C−νM G(x(ν), y(ν)) ≤ t ν=1 C−νM G(x∗(ν), y∗(ν)) ≤ t ν=1 C−νM G(x∗(ν), y∗(ν)) +CM Gν (y∗(ν), y∗(ν−1)) = t ν=1 C(x∗(ν), y∗(ν)). (14)
Theorem 2. The OLM Algorithm is (1 + max{β1,1/β2}) -competitive.
Proof Sketch: The overall cost incurred by the OLM Algorithm in [1, T] is Tν=1[Cν
M G(y(ν), y(ν − 1)) +
Cν
−M G(x(ν), y(ν))]. By Lemma 1 and Lemma 2: T ν=1 [CM Gν (y(ν), y(ν−1)) +C−νM G(x(ν), y(ν))] ≤(1 + max{β1,1/β2}) T ν=1 C−νM G(x(ν), y(ν)) ≤(1 + max{β1,1/β2}) T ν=1 C(x∗(ν), y∗(ν)).
The value of is mainly determined by data generation patterns over time, and less involved with the system size,
e.g., the number of data centers. In our experiments with a typical data generation pattern, = 1.7. In this case, setting β1 = 0.5 and β2 = 2 leads to a competitive ratio of2.55. The competitive ratio is theworst-caseperformance of the algorithm [26], assuming an adversary who knows the algorithm and chooses the ‘worst’ input over time. Simulations in Sec. VI reveals much better performance in practice.
Theorem 3. The OLM Algorithm has a computational com-plexity ofO(T γD3G3K7/ln(DGK2)).
Proof Sketch: The worst case of the OLM algorithm occurs when data routing and aggregation decisions need to be derived according to line 7 in Algorithm 2 in each time slot, which is the most time-consuming step in the algorithm. The computation in line 7 can be decom-posed into two steps: 1) to minimize Ct
−M G(x(t), y(t)) in (12) subject to (8a) − (8d); 2) to verify constraint
Ct
M G(y(t), y(t−1))≤β1C−tM G(x(t), y(t)). The first step re-quires solving a linear program, with computation complexity of O(γD3G3K6/ln(DGK2)); to complete the second step, it loops through the K possible data aggregation decisions. Therefore the OLM algorithm has a worst-case computation complexity of:
ǤǤǤ
ǤǤǤ
ǤǤǤ
ܨܪܥሺʹሻǣ ܨܪܥሺ͵ሻǣ ܨܪܥሺͳሻǣ Time ሾͳǡͳ ݈ሿ ሾʹ ݈ǡ ʹ ʹ݈ሿ ሾʹǡʹ ݈ሿ ሾͳǡͳሿ ሾ͵ ݈ǡ ͵ ʹ݈ሿ ሾ͵ǡ͵ ݈ሿ ሾͳǡʹሿFig. 3. An illustration of different FHC algorithms withl= 2.
O(T·γD3G3K6/ln(DGK2)·K)
=O(T γD3G3K7/ln(DGK2)). (15)
The complexity in Theorem 3 is regarding the total running time from t = 1 to t = T. Considering that the OLM algorithm is an online algorithm producing partial results per time slot, we are more interested in the amortized per-slot complexity,which isO(γD3G3K7/ln(DGK2)).
B. The Randomized Fixed Horizon Control (RFHC) Algorithm
In practical applications, near-term future data generation patterns can often be estimated from history, e.g., using a Markov chain model or a time series forecasting model [28]. We next design an algorithm that exploits such predicted future information. Details in the prediction module is treated as a blackbox, is free to vary, and is not of primary concern in this work. We assume that the information in the lookahead window can be predicted precisely without error.
We divide time into equal-size frames of l+ 1 time slots each (l ≥ 0). In the first time slot t of each frame, assume information on data generation for the next l time slots, i.e.,
Fd(t), Fd(t+ 1), ..., Fd(t+l),∀d∈ D, are known. We solve the following cost minimization over time frame [t, t +l], given the data aggregation decision of y(t −1), to derive data routing decisions x(ν) and aggregation decisions y(ν), ∀ν=t, . . . , t+l, using Alg. 1 in Sec. IV:
minimize t+l
ν=t
C(x(ν), y(ν)), (16) subject to: constraints (8a)—(8d), forν =t, . . . , t+l. The method is essentially a fixed horizon control (FHC) algorithm, adapted from receding horizon control in the dy-namic resource allocation literature [21]. Allowing the first time frame to start from different initial timesp∈[1, l+1], we havel+1versions of the FHC algorithm (Fig. 3). In particular, for an algorithmF HC(p)starting from a specific time slotp, the above optimization is solved at times t = p, p+l+ 1,
p+ 2(l+ 1), . . ., for routing and aggregation decisions in the followingl+1time slots. For each specific algorithmF HC(p), an adversary can choose an input with a surge of data produced at the beginning of each time frame, leading to a high migra-tion cost. A randomized algorithm defeats such purposeful adversaries, by randomizing the starting times of the frames, achieving lower expected worst-case performance [26].
We design a Randomized Fixed Horizon Control (RFHC) algorithm (Alg. 3). At the beginning, the algorithm uniformly randomly chooses p ∈ [1, l + 1] as the start of the first
Algorithm 3The Randomized Fixed Horizon Control (RFHC) Algorithm
1: y(0) = 0;
2: p=rand(1, l+ 1); //A random integer within [1,l+1]
3: ifp= 1then
4: Derive x(1)· · ·x(p−1) and y(1)· · ·y(p−1) by solving (16) over the time window[1, p−1];
5: t=p;
6: whilet≤T do
7: if(t−p) mod (l+ 1) = 0then
8: Derive x(t),· · ·, x(t +l) and y(t),· · ·, y(t+ l) by solving (16) over the time frame[t, t+l];
9: t=t+ 1;
time frame ofl+ 1slots, i.e., it randomly picks one specific algorithmF HC(p)from thel+1FHC algorithms: att= 1, it solves (16) to decide the optimal data routing and aggregation strategies in the period of t = 1 to p−1 (p = 1); then at
t=p,p+l+ 1,p+ 2(l+ 1),. . ., it solves (16) for optimal strategies in the following l+ 1 time slots, respectively. An adversary, with no information onp, finds it hard to contrive specific inputs to degrade the performance of RFHC.
Lemma 3. The overall cost incurred byF HC(p)algorithm is upper-bounded by the offline-optimal cost plus the migration costs to move data from the aggregation data center computed by F HC(p)to that decided by Alg. 1, at the end of the time
frames. That is, lettingx(p)andy(p)be the solution derived by
the F HC(p) algorithm andΩ
p,t={ω|ω=p+k(l+ 1), k= 0,1, . . . , tl+1−p}, we have for anyt∈[1, T],
t ν=1 C(xp(ν), yp(ν)) ≤ t ν=1 C(x∗(ν), y∗(ν)) + ω∈Ωp,t CM Gω (y∗(ω−1), y(p)(ω−1)).
Proof sketch:F HC(p)solves (16) for locally-optimal rout-ing and aggregation decisions in the time frame[ω, ω+l]. Total cost incurred byF HC(p) in[ω, ω+l]is at most that of any strategy with the same initial aggregation decisiony(p)(ω−1). Hence, the total cost incurred byF HC(p)in[ω, ω+l]should be smaller than that of the following strategy: we first migrate the data from the data center specified byy(p)(ω−1) to that specified by y∗(ω −1), and then operate data routing and aggregation in[ω, ω+l]following the offline optimum solution in this time frame. We have
t ν=1 C(xp(ν), yp(ν)) = ω∈Ωp,t ω+l ν=ω C−νM G(x(p)(ν), y(p)(ν)) +CM Gν (y(p)(ν), y(p)(ν−1)) ≤ ω∈Ωp,t ω+l ν=ω C−νM G(x∗(ν), y∗(ν)) +CM Gν (y∗(ν), y∗(ν−1)) +CM Gω (y∗(ω−1), y(p)(ω−1)) = t ν=1 C(x∗(ν), y∗(ν)) + ω∈Ωp,t CM Gω (y∗(ω−1), y(p)(ω−1)).
Theorem 4. The RFHC algorithm is (1+l+11 κλ)-competitive, where κ = supt∈[1,T],y1(t),y2(t)∈Y
Ct
M G(y1(t),y2(t))
t−1
ν=1(ανd∈DFd(ν)) is
the maximum migration cost per unit data, and λ =
inft∈[1,T],x(t),y(t):(8a)−(8d) C( x(t),y(t)) t−1 ν=1(ανd∈DFd(ν)) is the mini-mum total cost per unit data per time slot.
Proof sketch:LetCF HC(p) =Tν=1C(xp(ν), yp(ν))be the
overall cost incurred by an F HC(p)algorithm, andCOP T =
T
ν=1C(x∗(ν), y∗(ν))be the offline-optimal cost achieved by Alg. 1. The expected cost of the RFHC algorithm is
E(RF HC) = 1 l+ 1 l+1 p=1 CF HC(p) ≤ 1 l+ 1 l+1 p=1 COP T + ω∈Ωp,t CM Gω (y∗(ω−1), y(p)(ω−1)) =COP T+ 1 l+ 1 l+1 p=1 ω∈Ωp,t CM Gω (y∗(ω−1), y(p)(ω−1)).
The ratio of the above second term overCOP T is:
l+1 p=1 ω∈Ωp,tCM Gω (y∗(ω−1), y(p)(ω−1)) COP T = T ν=1CM Gν (y∗(ν−1), y(p)(ν−1)) T ν=1C(x∗(ν), y∗(ν)) ≤ κ λ.
Therefore, we conclude that: E(CRF HC)
OP T ≤1 +
1
l+1 κ λ. Theorem 4 reveals that the more future steps predicted (the larger l is), the closer the RFHC algorithm can approach the offline optimal algorithm. Values of κ andλ are related to system input including prices and delays, and are less involved with the data generation patterns and the number of data centers. In our experiments, κλ ≈0.69, and even with
l= 1, the competitive ratio is already as low as1.34. We also conducted experiments with imperfect predictions. Results
show that the performance remains good when accuracy is above 80%. When l = 0, whether the RFHC algorithm or the lazy migration algorithm performs better depends on the system input. We will evaluate their performance through experiments in the next section.
Theorem 5. The RFHC algorithm has a worst-case compu-tation complexity of
O(T γD3G3K7/ln(DGK2)) if l= 0 O(T γD3G3K8/ln(DGK2)) if l >0, Proof sketch:
Case 1: l = 0 (no lookahead). In this case, at time slot t, the algorithm needs to go through theKpossible aggregation decisions ofy∈ Y to derive the one-shot optimum. For each
y, the linear program in (10) is solved, with a computation complexity ofO(γD3G3K6/ln(DGK2)). Hence, the RFHC algorithm has a worst-case computation complexity of
O(T·γD3G3K6/ln(DGK2)·K)
=O(T γD3G3K7/ln(DGK2)). (17)
Case 2:l >0. The algorithm computes the optimum of the data migration problem over the equal-size frames using the method introduced in Sec. IV. According to Theorem 1, the worst-case computation complexity of the RFHC algorithm in the first frame is O((p−1)γD3G3K8/ln(DGK2)), and
O((l+ 1)γD3G3K8/ln(DGK2))for each of the frames (of
l + 1 slots) afterwards. Hence, the RFHC algorithm has a worst-case computation complexity of
O( T −p l+ 1 ·(l+ 1)γD 3G3K8/ln(DGK2)) +O((p−1)γD3G3K8/ln(DGK2)) =O(T γD3G3K8/ln(DGK2)). (18)
Theorem 5 shows the cumulative complexity from t = 1
to t = T. Since RFHC is an online algorithm producing partial results in each time frame, we are more interested in the amortized per time frame complexity:
O(γD3G3K7/ln(DGK2)) ifl= 0
O((l+ 1)γD3G3K8/ln(DGK2)) ifl >0, (19)
VI. PERFORMANCEEVALUATION A. Experiment Setup
Astronomical data processing usually involves Terabytes, Petabytes, or even Exabytes of data per day. Square Kilometre Array (SKA) is an international project to build the world’s largest telescope distributed in Australia, New Zealand and South Africa. It is expected to produce a few Exabytes of data per day [29]. Such astronomical data from geo-distributed telescopes is a natural target for our proposed algorithms.
We implement our offline and online algorithms on a cluster of 22 commodity computers (Intel(R) Pentium(R) D 3.0GHz with dual cores, 1G RAM). We emulate a cloud of 8 data centers in 8 regions (London, Bangalore, Hong Kong, Tokyo, San Francisco, Atlanta, Toronto and S˜ao Paulo), and a network of 8 observatories scattered in 8 time zones (Canary Islands, South Africa, Urumqi, Western Australia,
TABLE I
CONSTANT PRICES,P = 0.25,L= 0.01
Simple OLM RFHC(0) RFHC(1) Offline Overall cost ($) 20557 17264 18503 17237 16712
Ratio 1.23 1.03 1.11 1.03 1
New Zealand, Hawaii, Arizona, and Middle Chile), producing Gigabytes of astronomical data per night for upload into the cloud. There are 8 gateways collocated with the data centers and6user-side gateways in Paris, Beijing, Sydney, Los Angeles, New York and Rio de Janeiro, respectively. Each PC emulates one of user locations, user-side gateways and data centers. Networking instead of computation is our focus of emulation. Each PC can provide the ability to transfer a large amount of data via high-speed Ethernet. All 22 PCs are interconnected via a Dell PowerConnect 5548 Switch. An additional PC is employed to perform the central controller to control the routing schedule and the migration scheme within the cluster of 22 commodity computers. A typical cloud provider in practice usually has up to 8 data centers (e.g., Amazon EC2 consists of 8 data centers [30], Linode has 6 data centers [31] and DigitalOcean is operating 3 data centers [32].
Since detailed astronomical data are not publicly available, synthetic traces are generated to drive our experiments. We extract data generation patterns from a set of statistics on atmospheric visibility data collected at the Canarian obser-vatories, from Feb. 2000 to Aug. 2003 [33]. Based on the strong correlation between the visibility and the quality of astronomical images [34], we produce astronomical data for each of the 8 observatories following the extracted data generation pattern, but augment the volume to the Gigabyte scale. Fig. 4 depicts the data patterns for two observatories, each producing data between 9:00 p.m. to 5:00 a.m. in its local time.
Each time slot is set to one hour in our experiments. Link delays are set based on Round Trip Time (RTT) among the observatories, gateways and data centers, according to geographic distance:RT T(ms) = 0.02×Distance(km) + 5
[35]. Bandwidths on the VPN connections are randomly drawn within [68, 100] Mbps. The unit charges of uploading data via the VPN connections, fgi, are set within [0.10, 0.25] $/GB. The unit cost for storing and processing one GB of data,
sk and vk in data center k, are set within [0.01, 0.1] $/h and [0.45, 0.55] $/h respectively, following typical charges in Amazon EC2 and S3 [30], [36] respectively, with small value variations. The rationale behind such setting ofvkinclude: (i), TERAPIX [37], which is designed to handle large amounts of astronomical data, can process 320 GB data per night, using a cluster of 10 machines each configured with dual Athlon XP/MP 2400+ and 2 GB RAM; (ii), the measurement of EC2 instances [30]. From (i) and (ii) we estimate the unit cost for processing 1 GB data, and the algorithm will setup enough number of VMs to execute MapReduce according to the current data volume. The migration cost function, φik(z) is a linear function on the amount of data moved, z, with a cost in the range of [0.10, 0.25] $/GB. The default value of
L to convert delay to cost is 0.01.
TABLE II
CONSTANT PRICES,P = 0.25,L= 0.01, SCALE UP THE UNIT
COMPUTATION COST BY10
Simple OLM RFHC(0) RFHC(1) Offline Overall cost ($) 57827 52742 53653 52904 52370
Ratio 1.10 1.01 1.02 1.01 1
TABLE III
CONSTANT PRICES,P = 0.25,L= 0.01, SCALE DOWN THE UNIT
COMPUTATION COST BY10
Simple OLM RFHC(0) RFHC(1) Offline Overall cost ($) 16380 13844 14824 13737 13138
Ratio 1.25 1.05 1.13 1.03 1.05
At timet, data produced in[t−2, t]are used for processing,
i.e., αt = 1, αt−1 =αt−2 =P, and αt−2 =. . . =α1 = 0, whereP is a parameter adjusted to investigate the impact of the volume of historical data involved.
We compare the costs incurred by the offline and online algorithms, as well as a simple algorithm that fixes the aggregation data center to the one in Hong Kong (relatively central to all observatories with moderate data center prices), and only computes the data uploading paths in each hour based on (10), similar to that in Choi and Gupta [16]. Default parameter values for OLM are β1 = 0.5, β2 = 2. Default lookahead window size for RFHC isl= 1.
B. Constant Prices
We first evaluate the performance of the algorithms under the above default, fixed prices for data storage and processing in the data centers. In Tab. I, RF HC(x)represents a RFHC algorithm with lookahead windowl=x. As compared to the simple algorithm, all proposed algorithms achieve consider-able cost reduction, and performance of the OLM algorithm and the RFHC algorithm with l = 1 approach that of the offline optimum rather well. We also compare the performance between OLM and RFHC(0), which is in fact an algorithm to solve the one-shot optimization (11) in each time slot. Fig. 5 shows that RFHC(0) incurs higher costs, due to moving data back and forth, while OLM can prevent such costs.
We next scale the processing price by a factor of 10 and
1
10, respectively, with other settings unchanged. Tab.II and
Tab. III show that our online algorithms still outperform the simple algorithm, and demonstrate close-to-offline-optimum performance in both cases. This observation demonstrates the validity and effectiveness of OLM and RFHC.
C. Dynamic VM pricing
We next investigate dynamical VM prices (time-varying data processing costs) following the Spot Instance prices from Amazon EC2 during Apr. 2012 to Jul. 2012. From Tab. IV and Fig. 6, we see that due to lack of future price information, the OLM algorithm performs slightly worse than the RFHC algorithm with lookahead windowl= 1.
D. Different Sizes of Lookahead Window
We evaluate the RFHC algorithm with different lookahead window sizes, both with constant and with dynamic prices.
0 24 48 72 96 120 144 168 0 6 12 18 Time (hour) Data size(Gigabyte) Canary Islands Werstern Australia
Fig. 4. Astronomical data generating pattern: 9:00 p.m. GMT+12 is the timeline starting point.
0 24 48 72 96 120 144 168 −50 0 50 Time (hour) Cost Difference ($) OLM RFHC(0)
Fig. 5. Cost difference as compared to offline optimum: constant prices,
P= 0.25,L= 0.01. 0 24 48 72 96 120 144 168 −50 0 50 100 Time (hour) Cost Difference($) OLM RFHC(l)
Fig. 6. Cost difference as compared to offline optimum over time: Spot Instance pricing,P= 0.25,L= 0.01. 0 24 48 72 96 120 144 168 −100 0 100 200 Time (hour) Cost Difference($) OLM RFHC(l)
Fig. 7. Cost difference as compared to offline optimum over time: Spot Instance pricing,P= 0.5,L= 0.01.
TABLE IV
PERFORMANCE COMPARISON AMONG THE ALGORITHMS: SPOTINSTANCE
PRICING,P= 0.25,L= 0.01
Simple OLM RFHC(0) RFHC(1) Offline Overall cost ($) 24709 16870 16676 16327 15944
Ratio 1.55 1.06 1.05 1.02 1
TABLE V
PERFORMANCE OFRFHCALGORITHMS WITH DIFFERENT LOOKAHEAD
WINDOW SIZES:CONSTANT PRICES,P = 0.25,L= 0.01
RFHC(0) RFHC(1) RFHC(2) RFHC(3) Offline Overall
cost ($)
18503 17237 17050 16828 16712
Ratio 1.11 1.03 1.02 1.01 1
Tab. V and Tab. VI show that, with the increase of the lookahead window, the performance is approaching the offline optimum. Just a 1−2 step ‘peek’ into the future drives the performance very close to the offline optimum.
E. Different Routing Latency Ratios
We further study different routing latency ratios in Eqn. 6. Intuitively, a larger weight of routing cost make the system evaluate the upload performance more seriously, while a smaller weight means monetary cost minimization has higher priority. We compare the average latency for different weights of routing cost, and find that the latency decreases when the weight increases (Tab. VII). Here we set moderate L= 0.01
and lower weight L= 0.001respectively. Average latency is reduced with a largeL.
F. Involvement of Historical Data
We next investigate the impact of weights of earlier data, under dynamic spot instance pricing. As compared to Tab. IV
TABLE VI
PERFORMANCE OFRFHCALGORITHMS WITH DIFFERENT LOOKAHEAD
WINDOW SIZES: SPOTINSTANCE PRICING,P= 0.25,L= 0.01
RFHC(0) RFHC(1) RFHC(2) RFHC(3) Offline Overall cost ($) 16676 16327 16105 16138 15944 Ratio 1.05 1.02 1.01 1.01 1 TABLE VII
AVERAGELATENCY OF EACH ALGORITHM: SPOTINSTANCE PRICING,
P = 0.25
Algorithms Simple OLM RFHC(0) RFHC(1) Offline
Average L= 0.01 224.2 165.3 177.0 169.2 166.5 latency (ms) L= 0.001 232.2 202.5 219.6 218.7 216.6
and Fig. 6, the results in Tab. VIII and Fig. 7 are derived under the same settings except a largerP,i.e., more historical data are involved in the computation and migration in each time slot. We observe that the performance of our algorithms slightly degrades. This can be explained as follows: when more historical data are involved, the migration cost is larger, and a wrong aggregation decision may incur higher increase in the cost. The outlier at t = 50 in the curve of the OLM algorithm in Fig. 7 shows the cost of such a wrong decision.
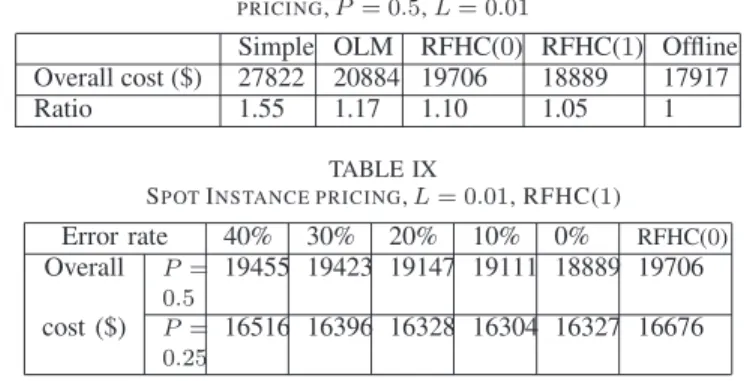
G. Impact of non-perfect prediction
In Sec. V we assumed 100% prediction accuracy. Next we investigate the impact of prediction errors by considering the following two configurations: (i), spot instance pricing, P =
0.5, L= 0.01; (ii), spot instance pricing,P = 0.25, L= 0.01. We generate the predicted input with error through adjusting the accurate input from the trace by corresponding percentiles. Considering a wide range of prediction error rates (40%, . . . ,
TABLE VIII
PERFORMANCE COMPARISON AMONG THE ALGORITHMS: SPOTINSTANCE
PRICING,P= 0.5,L= 0.01
Simple OLM RFHC(0) RFHC(1) Offline Overall cost ($) 27822 20884 19706 18889 17917
Ratio 1.55 1.17 1.10 1.05 1
TABLE IX
SPOTINSTANCE PRICING,L= 0.01, RFHC(1)
Error rate 40% 30% 20% 10% 0% RFHC(0) Overall P= 0.5 19455 19423 19147 19111 18889 19706 cost ($) P= 0.25 16516 16396 16328 16304 16327 16676
10%, 0%), we examine the performance of RFHC(1). As shown in Tab. IX, the RFHC algorithm performs better with lower prediction error rate. When the error rate is adequately low, the cost is very close to the one with 100% accurate prediction, sometimes even better,e.g., 10% in Tab. IX. That is possible because the aggregation decisions made by RFHC(1) with 100% accurate prediction are still myopic, maybe far from offline optimum. Small prediction error sometimes help the algorithm avoid shortsighted decisions. In addition, we ob-serve that even with 40% prediction error rate, the performance is still better than RFHC(0).
H. Execution time
Algorithm running times are recorded as follows — OLM: 4.55sper time slot; RFHC(0): 4.49sper time slot; RFHC(1): 9.91sper time frame. All algorithms finish within 10 seconds, which is small given the time slot length of1hour. RFHC(1) needs more time because the length of its time frame is 2 time slots. According to Eqn. 19, the running time of RFHC(1) is proportional to the length of time frame.The running time may be further reduced substantially through using power-ful computing servers, optimized C/C++ implementation and more efficient linear program solver,e.g.,glpk.
VII. CONCLUDINGREMARKS
This paper designs efficient algorithms for timely, cost-minimizing migration of geo-dispersed big data to the cloud, for processing using a MapReduce-like framework. A polynomial-time optimal offline algorithm is proposed based on dynamic programming. Two online algorithms are designed to practically guild data migration in an online fashion: the OLM algorithm achieves a worst-case competitive ratio as low as2.55under typical real-world settings; the RFHC algorithm provides a decreasing competitive ratio with an increasing size of the lookahead window.
REFERENCES [1] Rackspace, http://www.rackspace.com/.
[2] M. Armbrust, A. Fox, R. Grifth, A. D. Joseph, R. Katz, A. Konwinski, G. Lee, D. P. A. Rabkin, I. Stoica, and M. Zaharia, “Above the Clouds: A Berkeley View of Cloud Computing,” EECS, University of California, Berkeley, Tech. Rep., 2009.
[3] S. Pandey, L. Wu, S. Guru, and R. Buyya, “A Particle Swarm Opti-mization (PSO)-based Heuristic for Scheduling Workflow Applications in Cloud Computing Environment,” inProc. IEEE AINA, 2010. [4] Human Genome Project, http://www.ornl.gov/hgmis/home.shtml. [5] Hadoop — Facebook, http://www.facebook.com/note.php?note id=1612
1578919.
[6] Hadoop at Twitter, http://www.slideshare.net/kevinweil/hadoop-at-twitter-hadoop-summit-201.
[7] AWS Import/Export, http://aws.amazon.com/importexport/.
[8] E. E. Schadt, M. D. Linderman, J. Sorenson, L. Lee, and G. P. Nolan, “Computational Solutions to Large-scale Data Management and Analysis,”Nat Rev Genet, vol. 11, no. 9, pp. 647–657, 09 2010. [9] Moving an Elephant: Large Scale Hadoop Data Migration at Facebook,
http://www.facebook.com/notes/paul-yang/moving-an-elephant-large-scale-hadoop-data-migration-at-facebook/10150246275318920. [10] R. J. Brunner, S. G. Djorgovski, T. A. Prince, and A. S. Szalay,
“Handbook of Massive Data Sets,” J. Abello, P. M. Pardalos, and M. G. C. Resende, Eds. Norwell, MA, USA: Kluwer Academic Publishers, 2002, ch. Massive Datasets in Astronomy, pp. 931–979. [11] M. Cardosa, C. Wang, A. Nangia, A. Chandra, and J. Weissman,
“Exploring MapReduce Efficiency with Highly-Ditributed Data,” in Proc. ACM MapReduce, 2011.
[12] Amazon Elastic MapReduce, http://aws.amazon.com/elasticmapreduce/. [13] M. Hajjat, X. Sun, Y. E. Sung, D. Maltz, and S. Rao, “Cloudward Bound: Planning for Beneficial Migration of Enterprise Applications to the Cloud,” inProc. ACM SIGCOMM, August 2010.
[14] X. Cheng and J. Liu, “Load-Balanced Migration of Social Media to Content Clouds,” inProc. ACM NOSSDAV, June 2011.
[15] Y. Wu, C. Wu, B. Li, L. Zhang, Z. Li, and F. Lau, “Scaling Social Media Applications into Geo-Distributed Clouds,” inProc. IEEE INFOCOM, Mar. 2012.
[16] B. Cho and I. Gupta, “New Algorithms for Planning Bulk Transfer via Internet and Shipping Networks,” inProc. IEEE ICDCS, 2010. [17] B. Cho and I. Gupta, “Budget-Constrained Bulk Data Transfer via
Internet and Shipping Networks,” inProc. ACM ICAC, 2011. [18] M. Lin, A. Wierman, L. L. Andrew, and E. Thereska, “Dynamic
Right-sizing for Power-proportional Data Centers,” inProc. IEEE INFOCOM, April 2011.
[19] V. Mathew, R. Sitaraman, and P. Shenoy, “Energy-aware Load Balancing in Content Delivery Networks,” inProc. IEEE INFOCOM, Mar. 2012. [20] T. Lu and M. Chen, “Simple and Effective Dynamic Provisioning for
Power-Proportional Data Centers,” inProc. IEEE CISS, Mar. 2012. [21] M. Lin, Z. Liu, A. Wierman, and L. Andrew, “Online Algorithms for
Geographical Load Balancing,” inProc. IEEE IGCC, 2012. [22] AWS Direct Connect, http://aws.amazon.com/directconnect/.
[23] Windows Azure Virtual Network, http://www.windowsazure.com/en-us/home/features/networking/.
[24] GoGrid, http://www.gogrid.com/.
[25] D. Logothetis, C. Olston, B. Reed, K. C. Webb, and K. Yocum, “Stateful Bulk Processing for Incremental Analytics,” inProc. ACM SoCC, 2010. [26] A. Borodin and R. El-Yaniv, Online Computation and Competitive
Analysis. Cambridge University Press, 1998, vol. 2.
[27] K. M. Anstreicher, “Linear Programming in O([n3/lnn]L) Opera-tions,”SIAM Journal on Optimization, vol. 9, no. 4, pp. 803–812, 1999. [28] G. E. P. Box, G. M. Jenkins, and G. C. Reinsel,Time Series Analysis:
Forecasting and Control, 4th ed. Wiley, 2008. [29] Square Kilometre Array, http://www.skatelescope.org/. [30] Amazon Elastic Compute Cloud, http://aws.amazon.com/ec2/. [31] Linode, https://www.linode.com/speedtest/.
[32] DigitalOcean, https://www.digitalocean.com/.
[33] Sky Quality Group, The Instituto de Astrof´ısica de Canarias (IAC), http://www.iac.es/proyecto/site-testing/index.php.
[34] H. V. Rami´o, C. M. noz Tu˜n´on, A. M. Varela, and J. J. Fuensalida, “Complementary note: DIMM (ELT-DS) calibration,” The Instituto de Astrof´ısica de Canarias (IAC), Tech. Rep., 2008.
[35] A. Qureshi, “Power-Demand Routing in Massive Geo-Distributed Sys-tems,”PhD Thesis submitted to MIT, 2010.
[36] Amazon Simple Storage Service, http://aws.amazon.com/s3/. [37] TERAPIX, http://terapix.iap.fr/.