CS-TR-3782
UMIACS-TR-97-38
The Riskit Method for Software Risk Management, version 1.00
Jyrki Kontio
Institute for Advanced Computer Studies and Department of Computer Science
University of Maryland A.V. Williams Building College Park, MD 20742, U.S.A.
Emails: [email protected] [email protected]
Version 1.00 Status: Final
Abstract:
This paper presents the Riskit method for software engineering risk management. This document contains the motivation for the method, description of the Riskit analysis graph and a detailed description of the Riskit process.
Table of Contents
1. Introduction ...4
2. Acknowledgments ...4
3. Terminology...5
4. Motivation for Risk Management...6
5. Decomposing Risk: The Riskit Analysis Graph ...9
6. Risk Management Process ...14
6.1 Risk Management Mandate Definition ...17
6.2 Goal review ...19
6.3 Risk Identification...22
6.4 Risk Analysis ...23
6.4.1 Risks Item Clustering ...24
6.4.2 Risk Scenario Development ...25
6.4.3 Risk Prioritization ...29
6.5 Risk Control Planning ...32
6.5.1 Defining Risk Controlling Action ...33
6.5.2 Selecting Risk Controlling Action ...37
6.6 Risk Control ...39
6.7 Risk Monitoring...40
7. Conclusions ...42
List of Figures
Figure 1: Definition of risk in the Riskit method...7
Figure 2: A conceptual view of the elements in the Riskit analysis graph ...9
Figure 3: The “normal Riskit analysis graph”...13
Figure 4: The “simple Riskit analysis graph”...13
Figure 5: Dataflow diagram symbols used...14
Figure 6: The Riskit risk management cycle...16
Figure 7: Riskit process artifact dependencies...17
Figure 8: Sub-processes in risk analysis process...24
Figure 9: Example of the Riskit analysis graph...26
Figure 10: Textual version of the Riskit analysis graph...27
Figure 11: Options for risk management decision making ...35
Figure 12: Risk controlling action urgency...39
List of Tables Table 1: Examples of risk elements...10
Table 2: Riskit analysis graph symbols ...12
Table 3: Process definition information template...14
Table 4: Process definition information for the whole Riskit process ...15
Table 5: Overview of outputs and exit criteria of the Riskit process ...17
Table 6: The process definition information for the risk management mandate definition process ...18
Table 7: Risk management mandate definition template and example ...19
Table 8: The process definition information for the goal review process...20
Table 9: Goal definition template...21
Table 10: An example of a stakeholder-goal priority table...21
Table 11: The process definition information for the risk identification process ...23
Table 12: The process definition information for the risk analysis process ...24
Table 13: The process definition information for the risk item clustering process ...25
Table 14: The process definition information for the risk scenario development process ...26
Table 15: Risk factor definition template ...28
Table 16: Risk event definition template ...28
Table 17: Risk outcome definition template ...28
Table 18: Risk reaction definition template ...28
Table 19: Risk Effect set definition template ...29
Table 20: The process definition information for the risk prioritization process ...29
Table 21: Risk scenario ranking table using Pareto-efficient sets ...32
Table 22: The process definition information for the risk control planning process ...33
Table 23: Supporting focus questions for Riskit element review...34
Table 24: The process definition information for the risk control process...40
1. Introduction
This paper presents the Riskit method for software engineering risk management. The main features of the method are its sound theoretical foundations and its focus on qualitative understanding of risks before their possible quantification. Furthermore, the Riskit method provides a defined process for conducting risk management. The method is supported by various techniques and guidelines and the use of Riskit does not preclude the use of other risk management approaches.
The Riskit method has been integrated into the Experience Factory framework [3,7,8]. However, the experience capture aspect of the method is not addressed in this report, readers interested in that aspect of the method are kindly asked to refer to other publications [29-31] or contact the author for more information or for more recent publications.
An earlier version of the Riskit method has been empirically evaluated in a limited number of case studies [19,30,31]. This current version of the method (version 1.00) has been improved based on the feedback received from several case studies or evaluations carried out in industry and government organizations.
This paper is organized as follows. Chapter 3 presents key terminology in one place, although all terms are introduced as they are used in the paper. Chapter 4 presents the motivation for developing the Riskit method and explains its underlying principles. In chapter 5 we introduce the Riskit analysis graph. Chapter 6 presents the Riskit process in detail. Chapter 7 presents summary and conclusions and discusses further development plans as well as validation issues.
2. Acknowledgments
This work was initiated when I was working at Nokia Research Center. Pertti Lounamaa thus gave me the initial opportunity to lay the groundwork and build up the knowledge that made the development of Riskit possible. Professor Victor R. Basili at University of Maryland has had the most influence in this work. During my “research sabbatical” in Maryland we had frequent interactions and he had a strong impact on not only on this work but on many other areas that I have been working on. I am grateful for his support, encouragement and guidance in developing this method.
Olli Pitkänen of Helsinki University of Technology has made his expertise and insights available and reviewed earlier versions of this paper. His detailed and thorough feedback helped correct many errors and omissions. Gerhard Getto of Daimler-Benz AG has been equally important in providing feedback to the method. Especially his experiences from having used the method in practice resulted in many improvements that made the method more practical. Dr. Carylon Seaman’s review of this report removed many ambiguities and improved internal consistency of this document.
I am grateful for all the help and contributions these individuals volunteered to this work. While I wrote this report, many advances in this report are the result of teamwork from the above individuals.
3. Terminology
We are using the following specific terms in this document:
• The term risk in its general meaning is defined as a possibility of loss, the loss itself, or any characteristic, object or action that is associated with that possibility.
• Risk element is defined as any item in the Riskit analysis graph (see section 5 for details):
• Risk factor is a known fact or characteristic that influences some risk event.
• Risk event is an occurrence of an incident with some negative consequences.
• Risk outcome is the resulting situation after the risk event but before any reactions have taken place.
• Reaction is a (set of) corrective action(s) that are taken after the risk has occurred.
• Risk effect is the combined impact of risk event and resulting reactions to goals of the project.
• Utility loss is the harm a stakeholder experiences on a set of risk effects in a situation.
• Risk scenario is a combination of risk elements that describe the causes, triggering events and the impact of a risk. Normally a scenario consists of a risk event, risk reaction and risk effect set.
• Riskit analysis graph is a graphical formalism used to document risk scenarios in the Riskit method.
• Risk item is defined as a risk that has not been analyzed and categorized into risk elements or described in the Riskit analysis graph.
• Risk cluster is a grouping of risk items.
• Risk controlling action is a proactive maneuver that is taken before risk occurs (or before it is known whether the risk has occurred).
• Stakeholder is a person or organization that has an interest in the project or its results.
• Goal is defined as a characteristic that the project or product should have. Goals in the Riskit method are categorized into objectives, drivers and constraints (see section 6.2, page 19).
When an item has been used and defined for the first time in the text, it has been written in italics.
4. Motivation for Risk Management
Software development is often plagued with unanticipated problems which cause projects to miss deadlines, exceed budgets, or deliver less than satisfactory products. While these problems cannot be eliminated totally, some of them can be controlled better by taking appropriate preventive action. Risk management is an area of project management that deals with these threats before they occur. Organizations may be able to avoid a large number of problems if they use systematic risk management procedures and techniques early in projects.
Several risk management approaches have been introduced during the past decade [11,13,14,25] and while some organizations, especially in the U.S. defense sector [11,18], have defined their own risk management approaches, most organizations do not manage their risks explicitly and systematically [38]. Risk management based on intuition and individual initiative alone is seldom effective and rarely consistent.
When risk management methods are used, they are often simplistic and users have little confidence in the results of their risk analysis results. We believe that the following factors contribute to the low usage of risk management methods in practice:
• Risk is an abstract and fuzzy concept and users lack the necessary tools to define risk more accurately for deeper analysis.
• Many current risk management methods are based on quantification of risks for analysis and users are rarely able to provide accurate enough estimates for probability and loss for the analysis results to be reliable. On the other hand, the table based approaches are often biased and too coarse for risk prioritization.
• Risks have different implications to different stakeholders. Few existing methods provide support for dealing with these different stakeholders and their expectations.
• Each risk may affect a project in more than one way. Most existing risk management approaches focus on cost, schedule or quality risks, yet their combinations or even other characteristics (such as future maintenance effort or company reputation) may be important factors that influence the real decision making process.
• Many current risk management methods are perceived as complex or too costly to use. A risk management method should be easy to use and require a limited amount of time to produce results, otherwise it will not be used.
Given the increasing interest in risk management in the industry, we believe that for risk management methods to be applied more widely, they will need to address the above issues. Furthermore, risk management methods should also provide comprehensive support for risk management in projects, they should provide practical guidelines for application, they should support communications between participants, and they should be credible.
The Riskit method was developed to address the issues listed above. Its main characteristics can be described by the following principles.
(1) The Riskit method provides precise and unambiguous definitions for risks.
The common definition of risks, either by dictionaries or every day usage, associate several different meanings to risk. It can refer to a possibility of loss [1], the actual loss that would result if the risk occurs [1], a factor or element that is associated with a threat [1], or a person that contributes to the possibility of loss [2]. The dictionary definitions for risk are so broad that it is fair to define risk as anything that is related to the possibility of loss. Clearly,
there is some value in having such a broad and encompassing concept to facilitate initial discussion about risk. However, we believe that this wide range of meanings associated to the word “risk” can also prevent adequate precision in more detailed analysis or risks unless this ambiguity is explicitly addressed and removed.
The Riskit method contains means to define risks more precisely and formally. When we use the term risk on its own, we are using it in its general meaning: risk is defined as a possibility of loss, the loss itself, or any characteristic, object or action that is associated with that possibility. As in most risk management approaches, we consider probability and loss the two main attributes of risk. However, our approach explicitly recognizes that the definition of loss depends on expectations, which in turn depend on stakeholders of the project. A loss is defined as an outcome that falls short of what was expected. As different stakeholders value outcomes differently, stakeholders influence the definition of loss in a project. This view is visualized in Figure 1.
Risk
Probability
Loss
is characterized by is characterized byExpectations
is valued byStakeholder
is defined byFigure 1: Definition of risk in the Riskit method
(2) The Riskit method results in explicit definition of objectives, constraints and other drivers that influence the project.
As we pointed out in Figure 1, risk is a relative concept; its definition depends on expectations that are associated with a situation. In order to analyze risks, it is necessary to formalize the expectations as well as possible. When expectations are recognized and defined, we refer to them as goals. While some goals cannot be stated precisely, at least they should be identified and documented as well as the information available allows. The Riskit method contains an explicit step and supporting templates to assist in the goal definition.
(3) The Riskit method is aimed at modeling and documenting risks qualitatively.
The Riskit method provides conceptual and graphical tools to model different aspects of risks qualitatively, instead of requiring quantitative estimation of risk probability and impact to take place early in the project. Given the difficulty of these estimations –and the often ambiguous interpretations of risks –the margins of error in risk quantification are easily high. By emphasizing the qualitative understanding of risks, there is a better basis for understanding and communicating about risk.
(4) The Riskit method can use both ratio and ordinal scale risk ranking information to prioritize risks reliably.
The estimation problem has been reduced in the Riskit approach. Instead of forcing the quantification of risks using ratio scale metrics –often an unrealistic goal –the Riskit method only attempts to accomplish the necessary quantification of risks for risk management to take place. For risk management purposes it may be enough to identify the biggest risks and propose action to control them, while the exact values of probability and loss may not be needed. The selection of the type of metrics to be used in risk analysis should be based on the objectives of the analysis and the availability of data about risks.
(5) The Riskit method uses the concept of utility loss to rank the loss associated with risk. Many current risk management approaches are based ranking of risks based on the loss they cause to some specific attributes of the project, such as cost, time delay, or quality metrics. Often a single metric is used. This can be detrimental for two reasons. First, the use of a single metric, or a small number of metrics, can create strong bias away from secondary, yet influential goals that should be considered. Second, research in economics and management science has strongly indicated that decision are made based on the changes in the expected utility (or utility loss) of alternatives. As the utility functions of stakeholders are likely to be non-linear, use of direct loss metrics can lead to wrong estimates and rankings of the risks. Therefore, the Riskit method uses the concept of utility loss to compare and rank losses of risks.
(6) Different stakeholder perspectives are explicitly modeled in the Riskit method.
All projects have more than one stakeholder that is interested in its results. They may have different priorities and levels of expectations. Risk management should be based on the recognition of these stakeholder expectations and priorities. Traditional, direct project metric based approaches cannot easily support the comparison of different stakeholder views and few risk management approaches attempt to address the issue. The Riskit method supports stakeholder views by documenting their expectations explicitly and evaluating the utility loss for each separately.
(7) The Riskit method has an operational definition and training support.
The Riskit method has an operational definition so that it can be applied easily and consistently. This, in fact, is the main contribution of this paper, this paper presents an operational definition of the Riskit process. There is also a Riskit tutorial available and an application guideline paper is being written.
We suggest that by adhering to the principles described above the Riskit method is a comprehensive, operational, theoretically sound and practical method for software risk management.
5. Decomposing Risk: The Riskit Analysis Graph
The Riskit analysis graph is a graphical formalism that is used to define the different aspects of risk more formally. The Riskit analysis graph can be seen both as a conceptual template for defining risks, as well as a well-defined graphical modeling formalism. In both cases, it can be used as a communication tool during risk management. The Riskit analysis graph has been developed based on the ideas presented by Rowe [27,39], but we have evolved Rowe’s notion of risk estimation steps into a well-defined, extended graphical formalism. In the following we will introduce the Riskit analysis graph first by a conceptual definition of its underlying elements, then by an operational definition of the graphical formalism that is used in practice to represent the underlying, conceptual model.
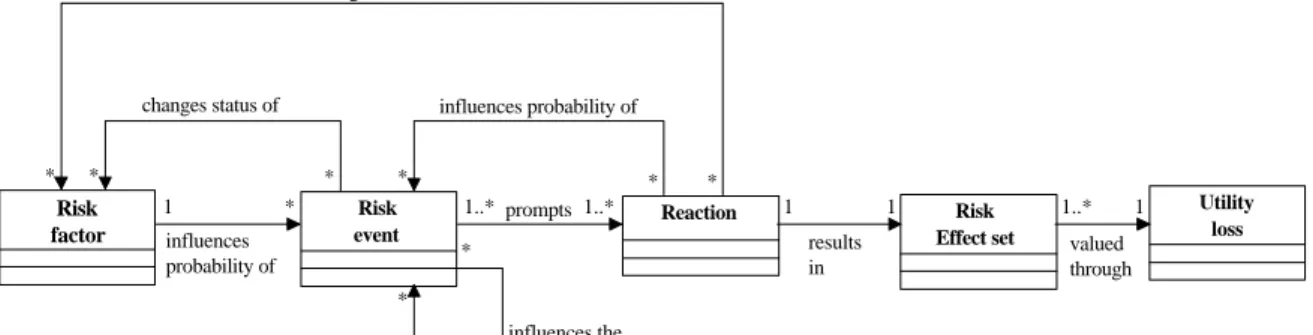
The underlying conceptual model –or meta-model –of the Riskit Analysis Graph components is presented in Figure 2, using the UML notation [37]. This meta-model represents the underlying, conceptual elements and their relationships. Each rectangle in the graph represents a risk element and each arrow describes the possible relationship between risk elements. The relationship arrow is read in the direction of the arrow. For example, the relationship between “risk factor” and “risk event” in Figure 2 should be read as “[a] risk factor influences [the] probability of [a] risk event”.
1 * 1..* 1 1..* 1..* * 1 1 1..* 1 * * * * * * * influences probability of results in valued through prompts results in changes status of
changes status of influences probability of
influences the probability of Risk factor Risk event Risk outcome Risk Effect set Utility loss Reaction
Figure 2: A conceptual view of the elements in the Riskit analysis graph
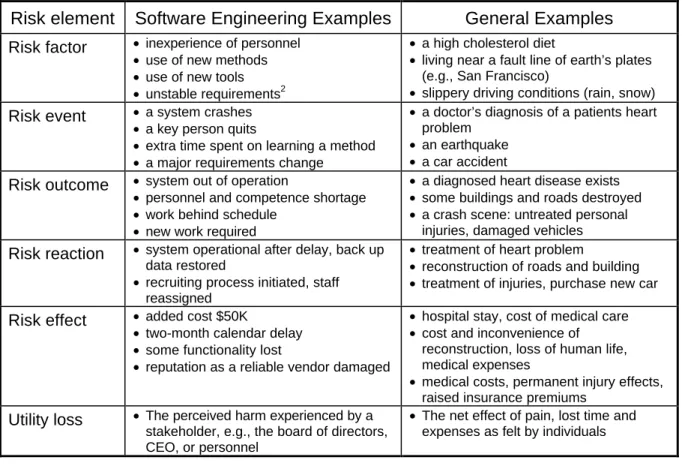
A risk factor is a characteristic that affects the probability of a negative event (i.e., risk event) occurring. A risk factor describes the characteristics of an environment. Consequently, in the Riskit analysis graph a risk factor does not have probability associated with it, it describes a relevant environment characteristic as it is or will be1. Examples of risk factors are listed in Table 1. Risk factors that are documented typically increase the probability of risks events occurring, but they may also reduce them, i.e., they are success factors for a project (e.g., “the development team recently developed a similar application”).
1
In practice it is possible that some risk factors are probabilistic, i.e., it is not known whether they are true for the environment or not. For instance, if new people are recruited for a project, it may be possible that a factor called “inexperienced personnel” becomes true. Such a situation is modeled by defining a risk event that influences a risk factor, i.e., risk event would be called “recruiting results in inexperienced personnel” and it would have a relationship to a factor called “inexperienced personnel”.
Risk element Software Engineering Examples General Examples Risk factor • inexperience of personnel
• use of new methods
• use of new tools
• unstable requirements2
• a high cholesterol diet
• living near a fault line of earth’s plates (e.g., San Francisco)
• slippery driving conditions (rain, snow)
Risk event • a system crashes • a key person quits
• extra time spent on learning a method
• a major requirements change
• a doctor’s diagnosis of a patients heart problem
• an earthquake
• a car accident
Risk outcome • system out of operation
• personnel and competence shortage
• work behind schedule
• new work required
• a diagnosed heart disease exists
• some buildings and roads destroyed
• a crash scene: untreated personal injuries, damaged vehicles
Risk reaction • system operational after delay, back up
data restored
• recruiting process initiated, staff reassigned
• treatment of heart problem
• reconstruction of roads and building
• treatment of injuries, purchase new car
Risk effect • added cost $50K
• two-month calendar delay
• some functionality lost
• reputation as a reliable vendor damaged
• hospital stay, cost of medical care
• cost and inconvenience of reconstruction, loss of human life, medical expenses
• medical costs, permanent injury effects, raised insurance premiums
Utility loss • The perceived harm experienced by a
stakeholder, e.g., the board of directors, CEO, or personnel
• The net effect of pain, lost time and expenses as felt by individuals
Table 1: Examples of risk elements
The purpose of risk factors is not to document all possible characteristics that may influence a risk event as there may be an infinite number of such factors. Instead, a risk factor should document main assumptions of project environment and, especially, characteristics that are different from the assumed, “normal” situation. This interpretation of risk factors enables explicit documentation of main assumptions and deviations from these assumptions.
A risk event represents an occurrence of a negative incident –or a discovery of information that reveals negative circumstances. Risk event is a stochastic phenomenon, i.e., it is not known for certain whether it will happen or not. This uncertainty can be characterized by a probability estimate associated to the risk event. Examples of risk events are listed in Table 1. Each risk event can be influenced by many risk factors but a risk event does not have to have a risk factor associated with it. A risk event can also influence the probabilities of other events or even influence risk factors.
The next element in Figure 2 is called risk outcome. It represents the situation in a project after the risk event has occurred but before any corrective action is taken to reduce the effects of a risk event. Examples of outcomes are listed in Table 1. The purpose of the concept of risk outcome is to document the immediate results and situation after the risk occurs. Based on the risk outcome description, different reactions can sometimes be considered more objectively and creatively than directly from a risk event.
When a risk event occurs, the resulting risk outcome is rarely accepted as such. Instead, organizations react to the situation to reduce the negative impact of the risk event. These
2
Note that this is different from “a change in requirements”, which would be a risk event. When defined as a factor, “unstable requirements” refers to the characteristics of the situation.
corrective reactions3 are an important part of understanding what is the overall impact of the risk event to the project domain. Thus, each risk outcome is associated with one or more risk reactions: a risk reaction describes a possible action that can be taken as a response to risk event and resulting risk outcome. If only one risk reaction is described, it is deterministic: it will be taken if the event occurs. If more than one reaction is described, they represent alternative lines of actions. Risk reactions can influence the probabilities of risk events. If the influence is stochastic, they have a similar relationship as a risk factor has to a risk event: they change the probability of an event. Examples of risk reactions are also listed in Table 1.
The risk effect set represents the final impact of a risk event to the project. In other words, it documents what characteristics of the project were effected, taking into account the impact of reactions. Effects are described through the explicitly stated goals for the project. Examples of different effects on goals are listed in Table 1.
While the risk effect represents the impact the risk had on each project goal, the concept of utility loss captures how severe the overall impact of effects is. The concept of utility loss is based on the utility theory4, a concept widely used in economics and decision theory [23,45]. The use of utility theory allows the simultaneous consideration of multiple criteria and consideration of several stakeholders. Furthermore, it is likely to result in more realistic evaluation of the losses as the utility functions of stakeholders are generally believed to be non-linear [10,24] and there may be points of discontinuity in them. We have sometimes used the term “pain” as a synonym for utility loss as the concept of utility may appear too theoretical for practitioners.
The multiplicity (i.e., cardinality) information about risk element associations is included in Figure 2, using the UML class diagram notation and syntax5. A symbol in the beginning of an arrow indicates how many outgoing associations are allowed or required. Correspondingly, a symbol at the end of the association arrow indicates how many associations can be linked to an element.
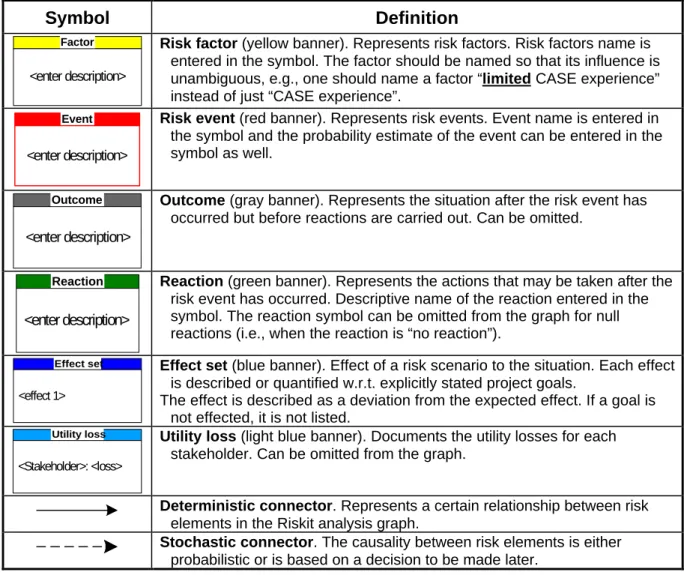
The Riskit analysis graph uses specific symbols to represent risk elements. The allowed symbols in the Riskit analysis graph are defined in Table 2. The banners of the symbols are color-coded to support easier recognition of risk elements6. The Riskit symbols can be drawn manually or with any drawing tool. However, we have implemented a drawing template on a MS-Windows -based drawing tool [44] which contains the Riskit symbols and thus supports easy creation and editing of Riskit analysis graphs.
3
Note that we use the term “reaction” to action that is taken after the risk event occurs, as opposed to “risk controlling actions” that are taken before risk events occur.
4
The utility theory states that people make relative comparisons between alternatives based on the utility (or utility loss) that they cause. The utility is the level of satisfaction, pleasure or joy that a person feels or expects.
5
The multiplicity symbols are interpreted as follows:
1 Exactly one association leaves or enters the class. * Any number of associations leave or enter the class 1..* At least one association leaves or enters the class.
6
The color of the symbol is mentioned in parenthesis in the explanation column in Table 2 so that colors are distinguishable even when this document is viewed on black and white media.
Symbol Definition
Factor
<enter description>
Risk factor (yellow banner). Represents risk factors. Risk factors name is entered in the symbol. The factor should be named so that its influence is unambiguous, e.g., one should name a factor “limited CASE experience” instead of just “CASE experience”.
Event <enter description>
Risk event (red banner). Represents risk events. Event name is entered in the symbol and the probability estimate of the event can be entered in the symbol as well.
Outcome <enter description>
Outcome (gray banner). Represents the situation after the risk event has occurred but before reactions are carried out. Can be omitted.
Reaction
<enter description>
Reaction (green banner). Represents the actions that may be taken after the risk event has occurred. Descriptive name of the reaction entered in the symbol. The reaction symbol can be omitted from the graph for null reactions (i.e., when the reaction is “no reaction”).
Effect set
<effect 1>
Effect set (blue banner). Effect of a risk scenario to the situation. Each effect is described or quantified w.r.t. explicitly stated project goals.
The effect is described as a deviation from the expected effect. If a goal is not effected, it is not listed.
Utility loss
<Stakeholder>: <loss>
Utility loss (light blue banner). Documents the utility losses for each stakeholder. Can be omitted from the graph.
Deterministic connector. Represents a certain relationship between risk elements in the Riskit analysis graph.
Stochastic connector. The causality between risk elements is either probabilistic or is based on a decision to be made later.
Table 2: Riskit analysis graph symbols
Each class of symbols in the Riskit analysis graph is drawn in the same vertical column in a graph. In other words, if several risk scenarios are represented in the same graph, all factors are in the same vertical line (column), followed by risk events in the same column, etc. An exception is a case where some risk events only influence risk factors, i.e., they have been created to model probabilistic risk factors. These risk events can be placed towards left of the risk factor column to keep the main part of risk scenario more legible.
The utility loss is estimated for each relevant stakeholder. Thus, each risk effect set has at least one utility loss estimate associated with it.
The previous definitions introduced individual risk elements in the Riskit analysis graph: the term is used risk element to refer to any of the components presented above, i.e., risk factor, risk event, risk outcome, risk reaction, risk effect and utility loss (pain). We use the term risk scenario for any unique event-outcome-reaction-effect combination. Risk scenario is marked in Figure 2 with a dashed rectangle. The key attributes of a risk scenario are its probability, its set of risk effects and, its set of utility losses.
There are several possible ways to use the Riskit analysis graph. The full Riskit analysis graph is based on the underlying conceptual model of risk elements, as presented earlier in this section in Figure 2. However, our earlier evaluations with the method indicated that such a complete graph may be laborious to edit and complex to view in practice [31]. Therefore, a
simpler version of the graph can normally be used. In this normal version of the Riskit analysis graph the risk outcome is not explicitly modeled, it is implicitly included in the risk event, as is shown in Figure 3. This is called the normal Riskit analysis graph and it is the default version of the graph. The consequence of this simplification is that when there are more than one possible outcome for a risk event, these should be modeled as separate events.
1 * 1 1 1..* 1 * * * * * * 1..* 1..* * * influences probability of valued through results in changes status of
changes status of influences probability of
prompts influences the probability of Risk factor Risk event Risk Effect set Utility loss Reaction
Figure 3: The “normal Riskit analysis graph”
We have also defined an even simpler version of the Riskit Analysis Graph, as shown in Figure 4. In this simplified form of the graph, the reaction element is implicitly included in the effect set element. This further simplification of the graph can be used when there is no need to model and analyze different alternative reactions and when there are reasons to minimize graph size and complexity. In a situation where the simple Riskit analysis graph is used and several reactions need to be modeled, they could be modeled as different effect sets. However, it is important to point out that the simple Riskit analysis graph makes a potentially central aspect of risk scenarios implicit. Thus, if alternative reactions need to be considered, we recommend that the reactions are explicitly modeled.
1 * 1..* 1 * * 1..* 1 * * influences probability of valued through changes status of results in influences probability of Risk factor Risk event Risk Effect set Utility loss
6. Risk Management Process
In this section we present the Riskit risk management process. The Riskit process has been divided into distinct steps that are similar to other, widely used steps in risk management [12-14,20,33,39]. Our risk management process contributes to the previously presented ones by providing a process that is a “defined process”, i.e., a process that is defined in detail so that it can be repeated consistently.
The Riskit process definition described in this document represents the risk management activities of the Riskit framework. The learning process included in the overall Riskit framework is based on the Experience Factory concept [3,5] and has been presented separately [29].
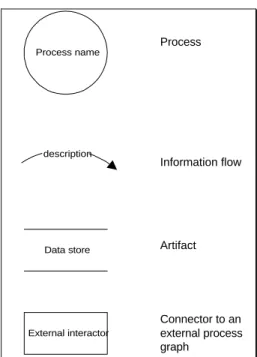
The Riskit process definition includes the definition of items for each sub-process, as presented in Table 3. We have also represented the Riskit process graphically using the dataflow diagram notation [9,46]. The symbols used in the dataflow
diagram notation have been presented in Figure 5. Note that the process symbol can also represent sub-processes.
Purpose: Purpose of the process.
Description: Description of the process and approaches used in it.
Entry criteria The criteria that is used to initiate the process. The criteria can include logical expressions, such “AND” or “OR”. The logical expressions area used, statements are written within square brackets: “[statement]”.
Input: Input information required by the process.
Output: Output produced by the process.
Methods and tools: Methods and tools used by the process.
Responsibility: A person or role that is responsible for the process.
Resources: List of resource types that are used or participate in the process.
Exit criteria: Exit criteria used to determine whether the process has been concluded. The criteria can include logical expressions, such as “AND” or “OR”.
Table 3: Process definition information template
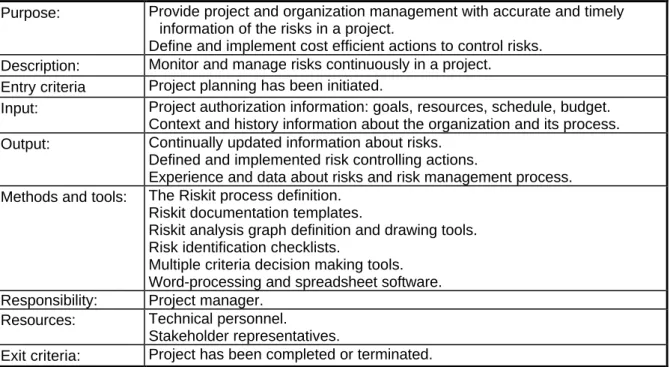
Using the template introduced in Table 3, we have given a process definition for the whole Riskit process in Table 4.
Process name description Data store External interactor Process Information flow Artifact Connector to an external process graph
Figure 5: Dataflow diagram symbols used
Purpose: Provide project and organization management with accurate and timely information of the risks in a project.
Define and implement cost efficient actions to control risks. Description: Monitor and manage risks continuously in a project.
Entry criteria Project planning has been initiated.
Input: Project authorization information: goals, resources, schedule, budget.
Context and history information about the organization and its process.
Output: Continually updated information about risks.
Defined and implemented risk controlling actions.
Experience and data about risks and risk management process. Methods and tools: The Riskit process definition.
Riskit documentation templates.
Riskit analysis graph definition and drawing tools. Risk identification checklists.
Multiple criteria decision making tools. Word-processing and spreadsheet software.
Responsibility: Project manager.
Resources: Technical personnel.
Stakeholder representatives.
Exit criteria: Project has been completed or terminated.
Table 4: Process definition information for the whole Riskit process
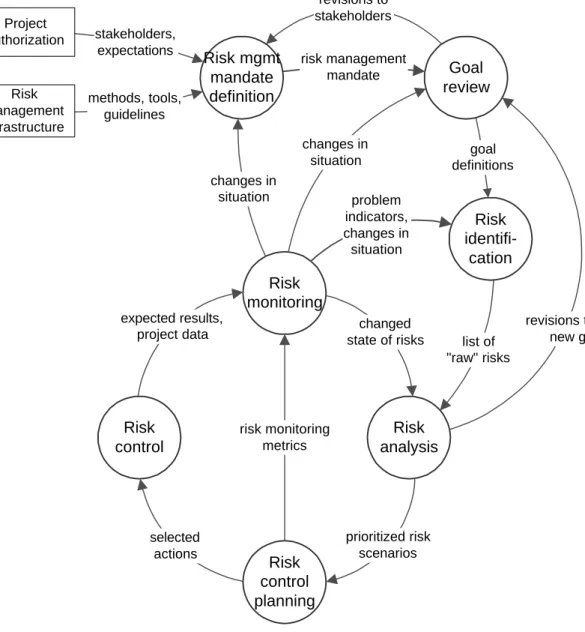
While Table 4 presented a holistic view of the Riskit process, the following sections present a more detailed view of the Riskit process, i.e., its sub-processes, artifacts used, information flows, resources used, and its behavior. The risk management cycle in a project can be viewed as consisting of some basic activities: defining the scope and focus of risk management; review and definition of goals; risk identification and monitoring; risk analysis; risk control planning; and controlling of risks. Main flows of information between these processes are represented in Figure 6. Each of the processes in Figure 6 can be instantiated several times during the project duration and they may be enacted concurrently. This behavioral aspect of the process is modeled through the entry and exit criteria defined for each process [17,28,36]. However, typically the most critical instances of the risk management cycle are the ones enacted in the beginning of the project.
stakeholders, expectations methods, tools, guidelines Risk analysis Risk monitoring Risk control selected actions expected results,
project data list of
"raw" risks goal definitions Goal review Risk control planning prioritized risk scenarios risk management mandate Risk mgmt mandate definition revisions to goals, new goals revisions to stakeholders Risk identifi-cation changed state of risks problem indicators, changes in situation changes in situation changes in situation risk monitoring metrics Project authorization Risk management infrastructure
Figure 6: The Riskit risk management cycle
We have presented summary descriptions of the Riskit sub-processes in Table 5, which presents summaries of the activities in the Riskit process, as well as the main output of each activity. Each process will be defined in more detail in the following sections.
Riskit step
Description
Output
Risk managementmandate definition
Define the scope and frequency of risk management. Recognize all relevant stakeholders
Risk management mandate: why, what, when, who, how, and for whom
Goal review Review the stated goals for the project, refine them anddefine implicit goals and constraints explicitly. Analyze stakeholders’ associations with the goals.
Explicit goal definitions
Risk identification Identify potential threats to the project using multiple
approaches.
A list of “raw” risks. Risk analysis Classify and consolidate risks.Complete risk scenarios for main risk events.
Estimate risk effects for all risk scenarios Estimate probabilities and utility losses of risk
scenarios.
Completed Riskit analysis graphs for all analyzed risks. Ranked risk scenarios. Risk control
planning
Select the most important risks for risk control planning. Propose risk controlling actions for most important
risks.
Select the risk controlling actions to be implemented.
Selected risk controlling actions.
Risk control Implement the risk controlling actions. Reduced risks.
Risk monitoring Monitor the risk situation. Risk status information.
Table 5: Overview of outputs and exit criteria of the Riskit process
The Riskit process presented in this section can also be seen from the perspective of artifacts it produces. This perspective is useful in determining how changes in one artifact or its component should be propagated to other components. Figure 7 presents this view of the artifact relationships. 1..* 1..* * * 1 1..* 1..* 1 * 1..* has threatens defines documents changes the state of Stakeholder Goal Risk management mandate
Risk Risk controlling
action
Figure 7: Riskit process artifact dependencies
The point of Figure 7 is that a change in one of the components should trigger re-evaluation of items that are dependent on the changing item. For instance, if a new stakeholder is recognized, goals, risks, and risk controlling actions should reviewed and analyzed. In practice this is done by reinitializing corresponding Riskit processes.
6.1 Risk Management Mandate Definition
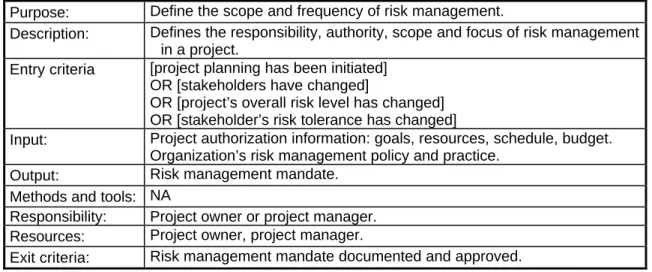
The risk management mandate is a project specific statement on the scope of risk management in a project. The responsibility of defining the risk management mandate belongs to the owner of the project, i.e., the person or organizational unit that authorizes or funds the project or who will use or sell its results. Typically project owner is the person or group of people to
whom the project manager reports, e.g., a project steering group. The process definition information for this process has been presented in Table 6.
The risk management mandate definition process is initiated when any of the three entry conditions listed in Table 6 are met, i.e., when the project is initiated or when there has been a change in stakeholders or in the overall risk level of the project. Stakeholder changes may be identified in other parts of the process, especially in the goal review and definition process and in the risk identification and analysis processes. The acceptance of stakeholders into the risk management mandate needs to be controlled by project owner and therefore it must be handled by this process. Likewise, if there has been a significant change in the overall risk level in a project, or the risk analysis has revealed that initial assumptions about the risk levels are not valid, the risk management mandate may need to be revised. For instance, additional resources may need to be allocated or specific areas of risk may be given a higher priority or more frequent reporting cycles.
Purpose: Define the scope and frequency of risk management.
Description: Defines the responsibility, authority, scope and focus of risk management in a project.
Entry criteria [project planning has been initiated] OR [stakeholders have changed]
OR [project’s overall risk level has changed] OR [stakeholder’s risk tolerance has changed]
Input: Project authorization information: goals, resources, schedule, budget. Organization’s risk management policy and practice.
Output: Risk management mandate.
Methods and tools: NA
Responsibility: Project owner or project manager.
Resources: Project owner, project manager.
Exit criteria: Risk management mandate documented and approved.
Table 6: The process definition information for the risk management mandate definition
process
The risk management mandate defines which stakeholders are to be defended in risk management, stakeholders’ priorities, which risks may be excluded from project management’s risk management scope (e.g., organization management may be willing to take responsibility of some risks without burdening project management with any risk controlling responsibility), and how often and on what level detail should risks be managed. The risk management mandate may also define any other procedures that are not addressed by the existing risk management infrastructure, i.e., the current methods, processes and tools that have been defined for risk management. A template for defining the risk management mandate is presented in Table 7.
Risk mgmt mandate
attribute
Description Example
Objectives Statement of main objectives for risk management.
“The objective of risk management in this program is to prevent major risks from occurring, keep project owners informed of the risk situation in the program and, when feasible, estimate the size of risks in the program.” Scope Definition of scope for risk
management: what areas of risk should be covered and what level of detail should be involved.
“The program is responsible for managing all technical, personnel and project management related risks.”
Risk
management authority
Definition of authority or budget
available for risk management. “The program manager has been allocated 12 personmonths of developer time for implementing risk controlling actions. Additional risk controlling action expenditures have to be approved by the steering group.”
Accepted risks
Description of risks that the project owners have accepted and are thus excluded from project’s normal risk management scope.
“Management takes responsibility for risks that deal with competitive situation changes and possible corporate reorganization.”
Risk
management procedures
Description of the risk management procedures, methods or techniques to be used.
“The standard, corporate risk management procedures are followed in the program with following modifications:
•A dedicated risk identification session is held every two months
•Top 10 lists and corresponding risk controlling actions are included in monthly reports.”
Stakeholders Identification of stakeholders and
their priority. “The stakeholders covered in risk management, in order oftheir importance, are customer, division management, and sales division.”
Table 7: Risk management mandate definition template and example
The risk management mandate definition process is concluded when all items listed in Table 7 have been addressed and approved.
6.2 Goal review
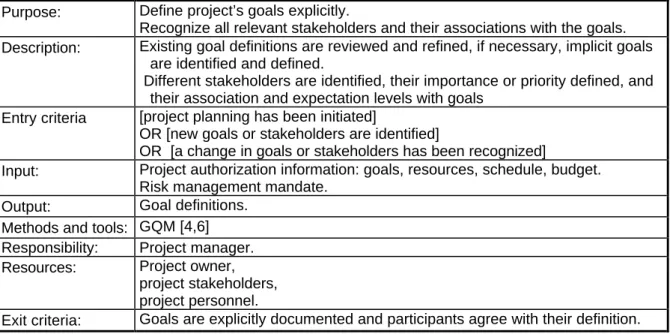
Risks do not exist without a reference to goals, expectations or constraints that are associated with a project. If goals are not recognized, risks that may affect them may be ignored totally or, in the best case, they cannot be analyzed in any detail as the reference level is not defined. Some of a project’s goals typically have been explicitly defined but many relevant aspects that influence management decisions may be implicit. Therefore, it is necessary to begin the risk management process by a careful review, definition and refinement of goals and expectations that are associated with a project. The definition of the goal review process is given in Table 8.
Purpose: Define project’s goals explicitly.
Recognize all relevant stakeholders and their associations with the goals. Description: Existing goal definitions are reviewed and refined, if necessary, implicit goals
are identified and defined.
Different stakeholders are identified, their importance or priority defined, and their association and expectation levels with goals
Entry criteria [project planning has been initiated]
OR [new goals or stakeholders are identified]
OR [a change in goals or stakeholders has been recognized]
Input: Project authorization information: goals, resources, schedule, budget. Risk management mandate.
Output: Goal definitions.
Methods and tools: GQM [4,6] Responsibility: Project manager.
Resources: Project owner,
project stakeholders, project personnel.
Exit criteria: Goals are explicitly documented and participants agree with their definition.
Table 8: The process definition information for the goal review process
In the Riskit method we identify three different types of goals. We use the term goal to refer to any of them, i.e., a goal is a general statement of purpose, direction or objective. When defined more accurately, we have found it useful to classify goals into three categories:
Objective: A goal that has an achievable, well-defined target level of achievement, e.g., “drive from A to B in one hour”.
Driver: A goal that indicates a “direction” of intentions without clearly defined criteria for determining when the “goal” has been reached, e.g., “drive from A to B as
Constraint: A limitation or rule that must be respected, e.g., “…while obeying all traffic The review of project’s goals often leads to definition of some additional, previously implicit objectives, drivers and constraints. The purpose of this step is to produce formal definitions of these issues for the stakeholders that the project manager must satisfy. The goals are expressed using the template presented in Table 9.
Goal attribute Description
Name Name of the goal.
Type of goal Objective / driver / constraint Description Description of the goal.
Stakeholder(s) Names of the stakeholders for the goal that are interested in it. Measurement unit Measurement unit(s) used for the goal (e.g., $, date, or
person-month).
Target value Target value for the goal. Relevant for objectives and possibly for
constraints.
Direction of increasing utility
Definition of whether an increase or decrease in goal value increases the utility. I.e., whether an increase in goal metric is good or bad. Stated as “growing” or “decreasing”.
Required value range Minimum or maximum value required for the goal, if applicable.
Table 9: Goal definition template
As Table 9 indicates, goals are linked to different stakeholders that are associated with a project. This information will later be used in risk analysis to compare and rank risks. If new stakeholders are identified, they are defined and documented as described in the risk management mandate definition process. From the perspective of our process definition, a change in stakeholders initiates a new instance of the risk management mandate definition process.
The relationships between goals and stakeholders can also be documented using a stakeholder-goal priority table presented in Table 10. Such a table allows approximate prioritization of goals for each stakeholder: each cell in Table 10 documents relative importance of goals for each stakeholder. It is important to point out that if such rankings are documented for stakeholders, each column should be read and interpreted independently. Priority values between stakeholders for a given goal cannot be derived from such information. In other words, goal priority rankings should be interpreted only within a single column, not across columns in Table 10.
As shown in Table 10, the relative priorities between stakeholders can also be documented in stakeholder column headings. This information is initially defined in the risk management mandate definition process.
Stakeholders: Goals: Stakeholder A priority: 1 Stakeholder B priority: 1 ... Stakeholder X priority: 2 Goal 1 1 2 ... 4 ... ... ... ... ... Goal n NA 2 ... 1
Table 10: An example of a stakeholder-goal priority table
The goal and stakeholder priority information is useful information for the risk analysis process as it allows more effective filtering and ranking of risks. Without such information project manager may be forced to make intuitive or undocumented judgment calls regarding which risks are selected for further analysis or how utility losses are prioritized. Note that it is
usually adequate to provide ordinal scale partial rankings of these items, either by using predefined categories (e.g., low, medium, high) or defining priorities for these items.
Most important goals are often defined in the project plan or the project contract. However, all of the goals may not be in these documents. For instance, efficient resource utilization may be an important consideration for a contractor but this typically is not considered a project goal. However, if these goals are real for some of the stakeholders in the project, they must be included in the risk management process. Goals can typically be found in the following areas:
• schedule;
• resources used, most often personnel time;
• cost of development;
• product requirements, which can include both functional and other quality characteristics;
• resource utilization; and
• technical constraints, such as hardware platforms, operating systems and use of particular software tools.
The goal review can be considered completed when project manager and stakeholders have reached an agreement on the goals and they are formally defined. However, the goal definition process may often need to be re-initiated as new goals are identified during the risk analysis process.
6.3 Risk Identification
The purpose of the risk identification process is to identify potential threats to the project and its stakeholders. Table 11 presents the process definition information for this process. As Figure 6 and Table 11 show, the risk identification process is initially carried out in the beginning of the project as its results are fed into the risk analysis process. The risk identification process is activated again when either of the two other conditions in the “entry criteria” row are met: if stakeholders or goals change or if the project situation changes.
The goal of the risk identification process is to produce a comprehensive list of all reasonable risks to the project. The mental mode of the identification process is to suggest many potential risks, not to analyze them. Analysis and filtering of risks produced will take place in the next step of the Riskit process. There are various techniques that can be used to facilitate effective risk element identification, such as brainstorming, checklists [11,13,25,32], critical path analysis, even simulation and benchmarking [11]. Based on our experiences, we recommend that informal techniques, such as brainstorming, are used in the beginning of risk analysis and more formal approaches are introduced gradually. This approach does not create initial bias in risk identification and it introduces formality as participants may start to lose their vigor in identification.
The risk list that is produced should be numbered or coded so that all risks can be traced throughout the risk management process.
Purpose: Identify potential threats to the project.
Description: Identify a large number of possible threats to the project using multiple approaches.
Entry criteria [project planning has been initiated]
OR [new goals or stakeholders are identified]
OR [a change in goals or stakeholders has been recognized]
OR [the time interval stated in risk management mandate has elapsed] OR [a significant change is project’s situation has been recognized] Input: Project authorization information: goals, resources, schedule, budget.
Risk management mandate.
Risk checklists, general [13,32] or organization-specific [12]. Lessons learned reports from similar projects.
Output: A “raw”, numbered list of risks.
Methods and tools: Brainstorming techniques.
Goal and stakeholder driven identification approaches. Meeting aids.
Interviews. Responsibility: Project manager.
Resources: Project personnel.
Risk management facilitator.
Exit criteria: The marginal yield of risk identification approaches zero, even when identification techniques are changed,
OR time or effort allocated for risk identification runs out.
Table 11: The process definition information for the risk identification process
There are two possible strategies for concluding risk identification process. The recommended approach is to conclude when no new reasonable risks are identified when alternative identification techniques are used. Such a situation would suggest that the identification process has exhausted all reasonable risks and further effort is no longer cost effective. However, this approach may be costly and subject to participant fatigue. An alternative approach is to set a predefined time limit, such as a single three-hour session, for risk identification. This approach can be justified by arguing that it is likely that most relevant risks are identified in the beginning and if adequate time is allotted, any remaining risks are not likely to be critical. Considering that risk identification is a critical activity and it is not particularly expensive, we recommend that a conservative approach is used in terminating the risk identification process, i.e., it is better to keep on identifying new risks a bit too long than to stop the process too early.
6.4 Risk Analysis
Risk analysis is a process where the “raw” risks from the risk identification process are grouped, filtered and prioritized. The goal of this activity is to provide detailed descriptions of project’s risks so that highest risk scenarios and appropriate risk controlling action can be planned and implemented in the next step of the Riskit cycle. Table 12 presents a summary of the risk analysis process.
Purpose: Understand and prioritize risks.
Description: Analyze risks and their components so that their probabilities and impacts can be assessed and most important risks recognized.
Entry criteria Potential new risks are identified.
Input: A list of risk items.
Output: A prioritized list of risk scenarios.
Methods and tools: Riskit analysis graph.
Multiple criteria decision making tools. Riskit Pareto ranking technique. Responsibility: Project manager.
Resources: Selected project personnel.
Risk management facilitator.
Exit criteria: Participants agree on the priority of the most important risks.
Table 12: The process definition information for the risk analysis process
Three main activities can be identified in the risk analysis process. First, raw risk items are clustered into sets, second, selected risks are documented as risk scenarios, and third, risk scenarios area ranked. Risk clustering and risk scenario development are iterative process that interact with each other: developing a risk scenario may prompt revisions in risk clusters and vice versa. These relationships between the processes are represented in Figure 8. These processes will be discussed in the following sections.
Risk scenario development Risk clustering revisions Risk prioritization risk scenarios risk items grouped into
clusters
Risk items risk items (raw risks)
Prioritized risk scenarios
prioritized risk scenarios
Figure 8: Sub-processes in risk analysis process
6.4.1 Risks Item Clustering
As the risk list produced by the risk identification process is an “un-analyzed” list of risks, it can contain redundant and overlapping items, as well as items on different levels of abstraction. If the risk identification process produced many such items, e.g., over 20, these risk items should be clustered into sets that contain similar risk items. This process is called risk item clustering and we have presented the process definition for it in Table 13.
Purpose: Group “raw” risk items into clusters.
Description: Group, decompose, merge or delete risk items into manageable clusters. Entry criteria Potential new risk items are identified.
Input: A list of risk items.
Output: Risk items grouped into clusters.
Methods and tools: Word-processor, drawing tools. Responsibility: Project manager.
Resources: Selected project personnel.
Risk management facilitator.
Exit criteria: All risks are included in the cluster set and number of clusters is manageable.
Table 13: The process definition information for the risk item clustering process
The purpose of risk item clustering is to provide a manageable intermediate step in risk management. The number of risk items produced in the risk identification process can be large and represent risks of different granularity. In many cases it is meaningful to cluster these items into sets that contain risks that relate to same area or are otherwise similar. Possible criteria for “similarity” include
• type of risk: technical, personnel, organizational, quality, schedule, functionality, product structure, etc. Some of these can be divided further.
• criticality: some risks may be considered obviously critical already at the risk clustering step
• stakeholders: risks may be grouped by stakeholders, i.e., risks affecting mainly a single stakeholder are grouped into one set.
The definition of “similar” is subjective judgment and not overly critical, as all risk clusters will be analyzed further and developed into specific risk scenarios in the next step. Risk clusters mainly provide a temporary structuring mechanism for the “raw” risk items produced in the risk identification process. More detailed analysis will be done in the scenario development process.
6.4.2 Risk Scenario Development
Risk scenario development provides the detailed documentation of risks that are selected for analysis. Risk scenarios are documented using the Riskit analysis graph (presented in section 5). One of the three different versions of the graph can be selected based on the level of granularity desired from the analysis, and the time available for the analysis. As a default, we recommend that the “normal” Riskit analysis graph is used (see Figure 3, page 13). We have presented a process definition for this sub-process in Table 14.
Purpose: Develop risk scenarios for main risks.
Description: Develop risk scenarios for main risks using the Riskit analysis graph. Entry criteria [risk clusters have become available]
OR [new information becomes available and is not compatible with existing risk scenarios]
Input: Risk items grouped into clusters.
Output: Risk scenarios for most relevant risks.
Methods and tools: Riskit analysis graph and drawing tool. Responsibility: Project manager.
Resources: Selected project personnel.
Risk management facilitator.
Exit criteria: All selected scenarios are completed.
Table 14: The process definition information for the risk scenario development process
As there normally is limited time available for risk analysis, not all risk items from the risk identification process can be included in risk analysis. Therefore, selecting (“raw”) risk items from risk clusters is an initial risk prioritization choice, yet this choice is made when the risks are not yet analyzed. To counter the possible bias caused by such an early selection, an adequate number of risk scenarios should be developed. Also, all risk items should be explicitly decided upon, they should not be left out of the analysis only because they got lost among other risk items. Our rule of thumb is to select most important scenarios from remaining risk clusters and keep on developing scenarios them until several most recent scenarios have not resulted in risk controlling actions that will be implemented. The rationale of this strategy is that if, after careful analysis, additional risk scenarios do not result in cost effective risk controlling action, they are not considered big enough risks by decision makers.
When risk scenarios are developed, the items in relevant risk clusters can be reviewed as candidates for risk elements. As defined in section 5, risk elements are defined column by column, as shown by an example in Figure 9. The example in Figure 9 represents two scenarios as the event “unrealistic effort estimation” has two potential reactions, “accept delay and added cost” and “allocate more resources”, both with different effect sets.
The first step in risk analysis, classifying risks into risk factors and risk events, is based on the risk list produced during the identification process. The categorization is based on the definitions given in section 5 and results are documented in the Riskit analysis graph (Table 2). An example of a Riskit analysis graph is given in Figure 9.
Factor Unfamiliarity with the
user interface tool Event Unrealistic effort estimation Outcome Project behind schedule, exceeding budgets Reaction Allocate more resources Factor
Inexperience with user interface design
Effect set Costs exceeded
significantly Reaction
Accept delay and added cost
Effect set Costs exceeded Deadline missed Reputation damage
The Riskit analysis graphs can also be expressed in textual form using indentation, as is shown in Figure 10, using the same example as in Figure 9. However, the main disadvantage of this textual representation is that it is difficult –and sometimes impossible –to represent complex relationships between risk elements without duplicating them. For instance, when a risk factor influences several risk events, the textual form may become impractical. In such situations, one solution is to duplicate the risk factor items at each risk scenario. This reduces the visual power of representation and may create consistency problems when graphs are revised. Although we have developed tabular alternatives that avoid the redundancy problem, they seem to increase the complexity of the representation unnecessarily and as of now we are not recommending their use.
Figure 10: Textual version of the Riskit analysis graph
The main task of scenario development is not to map each risk item produced in the risk identification process into a Riskit analysis graph. Instead, judgment must be used to select scenarios that capture essential and representative future risk scenarios. The following criteria can be used when determining whether a scenario represents an appropriate set of future events:
• The risk event in the scenario represents event instances that are similar in nature and their probability can be estimated.
• The range of potential effects in the scenario is not extreme.
• Potential risk controlling actions are same or similar for all scenario instances.
If there is fuzziness or wide range of possibilities with either of the above criteria, the scenario should be potentially decomposed into two or more scenarios.
Each risk scenario is documented in the Riskit analysis graph and, depending on the available time and resources, each risk element is defined using the risk element definition templates presented in Table 15, Table 16, Table 17, and Table 18.
Factors:
§ Unfamiliarity with the user interface tool
§ Inexperience with user interface design Event: Unrealistic Effort estimation
Outcome: Project behind schedule, exceeding budgets Reaction: Accept delay and added cost
Effect set:
Costs exceeded Deadline missed Reputation damage Reaction: Allocate more resources
Effect set:
Risk factor attributes Description
Name Name of the risk factor to be used as an identifier.
Description Description of the risk factor.
Normal/assumed level Description of the “normal” level for the risk factor.
Project’s risk factor state Description of the risk factors value for the project
Table 15: Risk factor definition template
Risk event attributes Description
Name Name of the risk event to be used as an identifier.
Description Description of the risk event.
Probability of occurrence Assessment of the probability of the event occurring.
Uncertainty of the estimate Assessment of the uncertainty in the probability assessment.
Information source Description of sources of information about the risk event for monitoring the changes in the probability or event
occurrence.
Timeframe Estimate of when the occurrence of risk will take place.
Table 16: Risk event definition template
Risk outcome attributes Description
Name Name of the risk outcome to be used as an identifier.
Description Description of the outcome. A description of the project state after the event but before any other action is taken.
Certainty of the outcome Assessment of the probability of the outcome if the risk event occurs (when not deterministic).
Table 17: Risk outcome definition template
Risk Reaction attributes Description
Name Name of the risk reaction to be used as an identifier.
Description Description of the reaction. A description of the line of action or procedures that may be carried out if an event occurs.
Rationale Description of the rationale for taking the action.
Table 18: Risk reaction definition template
The final step in risk scenario development is to estimate effects of scenarios. Effects are collected into sets and associated with each scenario. Effects are described through goals: each goal that is affected by a scenario is included in the effect set description and the effect is stated as a deviation from the goal or, in the cases of a driver, deviation from is expected. Depending on the estimation methods and tools available, the effects can be stated qualitatively (e.g., as textual descriptions or classifications high/medium/low) or quantitatively. Ranges can be expressed as well, if participants consider this necessary. Table 19 presents a template for describing scenario effects.
Note that effects should describe the net effect of the scenario after the event has occurred and reaction has taken place. It is often the case that not all goals are affected by a risk scenario, and sometimes the effects may be positive for some goals (e.g., loss of personnel may reduce costs while delaying schedule and limiting functionality).
Risk Effect set attributes Description
Name Name of the risk effect set to be used as an identifier.
Description Itemized description of the effects. The effect description can be qualitative, i.e., a written characterization of the effect, or a quantitative estimate of the effect. Effects can also be described as ranges.
All effects are defined in terms of the goals they affect. If an effect that is not previously documented as a goal is recognized, corresponding goal definition must be made.
Table 19: Risk Effect set definition template
6.4.3 Risk Prioritization
As resources for risk management are limited, it may not be feasible to mitigate or analyze all risk scenarios. Instead, one should focus on most important risks and spend relatively more time and resources on their management. In order to do this, it is necessary to rank the risk scenarios. Thus, the final step in risk analysis is to prioritize risk scenarios. The process definition for the risk prioritization process is given in Table 20
Purpose: Prioritize risk scenarios.
Description: Based on the estimates for probability and utility loss for each scenario, prioritize scenarios with respect to their seriousness.
Entry criteria [Risk scenarios have been completed] OR [new risk scenarios have been defined]
OR [new information becomes available and is not compatible with existing prioritization]
Input: Risk scenarios.
Output: Partially prioritized risk scenarios.
Methods and tools: Riskit Pareto ranking technique. Responsibility: Project manager.
Resources: Selected project personnel.
Risk management facilitator.
Exit criteria: Selected scenarios have been ranked as well as available data allows.
Table 20: The process definition information for the risk prioritization process
In order to prioritize risk scenarios it is necessary to estimate the probability and utility loss associated with each scenario. These two estimation problems have different kinds of inherent difficulties. Probability estimation is difficult because little historical data may be available and event probabilities, in principle, are unknowable in a changing environment [23,30]. Utility loss estimation is difficult because there are multiple factors to be considered and the exact shapes and forms of stakeholders’ utility functions are not known. We will discuss the estimation problems for each aspect of risk separately in the following.
If historical data about risks is available and if it can be safely assumed that the risk situation has not changed from the projects where the historical data was collected from, a frequency based interpretation of probability [22] can be used and past risk occurrences can be used as an estimate of the probability. However, in software engineering context such data hardly ever exists in adequate volume in order to be statistically reliable and the assumption about status quo is rarely realistic. Therefore, while historical data can be used as input to the estimation process, subjective probabilities, i.e., degrees of belief [22], are often the only