ROUNDABOUT
~’
~ DESIGN
GUIDELINES
STATE Of MARYLAND
DEPARTMENT OF TRANSPORTATbN
STATE HIGHWAY ADMINISTRATION
ROUNDABOUT DESIGN GUIDELINES 1.0 2.0 3.0 4 5.0 6.0 ~ 7.0
8.0
9.0 LIST OF FIGURES LIST OF TABLES FORWARD INTRODUCTION USE OF ROUNDABOUTS PERFORMANCE OF ROUNDABOUTS GEOMETRIC DESIGN LANDSCAPE DESIGNSIGNING AND PAVEMENT MARKING LIGHTING
PEDESTRIAN AND BICYCLE CONSIDERATIONS WORK ZONE TRAFFIC CONTROL
APPENDIX i l-2 3-5 6 - 31 32 - 44 45 - 48 49 - 54 55 56 - 59 60 - 64 BENEFIT/COST ANALYSIS I - IV REFERENCES
Figure 1.1 Figure 3.1 Figure 3.2 Figure 3.3 Figure 3.4 Figure 3.5 Figure 3.6 Figure 3.7 Figure 3.8 Figure 4.1 Figure 4.2 Figure 4.3 Figure 4.4 Figure 4.5 Figure 4.6 Figure 4.7 Figure 4.8 Figure 4.9 Figure 4.10 Figure 5.1 Figure 5.2 Figure 5.3 Figure 6.1. Figure 6.2 Figure 6.3 LIST OF FIGURES Yield at entry, Deflection, and Flare Typical turning movement diagram Roundabout entry and circulating tlows
Required number of entry and circulating lanes
Entry capacity fat a single lane roundabout with a 13 foot wide entry lane and one circuiating lane
Entry capacity for a roundabout with two 13 foot wide entry lanes and two circulating lanes
Proportion of vehicIes stopped on a singie lane roundabout Proportion of vehicles stopped on a multi-lane entry roundabout Definitions of the Terms used in Tables (a) and (b)
Flare design at entry
Typical Roundabout Entrance/Exit Conditions for Urban Areas Oval roundabout
Turning templates for over-dimensional vehicles
Typical Rural Roundabout Design (with High Speed Approach Roads)
Alternative methods for providing vehicle deflection (not to scale) Illustration of the detlection criteria for a single lane roundabout Illustration of the deflection criteria for a multi-lane roundabout Sight distance requirements
Roundabout on a road with a very wide median
Example of the use of landscaping to reinforce the funnelling effect at the entrance to roundabouts
Typical Section of the Truck Apron Plan of Central Island
Typical signing for a state route roundabout Typical signing for a local road roundabout Typical pavement markings for roundabouts
1 8 8 9 17 18 25 25 26 32 33 33 34 35 38 39 39 41 43 46 47 48 51 52 .54
Figure 8.1 Figure 8.2 Figure 9.1 Figure 9.1. Figure 9.3 Table 3.1 Tabie 3.2 Table 3.3 Table 3.4 Table 3.5 Table 3.6 Table 3.7(a) Table 3.7(b) Table 3.8 Table 4.1 Table 4.2
Examples of Pedestrian Crossings Example of a special bicycle facility Roundabout workarea pavement markings Work Zone Traffic Control
Roundabout workarea delineation
LIST OF TABLES
Dominant Stream Follow-up Headways (tr,). (Initial values) in seconds.
Ration of the Critical Acceptance Gap to the Follow-up Headway (LlkJ
Adjustment Times for the Dominant Stream Follow-up Headway Sub-dominant Stream Follow-up headway t,
Average headway between bunched vehicles in the circulating traffic (r-) and the number of effective lanes in the circulating roadway.
Proportion of Bunched Vehicles, 0
Geometric Delay for Stopped Vehicles (Seconds per vehicle) Geometric Delay for Vehicles Which Do Not Stop (Seconds per vehicle)
Typical Casualty Accident Rates for Different Urban Intersections with Moderate to High Volumes in Victoria, Australia
Deflection Curve Radii
Approach Sight Distance (ASD)
58 59 61 62 64 11 12 14 14 16 19 22 23 27 37 40
FORWARD
The mission of the Maryland State Administration is to build and maintain a safe and efficient
highway system. There is evidence that roundabouts reduce accidents. Maryland has a highway
system that is well maintained, well planned, well organized and has a steadily declining accident
rate. The future holds many challenges for the Administration in continuing to fulfill its mission.
These chaknges include performing the same or more work with less staff, maintaining a high
level of service with limited resources, enhancing the environment, preserving the highway
system and fulfUng the requirements of the Intermodal Surface Transportation Act of 1992
(ISTEA). Given the above, we must constantly review m
ideas, processes and technologies
while remaiuin g focussed in accomplishing our mission. This guide brings us one step closer
to where we want to be.
This guide was developed to set forth a standard approach to the planning, design, and
construction of roundabouts in the State of Maryland, given that no federal guidelines exist. This
text borrows information from recognized experts in the planning, design and construction of
ro~dabouts; namely the Australian Design Guide (3). Generally, major concepts for safety and
design should follow AASHTO Design Guide. This guide supplements these fderal Guidelines
until such time when formal guidelines are established.
We believe Austroads is a leader in the planning, design and implementation of roundabouts.
We commend Australia, the European Community and others for recognizing the true benefits
of roundabouts early and enhancing their design such that they operate safely and efficiently.
We have selected the Australian Design guide as a model because its design procedure most
closely represents current procedures already adopted by the Maryland State Highway
Administration. We would like to extend our sincere thanks to those individuals at Au&roads
responsible for developing “Guide to Traffic Engineering Practice - “Roundabouts”. Most
importantly we thank them for allows us to reprint much of what they had developed.
It is intended that this u
be used to standardize the approach to roundabouts in Maryland.
It is only a guide. It is being issued as an interim document for one year from April 1,
1995. We expect many changes in the upcoming months and subsequent years to cane.
We encourage users to suggest improvements and send them to :
Mr. Thomas Hicks, Director
Office of Traffic & Safety
7491 Connelly Drive
Hanover, Maryland 21076
1.0 INTRODUCTION
Well designed roundabouts have proven to be safe and efficient forms of inteisection control in the countries that have adopted modern guidelines. These countries include Great Britain, Australia, France, Germany, Spain, Norway, The Netherlands, among other countries.
These guidelines are intended to be temporary and updated as ofteq as is necessary. Design guidelines from other countries form the basis of this document. Over time, these guidelines will be analyzed as to their applicability to the driving conditions in Maryland. Input into these guidelines from users is encouraged.
Roundabouts operate by gap acceptance, in that approaching drivers must give way to circulating traffic in the roundabout. The proven safety performance of most roundabouts is due to the low relative speeds of all vehicles and the relative simplicity of decision making required of drivers.
Conditions will be encountered wherein the procedures highlighted in these guidelines cannot be fully implemented. It is expected that the designer make modifications as necessary while ensuring the major concepts of safety and design.
The aims of these guidelines are as follqws:
a. to give guidance on where roundabouts may be used b. to describe the performance and operation of roundabouts
C. to give guidance on design standards for roundabouts so that high standard and
uniform design will be encouraged.
The designer of a modem roundabout should be fully aware of the difference between a roundabout and a traffic circle. Basically, there are three main differences; Yield-at-entry, Deflection, and Flare. These are illustrated in Figure 1.1. .‘.
FIGURE 1.1 YieId at entry, Deflection, and Flare
Deflection is the physical slowing of vehicles through the roundabout which is achieved by causing the driver to curve around thexentral island. Deflection increases the safety of the intersection by lowering the entry and circulating speeds.
2.0 USE OF ROUNDABOUTS 2.1 GENERAL
Roundabouts should be considered at a wide range of intersection types including but not limited to; freeway terminal interchanges, state route intersections, and state route/local route intersections. Roundabouts perform better at intersections with roughly similar traffic volumes and at intersections with heavy left turning movements. Roundabouts can improve safety by simplifying conflicts, reducing vehicle speeds and providing a clearer indication of the driver’s right-of-way compared to other forms of intersection control.
2.2 SITE SELECTION CRITERIA
The following site selection guidelines are intended as general guidelines only. The designer should determine the applicability of a roundabout at a particular intersection by considering the following items:
- Capacity Analysis of all methods under consideration - Cost/Benefit Analysis
- Percentage of Truck Traffic - Bicycle and Pedestrian Traffic - Right-of-Way Consideration - Parking Requirements
- Compatibility with Adjacent Intersection - Safety Aspects
- Effect of Possible Traffic Growth - Speed of Traffic
- Installation and Maintenance Costs ROUNDABOUT SHORTLISTING GUIDELINES Introduction
The following guidelines are based on existing design manuals from England, Australia, and other countries, and video tapes of existing roundabouts. The guidelines are not meant to be rigid but should be used in conjunction with engineering judgement, and traffic analysis. For example, it could be stated that a roundabout should not be placed where there is an existing signal in close proximity (i.e. Chevy Chase Circle) because the queues from the signal may extend temporarily into the roundabout. Intuitively, this would not seem to be an appropriate place for a roundabout, however traffic analysis may indicate that a roundabout may work better than any other solution. The proposed intersection treatment, therefore, should be chosen based on the advantages/8disadvantages, benefits/costs that it provides.
Location
l High Accident Location (with left turn or right angle accidents)
0 Capacity/Delay Problem Intersection
l Intersection in which traffic signal was requested but not warranted. l 4-Way Stops
Traffic Volume and Composition
l Heavy Delay on Side Street
l Flow Distribution with Heavy Left Turn Movement (makes signals less efficient -no
impact on roundabout)
0 DHV of 7000 or Less (initially) Right-of-Wav
l Generally take no more right-of-way than comparable solution using signals:
Appropriate Sites for Roundabouts
0 0 0 0 0 0 0 0 0 0
Heavy delay on minor road.
Traffic signals result in greater delay. Intersection with heavy left turning traffic.
Intersection with more than four legs or unusual geometry.
At rural intersections (including those in high speed areas) at which there is an accident involving crossing traffic.
Where major roads intersect at “Y” or “T” junctions.
At locations where traffic growth is expected to be high and where future traffic patterns are uncertain or changeable.
At intersections where U-turns are desirable. At Freeway Interchange Ramps.
High accident intersection where right angle accidents are prominent.
Inannronriate Site for Roundabouts
2.3
Where a satisfactory geometric design cannot be provided.
Where a signal interconnect system would provide a better level of service. Where it is desirable to be able to modify traffic via signal timings.
Where peak period reversible lanes may be employed.
Where the roundabout is close to existing signals and queueing from the signal could be a problem.
COST/BENEFIT ANALYSIS
A cost/benefit analysis shall be completed for all intersections in which a roundabout is being considered. See procedure outlined in Appendix A.
3.0
PERFORMANCE OF ROUNDABOUTS
3.1
GENERAL
Until more data is gathered concerning the performance of roundabouts in Maryland, the Maryland State Highway Administration recommends that designers use the Australian practice at this time.
Australian practice for determining the capacity and delay of roundabouts is based in gap acceptance theory, and the techniques have been researched in Horman and Tumbull (1974), Avent and Taylor (1979) and Troutbeck (1984, 1986 and’1990). The most recent methodology developed by Troutbeck (1989), uses the empirical results of field observations made in four Australian capital cities.
These field studies identified a number of driver behavior aspects that affect the analysis of capacity and delay. These are:
0 That entering vehicles generally give way to all circulating vehicles. Entering drivers are often unsure that a circulating driver to their left may intend to leave at the next exit and travel across their paths. Consequently, entering drivers tend to give way to all circulating vehicles, even where the circulating roadway is two or more lanes wide. An exception is when vehicles are entering from an auxiliary “right turn only” lane. If this auxiliary lane and the entry curve is designed so that entering drivers are protected from the circulating traffic, they will generally proceed without “giving way” to any circulating vehicle.
0 That at multi lane entries, vehicles are prepared to enter simultaneously alongside other entering vehicles at the same approach.
l That drivers entering in different lanes of the same approach will behave
differently.
0 That exiting vehicles have no effect on drivers entering at the same leg unless the negotiation speed is high or the roundabout is small and the entering drivers have difficulty in determining whether a vehicle is exiting or not.
These findings influence the capacity and delay calculations. The principal departure from the 1986 Australian guide is that the drivers in each entry lane on a particular approach behave differently. This means that each entry lane will have a different capacity and vehicle delay. As a consequence, if the number of entry lanes is doubled then the capacity is not quite doubled.
The usual terms used to define gap-acceptance behavior are the critical acceptance gap, t,, and the follow-up time, tf. The critical acceptance gap is the minimum acceptable gap that will be acceptable to a homogeneous and consistent population of drivers. The follow-up time is the minimum headway between minor stream vehicles which enter in the longer gaps in the circulating traffic. In both cases the units are in
seconds. The gap acceptance terms represent the average for all drivers as the average predicted capacity and average delay values are required. In the theory, it is assumed that all drivers will accept a gap greater than the critical acceptance gap. It is also assumed that drivers are consistent and behave exactly the same each time a gap is offered. That is, a driver does not reject a gap only to accept a shorter one later. However in practice, drivers are different from one another and often act inconsistently because they are not always able to make accurate assessments of gap durations. Also, drivers do occasionally reject a gap then accept a shorter one. Calculations based on these assumptions nevertheless give estimates of capacity which are reasonably consistent with observations (Troutbeck 1989, Catchpole and Plank, 1986 and Plank and Catchpole,
1984).
As the drivers in each entry lane behave differently, each entry lane will be given different critical gap and follow-up headway parameters.
3.2 TRAFFIC BALANCE
Roundabouts operate best when the traffic flows are balanced. This does not mean that all movements must be of the same magnitude but simply that the predominant movements are “broken up” by circulating traffic so that gaps are provided to allow vehicles waiting on adjacent legs to enter the roundabout without major delays.
3.3
ANALYSIS OF THE CAPACITY OF ROUNDABOUTS
This section provides an analytical technique which can be expected to give quite accurate results which reflect current Australian experience and practice. SIDRA Software is recommended and is available through McTrans at the University of Florida. In situations where a high degree of accuracy is not required, Figures 3.3, 3.4 and 3.5 may be used to obtain general estimates of the capacity of a roundabout.
3.3.1 PROCEDURE
The capacity .of a roundabout is influenced by its geometry through the critical gap parameters. The procedure for capacity analysis of each approach is as follows:
Assemble Traffic Data
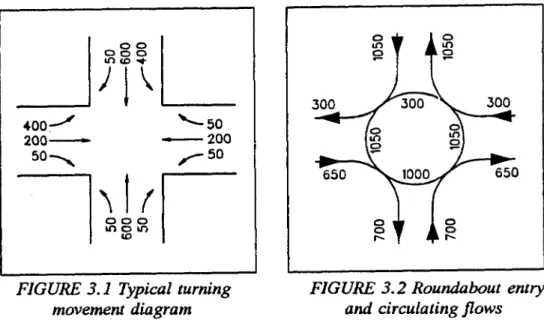
Cyclic and stochastic variations in traffic flows should be taken into account when assembling the traffic data into the turning movement flows to be used in the analysis. Figures 3.1 and 3.2 show the conversion of typical traffic turning movements at a cross-road type intersection into entry and circulating flows on a roundabout.
L I
FIGURE 3. I Typical turning movement diagram
I 1 I
FIGURE 3.2 Roundabout entry and circulating flows
Where the truck flows are less than 5 percent the total vehicle flow is considered to be passenger car units (pcu’s). For truck volumes greater than 5 percent the truck flows should be converted to passenger car units. A single unit truck is assumed to be equivalent to 2 pcu’s and an articulated vehicle, 3 pcu’s. Equivalencies for other vehicle types (such as bicycles or large combination vehicles) may be estimated and used if necessary.
Number of Entry and Circulating Lanes
The number of entry lanes will generally be determined from the number of lanes on the approaches. However, an entry may be widened or flared, particularly if there are heavy turning movements.
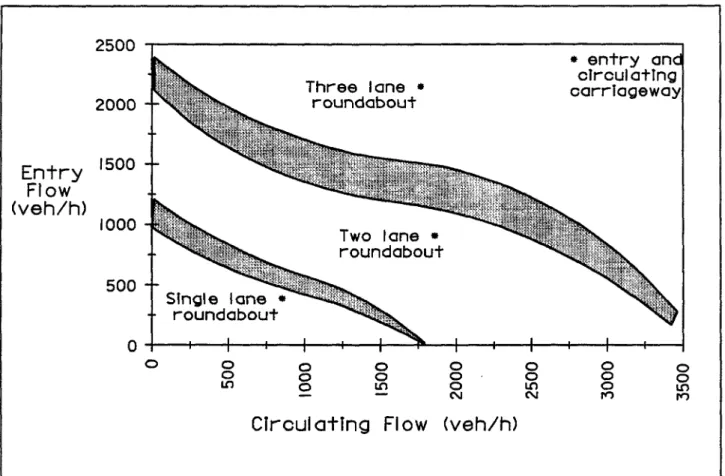
It is usually assumed that the number of circulating lanes will equal the number of entry lanes at any approach. This assumption can be relaxed later if required. Figure 3.3 is a plot of approach (entry) flows and circulating flows and the acceptability of a single or multi-lane roundabout. The shaded bands indicate the limits for a single lane roundabout and a two lane roundabout. For instance, if conditions at a roundabout give a point in the upper shaded area of Figure 3.3, then a two lane roundabout may be acceptable depending on the entry geometry and the acceptable degree of saturation. The user may need to evaluate both a two lane and a three lane roundabout in this case. Figure 3.3 is based on the acceptable degree of saturation being less than 0.8.
L
FEY
(veh/h)
2500 Three lane * roundabout * entry an clrcul atlng 1 carriageway Two lane l roundabout ” I I 11-1 ’ I ’ I I I 0 E Ti z 8 8 - Ts E 8 N is izCircul sting
FI ow (veh/h)
FIGURE 3.3 Required number of entry and circulating lanes Record the geometric values
From the functional plans of the roundabout or from actual measurement, record the values for:
0 the inscribed diameter, Di.
l The number of entry lanes, %.
n, is 1 for entry widths less than 18 feet
n, is 2 for entry widths between 18 and 33 feet n, is 3 for entry widths greater than 33 feet
l the number of circulating lanes, n,.
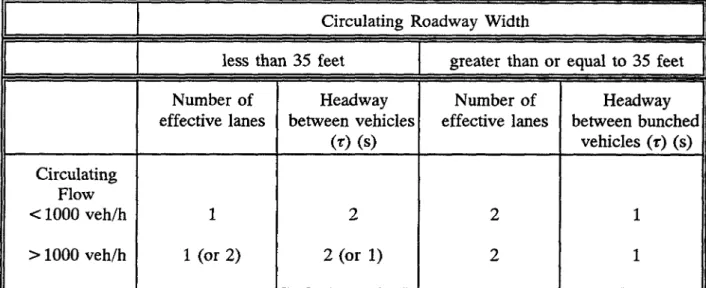
NOTE: For some circulating roadways between 25 feet and 33 feet wi’de and with circulating flow rates greater than 1000 veh/h, there may be two effective lanes and n, may be set to 2. See the discussion later in this Section.
l the average entry lane width, (or the entry width divided by the number of the
entry lanes).
Refer to Section 4 for a procedure for the geometric design of roundabouts. Classify the entry lane type
Classify the entry lanes as either dominant or sub-dominant. Where there are two or more entry lanes, one entry lane “dominates”. That is the drivers in this lane tend to influence the behavior of drivers in other entry lanes at the approach. The entry lane with the greatest flow is chosen to be the dominant stream; other entry lanes will then be sub-dominant. If there are 3 entry lanes, two will be sub-dominant and only one will be a dominant stream. If there is only one entry lane at an approach then this lane is considered as a “dominant” lane (Troutbeck 1989).
Estimate the critical gap acceptance parameters
Gap acceptance parameters are affected by geometry of the entry. Geometries which offer an easier entry path give lower gap acceptance values. These parameters are also a function of the circulating flow. At higher circulating flows, the circulating speeds are lower and drivers are more willing to accept smaller gaps. Also at higher circulating flows, more circulating drivers slow and allow entering drivers to move in front of them. This leads to priority sharing or even a reversal of priority. Further discussion of the interactions is given in Troutbeck (1989 and 1990).
Circulating flow (veh/h)
From Troutbeck (1989)
Note: The values of the follow-up headway are given to two decimal places to assist in interpolation. The adopted value may be rounded to one decimal place.
Flows above about 1700 vph are not applicable to single lane circulating roadway (shaded area in table).
’ The ratio of the critical acceptance gap to the follow-up headway (t&J, is given in Table 3.2. The critical acceptance gap is the product of the appropriate values from Table 3.1 and Table 3.2.
TABLE 3. I Dominant Stream Follow-up Headways ($A. (Initial values) in seconds.
Number of circulating lanes Average entry lane width (ft) Circulating flow (veh/h) 0 200 400 600 800 1000 1200 1400 1600 1800 2000 2200 2400 2600 10 2.32 2.26 2.19 2.13 2.07 2.01 1.94 1.88 1.82 one 13 1.98 1.92 1.85 1.79 1.73 1.67 1.60 1.54 1.48 16 1.64 1.58 1.52 1.45 1.39 1.33 1.26 1.20 1.14
more than one
10 13 16 2.04 1.70 1.36 1.98 1.64 1.30 1.92 1.58 1.24 1.85 1.51 1.18 1.79 1.45 1.11 1.73 1.39 1.10 1.67 1.33 1.10 1.60 1.26 1.10 1.54 1.20 1.10 1.48’ 1.14 1.10 1.41 1.10 1.10 1.35 1.10 1.10 1.29 1.10 1.10 1.23 1.10 1.10 From Troutbeck (1989)
’ For single lane circulating roadways, if the critical gap calculation from Tables 3.1 and 3.2 is less than 2.1 s, use 2.1 s.
o For multi-lane circulating roadways, the minimum value of critical gap should be 1.5 s.
NOTE: Values of the ratio may be interpolated for intermediate widths of entry lane. TABLE 3.2 Ratio of the Critical Acceptance Gap to the Follow-up Headway (t&fd)
(4
For a single lane entryTable 3.1 lists the dominant stream follow-up headway (tf,). If there is one circulating lane (nC= l), these values are used for the entry stream. If there are 2 or more circulating lanes (n, =2 or 3), then the values in Table 3.1 should be increased by 0.39.
The ratio of the critical acceptance gap to the follow-up headway (t&J, is given in Table 3 -2. The critical acceptance gap is the product of the appropriate values from Table 3.1 and Table. 3.2.
For Multi-lane Approaches
To estimate the entry lane flows at approaches with two or more lanes, it can be assumed that drivers wishing to turn right will use the right hand entry lanes and the drivers turning left will use the left hand lanes. However in some situations lanes may be marked with signs or pavement arrows to restrict them to particular traffic movements and the lane arrangement so marked would be used in the analysis. The through traffic then needs to be proportioned to the appropriate lanes to finalize the lane entry flows. While the above provides the most accurate assessment, it is pointed out that estimates of approach capacity are not significantly affected by the distribution of traffic in the lanes.
The entry lane with the greatest flow at an approach is termed the “dominant” lane and traffic in this lane is termed the dominant stream. Other lanes contain subdominant streams.
The critical gap parameters for an approach with two or more entry lanes are estimated using Tables 3.1, 3.2, 3.3 and 3.4.
Table 3.1 gives values for the follow-up headway for the dominant stream. These values. are adjusted if the number of entry lanes differs from the number of circulating lanes. The adjustment values are given in Table 3.3.
Table 3.4 gives the values of the sub-dominant stream follow-up headway (t;) as a function of the dominant stream follow-up headway (Q and the ratio of dominant stream entry flow to the sub-dominant stream entry flow.
The critical acceptance gap values for each lane are given by the product of the follow-up headway (from Tables 3.1 and 3.4) and the ratios in Table 3.2. As stated above, critical acceptance gap values need to be calculated separately for each entry lane. Refer to Troutbeck (1989) for an example of these calculations.
Number of
circulating lanes Number of entrv lanes
Note: Add or subtract these factors from the initial values from Table 3.1.
TABLE 3.3 Mjustment Times for the Dominant Stream Follow-up Headway
From Trou tbeck (I 989)
Estimate the characteristics of the circulating traffic
As the entering drivers give way to all circulating vehicles, the circulating traffic can be considered as if it were all in one lane. There are, however, circulating stream characteristics that change with flow and the number of circulating lanes.
The greater number of circulating lanes, the shorter will be the average headway between bunched vehicles in all lanes. If there are two or more circulating lanes then the average headway (r) between bunched vehicles is about 1 s and if there is only one lane the average headway is 2 s.
If a circulating roadway equal to or greater than 33 feet wide carries a circulating flow greater than 1000 veh/h it can be assumed to effectively operate as two streams and the average headway between bunched vehicles (z) will be 1 s. (see Table 3.5). Under these conditions the vehicles might travel in an offset pattern and users should decide whether or not the circulating roadway will be considered to have one or two effective lanes. It may be preferred to consider all single lane roundabouts to have only one effective lane regardless of the circulating flow and hence an average headway between bunched vehicles of 2 s. This action would be conservative. Note that if it is considered that there will be two effective circulating streams, then the number of circulating lanes (nJ should be set to 2. Table 3.3 may then need to be consulted when estimating the follow-up headways.
The operation of the circulating stream also affects the average percentage of vehicles which are in bunches. As the flow increases, more vehicles are in bunches.
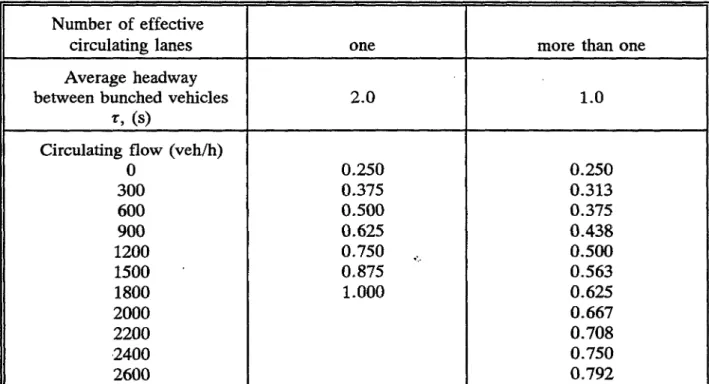
The proportion of bunched vehicles, (O), is evaluated from the circulating flow, the number of effective circulating lanes (characterized by the average headway between bunched vehicles) and the proximity of the roundabout to signalized intersections or other situations which increase bunching. Troutbeck (1989) gives equations for estimating the proportion of free vehicles, i.e. those not in bunches. Values for the proportion of bunched vehicles have been developed from these equations and the revised values are listed in Table 3.6. (Also see Akselik and Troutbeck (1991)). It is suggested that the values given in this Table be then adjusted according to the proximity of the roundabout to nearby signalized intersections or other situations which will influence the approaching traffic conditions and the circulating flow at the roundabout. Values should be increased or decreased by no more than 0.2 based on judgement of the extent of bunching caused.
The proportion of bunched vehicles is expected to range from 0 for random traffic to about 0.8 for heavily platooned traffic. Values as high as 0.8 to 0.9 have been observed in extreme cases. This is equivalent to an average platoon length of 1 to about 3 or 4 vehicles in most conditions and up to 10 vehicles under the worst conditions.
TABLE 3.5 Average headway between bunched vehicles in the circulating trafic (z) and the number of effective lanes in the circulating roadway.
Calculate Absorption Capacity and Degree of Saturation
The absorption capacity of each entry lane is calculated from the entry lane gap acceptance parameters (t, and tJ applicable to the dominant lane and to each sub-dominant entry lane and the circulating flow characteristics (Qc, z, and e). The appropriate equation is:
c= 3600 (1-e) qce-"'ta-T'
pe-"tr (3.1)
Where:
C = the absorption capacity of an entry lane in veh/h
e = the proportion of bunched vehicles in the circulating streams qc= the flow of vehicles in the circulating streams in veh/s
t, = the critical acceptance gap relevant to the dominant or sub-dominant lanes respectively. tr = the follow on headway relevant to the dominant or sub-dominant lanes respectively.
r = the minimum headway in the circulating streams, and these are related by:
A- w-wqc
1 -zc;Tc
(3.2)
Note that the capacity predicted by Equation 3.1 is the expected steady-state capacity, or the maximum entry flow rate and it is not the “practical capacity”. See discussion on degree of saturation below.
The above analysis method and equations are more comprehensive than may be necessary for some purposes. Figures 3.4 and 3.5 may be used to obtain a quick estimate for use in the planning and preliminary layout of a roundabout at a particular site.
Figure 3.4 refers to a single lane roundabout with a 13 foot wide entry lane and one circulating lane. The results in Figure 3.5 reflect the operating conditions of a roundabout with two 13 feet wide entry lanes and two circulating lanes,
1000
Entry
zx Y
500
0
Circulating Flow (veh/h)
FIGURE 3.4 Entry capacity for a single lane roundabout with a 13 foot wide entry lane and one circulating lane
2500 2000 Entry $P$c~y 1500 Both lanes (veh/h) 1000 500 Circulating Fl6w (veh/h)
FIGURE 3.5 Entv capacity for a rounahbout with two 13 foot wide entry lanes and two circulating lanes
For very high circulating flows (exceeding about 1700 veh/h for single lane circulating flows, or about 3400 veh/h for multi-lane circulating flows), the entry capacities from equation 3.1 approach zero. In such cases, a minimum entry capacity may be assumed.
Calculate Degree of Saturation
The degree of saturation of an entry lane is the arrival flow divided by the entry (absorption) capacity of the lane:
x=Q, C
(3-3)
Where:
Q, = entry lane arrival flow in vehk, and
C = entry lane capacity in veh/h (from equation 3.1 or figures 3.4 and 3.5) 18
The degree of saturation during the design period for an entry lane should be less than about 0.8 to 0.9 for satisfactory operation, although this may not always be practicable.
Within this range of degree of saturation, designers should consider using the delays as a more appropriate measure of performance.
The maximum (practical) degree of saturation corresponds to the concept of “practical capacity “. For example, if practical degree of saturation (x) is 0.85, practical capacity is 0.85 C, where C is the entry capacity from equation 3.1. The practical degree of saturation is also used for “spare capacity” calculations.
Judgement may be exercised in the assessment of the acceptability of the degree of saturation or delays taking into consideration factors such as environment, locality, possible alternative intersection treatments, cost and the period that the roundabout can be expected to have less satisfactory performance characteristics than an alternative treatment.
q
Number of effective circulating lanes Average headway between bunched vehicles
z9 (9
one more than one
2.0 1.0
Circulating flow (veh/h) 0 300 600 900 1200 1500 1800 2000 2200 ,240O 2600 0.250 0.250 0.375 0.313 0.500 0.375 0.625 0.438 0.750 i, 0.500 0.875 0.563 1.000 0.625 0.667 0.708 0.750 0.792 q
3.4 Delays at Roundabouts -.
There are two components of the delays experienced at roundabouts, namely queuing and geometric delay.
Queuing delay is the delay to drivers waiting to accept a gap in the circulating traffic. Geometric delay is:
(0 The delay to drivers slowing down to the negotiation speed, proceeding through the roundabout and then accelerating back to normal operating speed; or
(ii) The delay to drivers slowing down to stop at the end of the queue and, after accepting a gap, accelerating to the negotiation speed, proceeding through the roundabout and then finally accelerating further to reach normal operating speed. It excludes the time to wait for an acceptable gap.
In some instances it may be appropriate to consider only the queuing delay, e.g. when approximate results only are required, or when making a comparison with a “STOP” or “YIELD” controlled approach at an intersection. In these cases, the geometric delay for traffic entering from the side (controlled) road approach would experience about the same geometric delay as at a roundabout. In most cases it may be desirable to consider the total delay e.g. when the results are required for a comparison with traffic signals or in an economic analysis.
Total delay is the sum of the queuing delay and the geometric delay. 3.4.1 Queuing Delay
To calculate the average queuing delay, first calculate the minimum delay for the conditions when the entering traffic flow is very low using:
w _ e*(t,-d -t i
hT2-2teII--
(l-ws, =x+
2(nz+l-43)
where the gap acceptance parameters, t,, z, 8 and A are as in Equation 3.1 and the circulating flow qC is in veh/sec.
For all practical purposes the average queuing delay per vehicle is given by:
w,+w*+900T[Z+ z2+ {73
where :
*.
w, = average delay per vehicle in seconds
Wh = minimum delay in seconds when entering traffic is very low (from Equation 3.4)
T= duration of the flow period in hours, i.e. the time interval during which an average arrival demand Q, persists (use 1 h or 0.5 h)
z = x-l
X = degree of saturation of the entry lane (= Q,/C as in Equation 3.3)
c=
entry lane capacity in vehicles per hour m = a delay parameter given bym = Wb Cl450
The second term of Equation 3.5 accounts for the queuing delays due to the presence of a queue in the entry lane. Equation 3.5 is a time-dependent formula (Akqelik 1991, Akcelik and Troutbeck 1991) derived from the steady-state formula given by Troutbeck (1989). It is applicable for near-capacity and oversaturated conditions. The flow period parameter becomes important for high degrees of saturation, i.e. the delays are insensitive to the flow period for low degrees of saturation.
Negotiated speed through roundabout Vn (MPH)
* Refer to Figure 3.8 for the definitions of the dimensions.
TABLE 3.7(a) Geometric Delay for Stopped Vehicles (Seconds per vehicle)
Approach Distance*
Speed V, around Negotiated speed through roundabout
N-9 roundabout Vn (MPH) D (ft) 9 12 16 19 22 25 28 31 25 65 7 4 2 1 0 25 195 17 11 7 4 0 25 325 19 13 8 4 25 460 13 8 25 590 12 37 65 11 8 5 4 3 2 1 1 37 195 20 15 11 8 4 2 1 1 37 325 22 17 13 9 5 1 1 37 460 17 13 8 4 1 37 590 17 12 .7 2 50 65 14 11 9 7 6 5 4 3 50 195 24 19 15 11 8 5 4 3 50 325 26 20 16 13 9 5 3 50 460 21 17 13 9 4 50 590 21 16 12 7 62 65 18 15 12 10 9 8 7 6 62 195 27 22 18 15 12 9 7 6 62 325 29 24 20 16 13 10 6 62 460 25 20 17 13 12 62 590 25 20 16 4 * Refer to Figure 3.9 for the definitions of the dimensions.
3.4.2 Geometric Delay
The geometric delay for vehicles differs depending on whether the vehicles have to stop or not. George (1982) developed a method for calculating the average geometric delays as follows:
Average Geometric delay:
d,
= P, d, + (l-P,) d, where :(3.6)
ps = the proportion of entering vehicles which must stop,
4 = the geometric delay to vehicles which must stop,
(l-P,) = the proportion of entering vehicles which need not stop, d, = is the geometric delay to vehicles which need not stop This equation has also been documented by Middleton (1990).
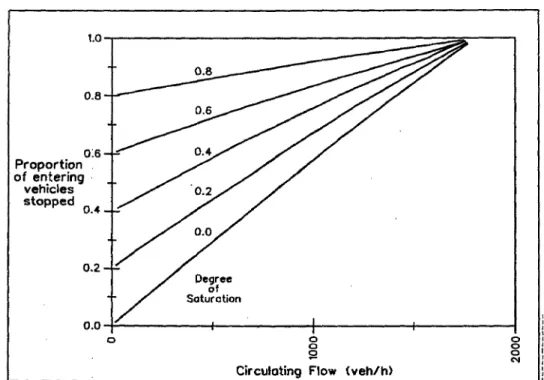
The proportion of entering vehicles which must stop, P,, can be estimated using Figures 3.6 and 3.7 depending on the number of circulating lanes. This proportion depends on the entry and circulating lane flows. Increase either of these flows and the proportion of entering drivers stopped will increase. The near linear lines in these Figures result from the gap acceptance parameters and the level of bunching in the circulating stream being a function of the circulating flow.
Tables 3.7(a) and (b) have been developed to allow d, and d, to be estimated. These enable the geometric delay to be calculated for each approach to a roundabout.
Geometric delay is different for each traffic movement - left turn, right turn and straight on, at each approach and each should be calculated separately.
3.4.3 Total Average Delay
Total average delay is the sum of the queuing delay and the geometric delay. Again the total delay will not be the same for vehicles making various turns and using different entry lanes. The total average delay per vehicle from an approach must then be estimated using the proportion of vehicles making each movement and their respective delays.
I 8 s!
Circulating Flow (vehlh)
FIGURE 3.6 Proportion of vehicles stopped on a single lane roundabout
Proportion 3f vehicles
stopped
Circulating Fldw (veh/h)
FIGURE 3.7 Proportion of vehicles stopped on a multi-lane entry roundabout.
at negotiation speed
“,
mph
~~~~~~
Negotiation speed ;
FIGURE 3.8 Definitions of the Terms used in Tables (a) and (b)
3.5 Entry Queue Lengths
The average entry queue length, 12y, under steady state under-saturated conditions is given by the product of the average queuing delay, w,, and the entry lane flow, Q,.
n,
= w, Q, (for x =Z 1) (3-7)As a rule of thumb, the 95 percentile queue length is three times the average, i.e. a queuing space for 3n,., vehicles will be exceeded about 5 per cent of the time. Values of queuing space should be rounded up to the next vehicle.
Note that the distribution is not a Normal distribution and the usual limits do not apply. 3.6 Safety of Roundabouts
The safety performance of roundabouts has been documented in a number of Australian and UK studies. “Before” and “after” type accident studies carried out at intersection involving a wide range of site and traffic conditions at which roundabouts have been constructed, indicate very significant reductions in casualty rates.
Intersection Treatment Mean Casualty Accident Rate Typical Range of Casualty Accident Rates T-Intersections -Unsignalized 1.5 1.3 - 1.7 -Signalized 1.4 1.2 - 1.6 Cross-intersections -Unsignalized 2.4 2.1 - 2.7 -Signalized 1.7 1.6 - 1.8
Multi-leg Intersections -Signalized 3.2 2.8 - 3.6
Roundabouts (high volumes) 0.8 0.6 - 1.1
Roundabouts (low volumes) 0.4 0.1 - 1.0
TABLE 3.8 Typical Casualty Accident Rates for Diflerent Urban Intersections with Moderate to High Volumes in Victoria, Australia
The previous tabulation (Table 3.8) illustrates the result of comparative studies carried out in Australia. Similar results have been obtained in the UK.
The good safety record of properly designed roundabouts can be attributed to the following factors:
The general reduction in conflicting traffic speeds (limited to less than 30 MPH) passing through the intersection on all legs.
Elimination of high angles of conflict thereby ensuring low relative speeds between conflicting vehicles.
Relative simplicity of decision making at the point of entry.
On undivided roads, in high speed areas, long splitter islands provide good “advance warning” of the presence of the intersection.
Splitter islands provide refuge for pedestrians and permit them to cross one direction of traffic at a time.
Roundabouts always require a “conscious action” on the part of all drivers passing through the intersection, regardless of whether other vehicles are present or not. An understanding of the above factors and their implications, in respect to the geometric design of roundabouts is essential to the full achievement of the safety benefits of
The safety record of roundabouts with more than three circulating lanes has not been well established. Maycock and Hall (1984) analyzed the influence of the geometry of roundabouts on their accident performance. They did not find circulating roadway width to be a significant factor. The accident potential at roundabouts with 3 circulating lanes would be influenced by the drivers’ entry curvature. At this time, there is insufficient data to quantify the safety performance of roundabouts with 3 entry and 3 circulating lanes.
Standards for deflection of vehicle paths through roundabouts were developed in the United Kingdom from the safety performance of a large number of roundabouts. At some of these sites, the size of the central island was reduced to provide greater circulating pavement widths and thus increase capacity. In doing so, deflection through these roundabouts was reduced. A study of 23 of 26 such sites showed a 91 percent increase in casualty accidents after deflection through the roundabouts was reduced. This increase, which was statistically significant at the 0.001 level, was attributed to higher vehicle speeds through the roundabouts and supports the design criteria outlined in this guide.
3.7 The Cost of Rolindabouts
The cost of roundabout installation varies a great deal between sites depending on factors such as the area of pavement construction and other road works, the cost of land acquisition and the relocation of services. Roundabouts may be either more or less expensive than traffic signals depending on the particular site. There are many sites where traffic signals can be installed with little or no change to the existing pavement and curb lines, whereas this is rarely possible with a roundabout. For those situations traffic signals will generally be less costly to install than roundabouts. When completing a benefit/cost for a roundabout, the life cycle costs for the anticipated duration of the improvement should be considered.
Maintenance costs associated with roundabouts will normally include:
0 Pavement Maintenance: The “scrubbing fction” of heavy vehicles turning through a roundabout makes it necessary to carefully consider the type of surface treatment required and it may influence the frequency of resurfacing.
0 Curb and gutter and drainage systems,
l Traffic signs,
0 Pavement markings,
l Street lighting,
0 Landscaping
In general there is little difference between the cost of maintaining these items at a roundabout compared with that at other forms of channelization of equivalent pavement area. However the additional cost of maintaining and operating traffic signals, which may be required in conjunction with other forms of channelization, is not required at a
roundabout, except in the unusual situations where “metering” traffic signals are required.
3.8 Environmental Issues
Roundabouts can offer considerable scope for environmental enhancement and are sometimes favored over other forms of intersection treatment in environmentally sensitive areas.
The central island can be landscaped and planted provided:
l the treatment does not block any of the sight triangles (refer Section 4)
0 any landscaping will yield to out-of-control vehicles and not be a hazard;
l the treatment does not constitute an unnecessary distraction to drivers.
Planting can be used to discourage pedestrians from crossing at undesirable locations.
Compared to traffic signals, roundabouts may operate with reduced queue lengths and shorter average delays. This results in:
- less air and noise pollution; - lower fuel consumption; - less parking restrictions;
- better access to private driveways.
In addition, the use of a roundabout eliminates potential traffic safety and disruption problems associated with the malfunction of traffic signals.
2.
Roundabouts can be used on local streets to discourage high traffic speeds and the intrusion by very large vehicles. Provisions for emergency and service vehicles need to be considered in the design of these roundabouts.
3.9 Means of Improving the Performance of Roundabouts 3.9.1 Continuous (Slip) Lanes
Where there is a heavy right turn traffic movement, this may be either separated from the operation of the roundabout by providing a separate right turn slip lane or by providing an auxiliary lane for this traffic. In the latter case, the right turn entry conditions can be improved by positioning the splitter island past the entry lanes thereby shielding the right turn entry movement.
circulating traffic and the right turning traffic does not conflict. The exclusion of this right turning traffic will increase the capacity of the roundabout.
3.9.2 Flaring (tapering) of the Entries *.
Kimber (1980) has established equations for the performance of roundabouts (in the UK) with flared entries. The capacity is increased by about 20 percent if an entry is flared from two lanes to three lanes over a short tapering distance from the entry. However studies in the UK (Maycock and Hall 1984) showed that as the entry widths are increased, so do the accident rates between entering and circulating vehicles. The increase in capacity is not insignificant, but it is substantially less than can be achieved by adding another full length entry lane. It has been observed that drivers’ perception and behavior at roundabouts is quite variable and at many locations drivers do not use multi-lane roundabouts to their maximum effectiveness. In Australia, the introduction of a short flaring on an approach generally does not realize increased benefits. However if designers wish to investigate the potential for flared approaches, they should consult the design equations given in Kimber (1980). 3.9.3 Grade Separation
The performance of any intersection can be improved with the grade separation of some of the conflicting traffic movements. On heavily travelled roads, roundabouts incorporating grade separated movements can offer significant benefits. It is usual for the through traffic movements of the more important road to be separated from the roundabout, e.g. as in a “bridged rotary” type interchange on a freeway. However in special situations, the traffic movements separated out from the roundabout can also be a right turn movement.
The analysis of a grade separated roundabout is the same as for other forms of roundabout except that the traffic movements that are removed from the conflict are not included in the calculation of the performance characteristics. It is obvious that grade separation substantially increases the capacity and reduces delay and accident potential of a roundabout.
3.9.4 Entry Metering
Roundabouts will not function efficiently if there are insufficient acceptable gaps in the circulating traffic stream. If there is one approach with a very heavy through or right turn traffic movement, which is not interrupted sufficiently by the circulating flow, then this stream will present few acceptable gaps to drivers at the next entry. The capacity of this next entry will be very low and the delay to this traffic excessive. Often this situation occurs only during peak flow periods and at these times the operation can be dramatically improved by artificially interrupting the high flow approach.
Entry metering is usually done by installing traffic signals to meter the flow as it approaches the roundabout. This has the effect of bunching the flow of traffic and introducing more of the longer duration gaps. It is important not to locate the signals too close to the entry as this may confuse the “right of way” requirements at the entry. While there has been concern expressed about the confusion of vehicle priority where signalized pedestrian crossings are located close to roundabouts, Thompson et al (1990) concluded that
“there was no evidence to support the view that drivers who proceed through these traffic
signals strongly associate them with the control of entry onto a roundabout”.
Pedestrian operated traffic signals, set to operate on a regular cycle during the peak periods or activated by a detector placed in the approach suffering excessive delay, have been successfully used at some sites to meter traffic into a roundabout. Two aspect signals (red and yellow only) have also been used. Wherever such metering is used, it is important to provide signing at the signals to advise drivers that the flow is being metered. the “STOP HERE ON RED SIGNAL” sign is usually also provided.
Where a signalized pedestrian crossing is used for traffic metering, care needs to be taken with its location to ensure that sufficient space is provided between it and the exit from the roundabout to avoid traffic queuing back into the circulating roadway.
4 GEOMETRIC DESIGN OF ROUNDABOUTS 4.0 GENERAL
AASHTO guidelines should be followed for turning radii, superelevation, grades, etc. If they are not followed, justification must be documented and approved at the P.I. submittal. 4.1 GENERAL PRINCIPLES
4.1.1 FLARE DESIGN AT ENTRY
Flare is the widening of the approach road to increase the capacity of the roundabouts. The approach should never be widened such that there are more approach lanes than circulating lanes. The length of flare should be between 100 and 300 feet. See Figure 4.1. 4.1.2 ENTRY WIDTH
Entry width can vary depending on the design vehicle and approach roadway width. In general, the entry width should be between 11 feet and 15 feet per entry lane. The entry width should be less than or equal to the circulating width.
In the end, the entries should be designed to accommodate the design vehicle while ensuring adequate deflection.
The approach curve to the roundabout should be the same radius or smaller than the radius of the curved path that a vehicle would be expected to travel through the roundabout. It is better to give approaching drivers a clear indication of the severity of the curve they will have to negotiate, since the speed at which drivers negotiate is dependent on their perception of the sharpness of the first curve. The entry radii should be designed tangential to the central island.
FIGURE 4.1 Flare design at entry
The entry radius should be a minimum of 50 feet for single lane roundabouts and 100
feet for multi-lane roundabouts. Small entry radii results in drivers reducing speed to a degree that drivers consider unreasonable or have difficulty in negotiating, or in drivers ignoring lane lines and cutting off vehicles in adjacent lanes. Figure 4.2 illustrates the components of entry design.
Straight tangential departure is prefe Varies, IT-I 5’ Splitter island envelope . .
* 2’ acceptable on small islands
- Continuation of
curved approach
12’45 to I’
FIGURE 4.2 Typical Roundabout Entrancelfiit Conditions for Urban Areas 4.1.3 CIRCULATING WIDTH
The circulatory width should be constant and should be between 1.0 and 1.2 times the maximum entry width.
The circulating roadway should generally be circular in plan. Oval shaped roundabouts are acceptable ( and preferred on roadways
with wide med.&s or with unusual geometry ) as long as deceptively tight bends are avoided. See Figure 4.3 for an example of an oval shaped roundabout.
It is a good design to avoid short lengths of reverse curve between entry and exits. It is difficult to achieve this on three-legged roundabouts or on roundabouts with skewed entries.
4.1.4 INSCRIBED CIRCLE DIAMETER 4.1.4 INSCRIBED CIRCLE DIAMETER
The size of the roundabout is a compromise between making it small enough to provide adequate deflection while making it large enough to provide for the appropriate design vehicles.
Maryland SHA has determined that the smallest inscribed circle diameter for a single lane roundabout is loo-feet on a state highway based on a WI%-50 design vehicle. Roundabouts on smaller subdivision roads may be smaller depending on the maximum design vehicle. In all cases, the layout should be verified using the appropriate design vehicle template. See Figure 4.4.
FIGURE 4.4 Turning templates for over-dimensional vehicles
4.1.5 EXITS 4.1.5 EXITS
The exit from a roundabout should be as easy to negotiate as possible. Whereas entries are designed to slow vehicles, exiting vehicles should be able to accelerate out of the circulating roadway. Therefore, the exit radii should generally be greater than entry radii. Straight paths are preferred, if possible.
The exit from a roundabout should be as easy to negotiate as possible. Whereas entries are designed to slow vehicles, exiting vehicles should be able to accelerate out of the circulating roadway. Therefore, the exit radii should generally be greater than entry radii. Straight paths are preferred, if possible.
4.1.6 SPLI’ITER ISLANDS 4.1.6 SPLI’ITER ISLANDS
Splitter islands should be provided on all roundabouts. They provide shelter for pedestrians, guide traffic into the roundabout, and deter left turns from dangerous short-cuts through the roundabout.
Splitter islands should be provided on all roundabouts. They provide shelter for pedestrians, guide traffic into the roundabout, and deter left turns from dangerous short-cuts through the roundabout.
34 34
On arterial road roundabouts, the splitter islands should be of sufficient size to shelter a pedestrian and be a reasonable target to be seen by approaching traffic.
A long length of curve on the approach island allows drivers to more easily recognize the degree of curvature ahead. This is particularly so on divided roads and when approach speeds are high. However, care should be taken not to provide unnecessarily large radius curves as this could encourage high speeds through the roundabout.
The entry and exit curves from a roundabout form the spitter island envelope. Pavement markings and a raised island should be constructed within the spitter island envelope as shown in Figure 4.2.
In high speed areas the splitter island should be relatively long (200 feet 2) to give early warning to drivers that they are approaching an intersection and must slow down. Preferably the splitter island and its approach pavement markings should extend back to a point where drivers would be expected to normally start to reduce their speed. The lateral restriction and funnelling provided by the splitter island encourages speed reduction as vehicles approach the entry point. Curbs should be placed on the right-hand side for at least half the length of the splitter island to strengthen the funnelling effect. See Figure 4.5.
Typically 65’ to 100’ diameter
36 ’ 4.1.7 DEFLECTION
Adequate deflection of the vehicle entering a roundabout is the most important factor influencing their safe operation. Roundabouts should be designed so that the speed of all vehicles is restricted to less than 30 MPH within the roundabout. This is done by adjusting the geometry of the entry and by ensuring that “through” vehicle paths are significantly deflected by one or more of the following means:
l The alignment of the entry and the shape, size and position of approach splitter
islands (see Figure 4.6);
l Provision of a suitable size and position of central island;
l Introduction of a staggered or non-parallel alignment between any entrance and exit.
Deflection at Roundabouts with one Circulating Lane
The maximum desired “Design Speed” is obtained if no vehicle path (assumed 7 feet wide) has a radius greater than 430 feet. This radius of curvature corresponds approximately to a vehicle speed of 30 MPH assuming a sideways force of 0.2 g. The required deflection for a si.ngle lane roundabout is shown in Figure 4.7.
Deflection at Roundabouts with two or three Circulating Lanes
For multi-lane roundabouts (two or three circulating lanes), it is generally difficult to achieve the full deflection recommended above for single lane roundabouts. Where this is the case, it is acceptable for the deflection to be measured using a vehicle path illustrated in Figure 4.8. This differs from that used at single lane roundabouts in that the fastest (maximum radius) vehicle path is assumed to start in the right entry lane, cut across the circulating lanes and pass no closer than 5 feet to the central island before exiting the roundabout in the right lane.
Deflection at Roundabouts for various desim speeds
For most state highway applications, design of the entries for 25-30 MPH deflection is acceptable. However, on minor state roads, county roads, and local roads, the designer may wish to create a slower entry condition. The following table illustrates the deflection curve for different entry conditions.
1
I
11
1 De yii 1 Deflec~tiCurve 1
20 180
25 290
30 430
. Table 4.1 Deflection Curve Radii
4.1.8 SIGHT DISTANCE
Several sight distance criteria should be applied to the combination of vertical and horizontal geometries at roundabouts. Those criteria which greatly influence the safety performance of a roundabout and also affect the positioning of signs and landscaping etc., are illustrated in Figure 4.9.
Criterion 1
The alignment on the approach should be such that the driver has a good view of both the splitter island, the central island and desirably the circulating carriageway. Adequate approach stopping sight distance should be provided, to the “Yield” lines and, as an absolute minimum, to the nose of the splitter island.
a) By Central
Island
I) Wlthout ‘blisters’
Low speed (<35 mph) Urban local streets
2) Wlth ‘blisters’
(Preferred treatment)
(when disturbance of exlstlng
curbs Is to be avolded)
430’ radius
cl By Entry
Roadway
Alignment
and Posltlon
of Splitter
Islands
FIGURE 4.6 Alternative methais for providing vehicle defection (not to scale)
Table 4.1 indicates the required approach sight distances.
Approach Speed Stopping
(MPH) Distance* (ft) 25 98 31 131 37 180 43 230 50 344 56 426 62 525 68 623 75 754 * measured 4.0 ft to zero
TABLE 4.2 Approach Sight Distance (ID) Criterion 2
A driver, stationary at the “yield” line, should have a clear line of sight to approaching traffic entering the roundabout from an approach immediately to the left, for at least a distance representing the travel time equal to the critical acceptance gap. A critical gap value of 5 s, giving a distance of 225 feet, (based on an entry speed of 30 MPH), would be typical for arterial road roundabouts operating with low circulating flows. At sites with higher circulating flows or in local streets, criterion 2 sight distance could be based on a critical gap of 4 s.
The criterion 2 sight distance should also be checked in respect to vehicles in the circulating roadway having entered from other approaches. The speed of these vehicles can be expected to be considerably less than 30 MPH and the corresponding sight distance to them (e.g. across the central island) should also be based on a critical gap of 4 s to 5 s. This represents a distance much less than 225 ft because of the low circulating speed of these vehicles. This is illustrated in Figure 4.9.
Criterion 3
It is also desirable that drivers approaching the roundabout are able to see other entering vehicles well before they reach the “yield” line. The 125 ft - 225 ft sight triangle shown in Figure 4.9 allows an approaching driver, slowed to 30 MPH, time to stop and avoid a vehicle driving through the roundabout at 30 MPH. It is desirable that this sight triangle be achieved, although in urban areas it may not always be possible. At roundabouts, the speed of vehicles is more controlled in the circulating roadway than on the approaches and if Criterion 3 sight distance is available to an approaching driver then any circulating driver in this zone would also be able to see an approaching vehicle.
Note that within the zones subject to Criteria 2 and 3, it is acceptable to allow momentary sight line obstructions such as poles, sign posts and narrow tree trunks.
m
CRITERION 2 (essential) 1 1111
%%%staod % 5s gap and 30 mph for arterialroads 115’based on 5s gap for local roads.
Provide adequate sight distance for drivers to detect occsptablc
I II
CRITERION 2
Sight dist-based an 4s to 5s gap and max ri ht tun circulotlng speed (1 3 mph
to 20 mph t pical far at&al road8. 4s 7 ap and g nrph to 10 mph for ocal roads).
CRITERION 3 /
Provide sight triangle to allow comfortable race I? nitiin conf of potentid ct. (desirable) ’ CRITERION 1
Provide CQproach Sit Distance
FIGURE 4.9 Sight distance requirements
4.1.9 OTHER VISIBILITY CONSIDERATIONS
At any roundabout, designers must provide the sight distance quantified and described above. A driver must also be provided with sufficient visibility to readily assess the driving task. The sight distance required for this is not precisely quantified and only general guidance can be given.
To enhance the prominence of the roundabout, the curbs on both the splitter island and central island may be light colored or painted white. To improve driver recognition, the central island may be mounded and/or reflectorized chevron pavers may be used, provided the overall height does not obstruct visibility or hide the drivers view of the overall layout. As with other types of channelization, it is better to position a roundabout in a sag vertical curve rather than on a crest. Unlike other cross intersections, roundabouts require all drivers to change their path and speed, thus it would be important to avoid locating roundabouts just over a crest where the layout is obscured from the view of approaching vehicles.
At grade separated roundabouts, particularly where there may be a structure in the central island or a bridge railing which might obstruct a drivers’ visibility, care must be taken to ensure that the sight distance requirements are met. Any guard fences used to protect piers and structures may also interfere with visibility.
Where there is a light rail crossing incorporated in to the roundabout, care needs to be taken to ensure that the negotiation speeds are slower and that drivers are aware of the presence and the location of the rail tracks.
Light rail can be successfully incorporated into a roundabout. As the tracks will pass through the central island, eliminating part of it, care needs to be taken to ensure that residual central island remains large enough to be recognized.
4.1.10 SUPERELEVATION AND DRAINAGE
Normal curve superelevation through the roundabout is generally not necessary as speeds are constrained and drivers tolerate higher values of the sideways force and utilize higher values of the coefficient of sideways friction when travelling through an intersection.
Above all, it is important that the layout of the roundabout be clearly visible to approaching drivers and this is best achieved by sloping the crossfall away from the central island. This generally means accepting negative superelevation for left turning and through vehicles in