2018
Big data driven diagnostics for intelligent
transportation systems
Tingting Huang Iowa State University
Follow this and additional works at:https://lib.dr.iastate.edu/etd
Part of theCivil Engineering Commons, and theStatistics and Probability Commons
This Dissertation is brought to you for free and open access by the Iowa State University Capstones, Theses and Dissertations at Iowa State University Digital Repository. It has been accepted for inclusion in Graduate Theses and Dissertations by an authorized administrator of Iowa State University Digital Repository. For more information, please [email protected].
Recommended Citation
Huang, Tingting, "Big data driven diagnostics for intelligent transportation systems" (2018).Graduate Theses and Dissertations. 17211. https://lib.dr.iastate.edu/etd/17211
Big data driven diagnostics for intelligent transportation systems by
Tingting Huang
A dissertation submitted to the graduate faculty in partial fulfillment of the requirements for the degree of
DOCTOR OF PHILOSOPHY
Major: Civil Engineering (Transportation Engineering)
Program of Study Committee: Anuj Sharma, Major Professor
Christopher Day Jing Dong William Meeker
Soumik Sarkar
The student author, whose presentation of the scholarship herein was approved by the program of study committee, is solely responsible for the content of this dissertation. The
Graduate College will ensure this dissertation is globally accessible and will not permit alterations after a degree is conferred.
Iowa State University Ames, Iowa
2018
TABLE OF CONTENTS
Page
TABLE OF CONTENTS ... ii
LIST OF FIGURES ... iv
LIST OF TABLES ... vii
ACKNOWLEDGMENTS ... viii
ABSTRACT ... ix
CHAPTER 1. INTRODUCTION ... 1
1.1 Background ... 1
1.2 Research Objectives ... 3
1.2.1 Research question 1: How to diagnose anomalies from system-wide perspective? ... 3
1.2.2 Research question 2: What are missing in current signal performance diagnosis and how to fill in them?... 4
1.2.3 Research question 3: How to diagnose the crash risk in current traffic condition? ... 4
1.3 Dissertation Organization ... 5
1.4 References ... 5
CHAPTER 2. ANOMALY DIAGNOSIS FOR HIGHWAY SYSTEM WITH DATA MINING APPROACH ... 8
Abstract ... 8
2.1 Introduction ... 9
2.2 Methodology ... 12
2.2.1 Spatiotemporal Pattern Network (STPN) ... 12
2.2.2 Mutual Information based Metric... 16
2.2.3 Structural Similarity ... 17 2.3 Problem Formulation ... 18 2.3.1 Data Preparation ... 19 2.3.2 Symbolization ... 20 2.3.3 STPN Evaluation ... 21 2.4 Results Discussion ... 24
2.4.1 Events: Adverse Weather and Crash ... 25
2.4.2 Anomaly in Weekends ... 26
2.5 Additional Study ... 27
2.5.1 Comparison with Original Information Similarity ... 27
2.5.2 Generalizability Analysis ... 30
2.6 Conclusions and Future Work ... 31
CHAPTER 3. PERFORMANCE DIAGNOSIS FOR TRAFFIC SIGNAL WITH
ADVANCED DATA ANALYTICS ... 36
Abstract ... 36
3.1 Introduction ... 37
3.2 Literature Review ... 38
3.3 Problem Identified and Diagnosis Methods ... 41
3.4 Data Description ... 42
3.5 Results ... 45
3.5.1 Sensor and Communication Health ... 45
3.5.1.1 Logging Failures ... 45 3.5.1.2 Sensor Errors ... 49 3.5.2 Demand Assessment... 51 3.5.3 Control Support ... 54 3.6 Conclusions ... 56 3.7 References ... 57
CHAPTER 4. HIGHWAY CRASH DETECTION AND RISK ESTIMATION USING DEEP LEARNING ... 60
Abstract ... 60
4.1 Introduction ... 60
4.2 Methodology ... 65
4.2.1 Artificial Neural Network ... 65
4.2.1.1 Weight and Bias ... 66
4.2.1.2 Activation ... 66
4.2.1.3 Loss Function ... 67
4.2.1.4 Backpropagation ... 68
4.2.2 Convolutional Neural Network ... 69
4.3 Data Description and Preprocessing ... 70
4.3.1 Crash Data from Traffic Management Centers Reports ... 70
4.3.2 Traffic Data from Radar Sensors... 71
4.3.5 Dataset Generation ... 74
4.4 Experimental Results ... 76
4.4.1 Crash Detection ... 76
4.4.1.1 Model Structure and Performance ... 76
4.4.1.2 Model Test Cases ... 85
4.4.1.3 Model Capacity and Data Size ... 89
4.4.2 Crash Risk Prediction ... 91
4.5 Conclusions ... 102
4.6 References ... 103
CHAPTER 5. CONSOLIDATED CONCLUSIONS ... 107
APPENDIX A. DETECTION PERFORMANCE BY TIME... 109
LIST OF FIGURES
Page
Figure 2.1 Extraction of atomic patterns and relational patterns of STPN ... 16
Figure 2.2 Construction of STPNs for anomaly detection from daily traffic data ... 18
Figure 2.3 Location of studied sensors on I-35/80 westbound ... 19
Figure 2.4 Traffic data partitioning via LOS rules ... 21
Figure 2.5 Information based metrics ... 22
Figure 2.6 Average SSIM from STPN in each day ... 23
Figure 2.7 Average SSIM from STPN by day of week ... 24
Figure 2.8 LOS heat map from the traffic system in each day ... 25
Figure 2.9 Comparison of average SSIM from STPN and LOS... 28
Figure 2.10 Comparison of SSIM distributions from STPN and LOS ... 29
Figure 2.11 Additional case: comparison of average SSIM from STPN and LOS ... 30
Figure 3.1 Studied intersections layout ... 43
Figure 3.2 Spurious inactivity assessment ... 48
Figure 3.3 Missing event assessment ... 49
Figure 3.4 Sensor quality performance ... 50
Figure 3.5 Procedures for determining the need of coordination ... 52
Figure 3.6 Proposed APCD features ... 55
Figure 4.1 ANN model structure (illustration) ... 65
Figure 4.2 Convolutional feature extraction ... 70
Figure 4.3 Crash duration distribution in study area and period ... 71
Figure 4.4 Locations of Wavetronix sensors along Interstate 235 ... 72
Figure 4.6 Sample generation for different cases (1 detection case, 3 prediction
cases) ... 75
Figure 4.7 Model 1 structure and variant. ... 77
Figure 4.8 Model 1 performance comparison ... 78
Figure 4.9 Model 1 training loss ... 78
Figure 4.10 Model 2 and Model 3 structure ... 79
Figure 4.11 Model 2 and Model 3 performance comparison ... 80
Figure 4.12 Model 2 and Model 3 training loss ... 80
Figure 4.13 Model 4 and Model 5 structure ... 81
Figure 4.14 Model 4 and Model 5 performance comparison ... 81
Figure 4.15 Model 4 and Model 5 training loss ... 81
Figure 4.16 Model 5 performance comparison ... 82
Figure 4.17 Model 5 training loss ... 82
Figure 4.18 Model 6 structure ... 83
Figure 4.19 Model 5 and Model 6 performance comparison ... 83
Figure 4.20 Detection test cases from best deep model ... 85
Figure 4.21 Detection performance on different temporal cases ... 89
Figure 4.22 Performance comparison with different data size ... 90
Figure 4.23 Training loss comparison with different data size ... 90
Figure 4.24 Model 1, Model 2 and Model 3 structure ... 92
Figure 4.25 Model 1, 2 and 3 performance on different prediction cases ... 93
Figure 4.26 Model 1, 2 and 3 training loss (case 1 as example) ... 94
Figure 4.27 Model 4, Model 5 and Model 6 structure ... 94
Figure 4.28 Model 4, 5 and 6 performance comparison on different prediction cases .... 95
Figure 4.30 Model 7 structure ... 96
Figure 4.31 Performance of Model 4_1, 4_2 and 7 on different prediction cases. ... 97
Figure 4.32 Training loss of Model 4_1, 4_2 and 7 (case 1 as example) ... 98
LIST OF TABLES
Page
Table 2.1 Freeway LOS Criteria ... 21
Table 2.2 Number of crashes by date from event reports ... 26
Table 3.1 Traffic signal decision support queries that could be better addressed by ITSPM ... 42
Table 3.2 Studied phases and detector information ... 43
Table 3.3 Event-based signal and detector data description (partial) ... 44
Table 3.4 Sample of event-based signal and detector data ... 44
Table 4.1 A sample data of TMC crash reports ... 71
Table 4.2 Number of samples in each dataset ... 76
Table 4.3 Overview of deep models on detection experiments ... 76
Table 4.4 Deep model performance on crash detection ... 84
Table 4.5 Shallow model performance on crash detection* ... 85
Table 4.6 Overview of deep models on prediction experiments ... 92
Table 4.7 Deep model performance on crash risk prediction ... 99
ACKNOWLEDGMENTS
I would like to thank my advisor, Dr. Sharma, for all the supports and guidance to my research. I want to thank my committee members, Dr. Sarkar, Dr. Dong, Dr. Day and Dr. Meeker, for giving their time and expertise throughout the course of this research. I would also like to thank my friends and colleagues in Institute for Transportation, who are helping me in both work and life.
In addition, I would like to thank my parents for their unconditional love and support. And a special appreciation to my husband, Dr. Wang, for always being supportive in my life.
ABSTRACT
In Intelligent Transportation System (ITS), the emergence of big data
technologies makes a wide variety of data being collected and accessed possible. With these multi-source traffic data available, an intelligent diagnosis for the transportation system is feasible and necessary. This dissertation explores several data-driven methods for three types of system diagnosis: a) anomaly diagnosis for highway system, b) performance diagnosis for signalized intersection, and c) crash detection and risk diagnosis for real-time traffic conditions.
The first study focuses on the system health and proposes a systematic data mining technique to diagnose highway system anomalies in a batch-processing fashion. Built on the concepts of symbolic dynamics, a spatiotemporal pattern network (STPN) architecture is developed to capture the system characteristics. This novel spatiotemporal graphical modeling approach is shown to be able to extract salient time series features and discover spatial and temporal patterns for a traffic system, which could provide anomaly diagnosis for highway system.
The second study focuses on system efficiency. To improve the efficiency in signalized intersection system, this study addresses some shortcomings in current automated traffic signal performance measures (ATSPM), which lack of data quality control, demand pattern assessment, and intelligent control support. This study proposes a data-driven intelligent traffic signal performance measures (ITSPM) embedding machine learning method and data visualization to diagnose the system performance.
The last study focuses on system safety. This study proposes a deep learning approach to identify crashes from traffic characteristics. Several deep neural network
structures and training operation combinations are examined and applied to achieve higher classification performance. By predicting the probability of a crash on highway traffic, this study helps to diagnose the risk in the system based on big traffic data.
Overall, this dissertation studies on different data-driven methods to diagnose the transportation system regarding system health, efficiency and safety, contributes to the solutions of transportation system diagnostic problem with big data in ITS, provides decision support for practitioners.
CHAPTER 1. INTRODUCTION
1.1 Background
With rapidly growing applications of information technology in Intelligent
Transportation System (ITS), various traffic data from multiple sources become available, which provides researchers both opportunities and challenges. These traffic data could range from traffic flow data from highway system to control data from signalized intersections. How to better utilize this heterogeneous information, uncover the hidden patterns, diagnose the system regarding the system health, efficiency and safety is critical.
There have been a lot of studies conducted in different aspects of diagnosing the transportation system. Since system health is important to both planners and road users, many studies (Chakraborty et al., 2017, Margreiter, 2016, Tang and Gao, 2005, Jin and Ran, 2009) have been done in detecting incidents to monitor the system health. Some traditional methods, including fixed or dynamic thresholding, traffic flow fundamental diagram implementation, etc., have been widely used. Besides those techniques in transportation engineering, many machine learning algorithms are also applied to detect the incidents and diagnose the system health (Chen and Wang, 2009, Yuan and Cheu, 2003, Yao et al., 2014, Li et al., 2016, Kim and Wang, 2016). These applications of machine learning have the advantage in mining the large amount of data, which motivates this research of anomaly diagnosis for highway system with big data driven approach.
System efficiency is also critical, especially in signalized networks. Currently, there are more than 300,000 traffic signals the operation, and the performance of most signals is assessed through citizen complaints (Federal Highway Administration, 2017). This
has been done (Smaglik et al., 2007, Urbanik et al., 2006, Day et al., 2008) and an automated traffic signal performance measures (ATSPMs) tool has been developed (Taylor, 2016), which equips traffic signal controllers with high-resolution data-logging capabilities to generate performance measures. However, there are still some shortcomings in this state-of-practice tool, which involve a lack of data quality control and the extent of resources required to properly use the tool for system-wide management. This motivates a study of improving the current tool with advanced data analytic to better diagnose the performance.
In transportation system, safety is the major concern for both agencies and road users. Early identification of crash could help engineers to take fast action to reduce further
damages. With the emergence of artificial intelligence and availability of massive traffic data, many researchers have applied machine learning algorithm to recognize traffic incident features and identify crashes (Koesdwiady et al., 2016, Nassiri et al., 2014, Pereira et al., 2013). These applications are good examples of machine learning in transportation safety, which motivate the study of deep learning in crash risk diagnosis using big traffic data.
Big data analytics is trending with the growing power of data collection, storage and computation. Big data could refer to data with large volume, variety and velocity. In
transportation industry, high-resolution, large volume, and large-scale traffic data can be obtained or accessed now by many agencies. In this research, data are extracted from a database with about 500 roadside radar sensors managed by Iowa Department of
Transportation (DOT), which is a real-time data collection in every 20 seconds and growing over 15 GB every month. Two-year historical data cumulated to 360 GB which is a large volume that traditional method cannot handle. Thus, big data techniques have been used to accomplish the tasks of data acquisition, storage and processing.
In this study, data are downloaded through vendor’s secured link in near real-time and stored in Hadoop distributed file system (HDFS) in high-performance cluster (HPC). Since the raw data is unstructured and in a large volume, MapReduce technique is implemented in Hadoop framework to perform parallel processing of big data.
1.2 Research Objectives
The objective of this research is to provide big data driven methods to diagnose the system in three aspects: anomalies, performance and crash risk. This research contains three studies and will answer the following research questions.
1.2.1 Research question 1: How to diagnose anomalies from system-wide perspective? Traffic systems are complex, interactive and dynamic. Both temporal and spatial relationships that exist among multiple attributes and different sub-systems in a traffic system need to be extracted for effective performance monitoring. From a traffic operation
perspective, establishing a reliable and intelligent transportation system could benefit both system planners and users, who relies highly on data.
The first study proposes a systematic data mining technique to detect traffic system-level anomalies in a batch-processing fashion. Built on the concepts of symbolic dynamics, a spatiotemporal pattern network (STPN) architecture is developed to capture the system characteristics. An information-theoretic metric is used to quantify the causal relationships between sub-systems. By comparing the structural similarity of the information-theoretic metrics of the STPNs learnt from each day, a day with anomalous system characteristics can be identified.
1.2.2 Research question 2: What are missing in current signal performance diagnosis and how to fill in them?
Current signal performance diagnosis is conducted in the tool named automated traffic signal performance measures (ATSPMs), which is an effort to equip traffic signal controllers with high-resolution data-logging capabilities to generate performance measures. These measures allow practitioners to improve operations and to maintain and operate their systems in a safe and efficient manner. However, there are three main shortcomings of the tool: (i) The tool currently uses raw data feeds but has very little data quality control or quality checks in place, (ii) using the tool for system-wide management is resource intensive, and (iii) the tool’s primary focus is automobile traffic, and it fails to address multi-modal aspects of signal operation.
The second study extends the state-of-art by the creation of a new tool called the Intelligent Traffic Signal Performance Measurement System (ITSPM). Instead of primarily automating the signal performance calculation from a raw data stream, this tool uses machine learning techniques, traffic flow theory, and data-driven intelligence to provide additional insights to decision makers. Three primary enhancements are provided to address the above-reported shortcomings of the existing state-of-the-art tool.
1.2.3 Research question 3: How to diagnose the crash risk in current traffic condition? Through massive traffic data, quickly and accurately identifying crashes is a
challenge, which would also benefit the traffic incident management by providing confident early detection. The third study proposes a deep learning approach to identify crashes and estimate the risk from traffic conditions. The deep learning method has the capability to explore various data, including vehicle speed, volume and sensor occupancy, to learn the features of crash-prone traffic condition. Several deep neural network architectures are
examined and compared with traditional shallow models. By predicting the probability of crash occurrence, this study helps to diagnose the crash risk in the system based on current traffic condition.
1.3 Dissertation Organization
This dissertation is organized in a manuscript-based format, consisting of 3 papers that address the research questions and achieve the research objective accordingly. Chapter 2 reviews previous methods on highway system anomaly diagnosis, proposes an unsupervised learning method to detect system anomalies and conducts a case study on a highway corridor with real-world traffic data. This chapter focuses on system health and addresses research question 1. Chapter 3 improves the state-of-practice signal performance system by deeper exploring the control data from two intersections and applying data mining techniques. This chapter focuses on system efficiency and addresses research question 2. Chapter 4 uses deep learning methods to detect crashes and estimate the risk of traffic data, which extracts the features in traffic flow characteristics to classify the incidents. This chapter focuses on system safety and addresses research question 3. Chapter 5 concludes the dissertation with research findings, limitations and future works.
1.4 References
Chen, S., & Wang, W. (2009). Decision tree learning for freeway automatic incident detection. Expert Systems with Applications, 36(2, Part 2), 4101–4105.
doi.org/10.1016/j.eswa.2008.03.012
Chakraborty, P., Hess, J. R., Sharma, A., & Knickerbocker, S. (2017). Outlier mining based traffic incident detection using big data analytics. Presented at the Transportation Research Board 96th Annual Meeting, January 8-12, Washington, D.C. Retrieve from https://trid.trb.org/View/1439336
Day, C. M., E. J. Smaglik, D. M. Bullock & J. R. Sturdevant.(2008). Real-Time Arterial Traffic Signal Performance Measures. Joint Transportation Research Program. No. 315. http://docs.lib.purdue.edu/jtrp/315.
Federal Highway Administration. Automated Traffic Signal Performance Measures. Accessed at https://www.fhwa.dot.gov/innovation/everydaycounts/edc4/atspm.cfm Jin, J., & Ran, B. (2009). Automatic freeway incident detection based on fundamental
diagrams of traffic flow. Transportation Research Record: Journal of the Transportation Research Board, 2099, 65–75. doi:10.3141/2099-08
Kim, J., & Wang, G. (2016). Diagnosis and prediction of traffic congestion on urban road networks using Bayesian networks. Transportation Research Record: Journal of the Transportation Research Board, 2595, 108–118. doi:10.3141/2595-12
Koesdwiady, A., Soua, R. & Karray, F. (2016). Improving Traffic Flow Prediction with Weather Information in Connected Cars: A Deep Learning Approach. IEEE Transactions on Vehicular Technology, 65(12), pp.9508-9517.
Li, L., He, S., Zhang, J., & Yang, F. (2016). Bagging-SVMs algorithm-based traffic incident detection. Proceedings of the 16th COTA International Conference of Transportation Professionals, July 6-9, Shanghai, China. doi:10.1061/9780784479896.132
Margreiter, M. (2016). Automatic incident detection based on bluetooth detection in northern Bavaria. Transportation Research Procedia, 15, 525–536.
doi:10.1016/j.trpro.2016.06.044
Nassiri, H., Najaf, P. & Amiri, A.M. (2014). Prediction of roadway accident frequencies: Count regressions versus machine learning models. Scientia Iranica. Transaction A, Civil Engineering, 21(2), p.263.
Pereira, F.C., Rodrigues, F. & Ben-Akiva, M. (2013). Text analysis in incident duration prediction. Transportation Research Part C: Emerging Technologies, 37, pp.177-192. Smaglik E.J., A. Sharma, D.M. Bullock, J.R. Sturdevant, & G. Duncan. (2007). Event-Based
Data Collection for Generating Actuated Controller Performance Measures.
Transportation Research Record, 2035, TRB, National Research Council, Washington, DC, pp.97-106.
Tang, S., & Gao, H. (2005). Traffic-incident detection-algorithm based on nonparametric regression. IEEE Transactions on IntelligentTransportation Systems, 6(1), 38–42. doi:10.1109/TITS.2004.843112
Taylor, M. (2016). Overview of UDOT SPM System. Retrieved from
http://docs.lib.purdue.edu/cgi/viewcontent.cgi?article=1025&context=atspmw Urbanik, T, D. Bullock, L. Head, D. Gettman, R. Campbell, M. Ablett, E. Smaglik, S.
Beaird, J. Yohe & S. Quayle. (2006). Traffic Signal State Transition Logic Using Enhanced Sensor Information. NCHRP 3-66 Final Report, National Academic of Science, Transportation Research Board.
Yao, B., Hu, P., Zhang, M., & Jin, M. (2014). A support vector machine with the tabu search algorithm for freeway incident detection. International Journal of Applied Mathematics and Computer Science, 24(2), 397–404. doi: 10.2478/amcs-2014-0030
Yuan, F., & Cheu, R. L. (2003). Incident detection using support vector machines.
Transportation Research Part C: Emerging Technologies, 11(3), 309–328. doi: 10.1016/S0968-090X(03)00020-2
CHAPTER 2. ANOMALY DIAGNOSIS FOR HIGHWAY SYSTEM WITH DATA MINING APPROACH
Modified from a paper published in the International Journal of Prognostics and Health Management
Tingting Huang, Chao Liu, Anuj Sharma and Soumik Sarkar
Abstract
Traffic dynamics in the urban interstate system are critical in terms of highway safety and mobility. This paper proposes a systematic data mining technique to detect traffic
system-level anomalies in a batch-processing fashion. Built on the concepts of symbolic dynamics, a spatiotemporal pattern network (STPN) architecture is developed to capture the system characteristics. This novel spatiotemporal graphical modeling approach is shown to be able to extract salient time series features and discover spatial and temporal patterns for a traffic system. An information-theoretic metric is used to quantify the causal relationships between sub-systems. By comparing the structural similarity of the information-theoretic metrics of the STPNs learnt from each day, a day with anomalous system characteristics can be identified. A case study is conducted on an urban interstate in Iowa, USA, with 11
roadside radar sensors collecting 20-second resolution speed and volume data. After applying the proposed methods on one-month data (Feb. 2017), several system-level anomalies are detected. The potential causes that include inclement weather condition and non-recurring congestion are also verified to demonstrate the efficacies of the proposed technique. Compared to the traditional predefined performance measures for the traffic systems, the proposed framework has advantages in capturing spatiotemporal features in a fast and scalable manner.
2.1 Introduction
Traffic systems are complex, interactive and dynamic. Both temporal and spatial relationships that exist among multiple attributes and different sub-systems in a traffic system need to be extracted for effective performance monitoring. From a traffic operation
perspective, establishing a reliable and intelligent transportation system could benefit both system planners and users, who relies highly on data. However, because of rapidly growing data, how to efficiently mine the hidden pattern of those data and further monitoring the health of the system becomes important.
In transportation research, many studies have been done in detecting incidents. Margreiter (2016) used Bluetooth reidentification techniques to estimate travel time and further detected congestion/incident by a thresholding method. The authors used 80 km/h as speed threshold for warning and combined both number of warnings and 60 km/h speed threshold to detect incidents. Besides the simple fixed thresholding method, some other statistical method was also employed. Chakraborty, Hess, Sharma and Knickerbocker (2017) used an outlier-based method to explore more from historical data then set up a dynamic threshold of speed for detection. Other than threshold-based method, Tang and Gao (2005) proposed a combined method of the nonparametric regression and standard deviation algorithm to detect incidents and tested it in simulation. Jin and Ran (2009) utilized the fundamental diagrams in traffic flow theory to identify the freeway incidents and improved it by introducing uncongested and congested regime shifts in the diagrams.
As artificial intelligence was applied widely in recent decades, there have been also many machine learning methods applied in traffic incident detection. Many techniques like decision tree, support vector machine (SVM) and neural network were practiced. Chen and Wang (2009) used traffic volume, speed, vehicle headway and sensor occupancy data to
implement decision tree learning and tested it in a simulated environment. Regarding SVM, Yuan and Cheu (2003) used two different non-linear kernel SVMs to train and test in simulated incidents data. To optimize the parameters for SVM, Yao, Hu, Zhang and Jin (2014) employed the tabu search algorithm to achieve more accurate classification.
Moreover, Li, He, Zhang and Yang (2016) proposed a bagging SVM for classifying highway incidents. They bootstrapped several subsets to train SVMs, then used majority voting to ensemble them. Another research done by Kim and Wang (2016) used Bayesian networks to detect and predict highway congestion. Besides the traffic flow characteristics like speed and volume of the flow, they also used weather condition and time of day as inputs.
There are also many studies utilizing neural network to identify the incidents. Ritchie and Cheu (1993) used traffic data from simulation and train a multi-layer neural network to detect freeway incidents. To improve the detection performance, Abdulhai and Ritchie (1999) then applied a modified form of Bayesian-based neural network and achieved faster training and higher performance than previous architecture. Further, Adeli and Karim (2000) proposed a fuzzy-wavelet radial basis function neural network to classify the incidents, it also achieved high detection rate and low false alarms in both real world and simulated data.
However, these previous machine learning methods adopted in transportation area tend to be supervised learning, which requires expensive labeled data and more variables to train the model. Moreover, the common objective of these research is still trying to detect isolated incident at traffic operation level, which is finding the location and time of an
incident. In terms of system-wide anomaly, they might ignore other factors resulting in traffic pattern changes, such as adverse weather condition.
This work aims to use an unsupervised learning method to detect anomalies from a system-wide perspective. The motivation of system-wide anomaly detection is that an event occurrence may not always lead to a severe impact on system. Thus, it is important to build a health monitoring process that focuses on the system dynamics, in this case, the traffic flow dynamics. The approach in this work is intended to capture system-wide anomalies, other than the events that only affect the local dynamics, and this kind of method is more robust with noise and disturbances in the system.
To achieve an unsupervised, systematic learning, we apply a novel data-driven method based on spatiotemporal pattern network (STPN). This framework has been successfully applied in solving different real-world engineering problems. For example, STPN has been used for bridge damage detection in structural health monitoring (Liu, Gong, Laflamme, Phares, & Sarkar, 2017). Researchers proposed an approach based on STPN to extract patterns from dense sensor network and applied it on damage detection in a small bridge network. Results showed that the approach could capture the spatiotemporal features, localize the damage and it can be implemented in real-time. Another application of STPN framework is wind turbine power prediction (Jiang, Liu, Akintayo, Henze, & Sarkar, 2017). Researchers used STPN models to extract spatiotemporal features and capture causal dependencies. They also predicted the power for one wind turbine based on the observation from another wind turbine and achieved a high degree of accuracy. Moreover, one research (Liu, Huang, Zhao, Sarkar, Vaidya, & Sharma, 2016) has been done using STPN to explore traffic dynamics on an interstate, which demonstrates a good application of STPN in traffic system.
This study applies a novel framework, the spatiotemporal pattern network, to detect the traffic system anomaly. In contrast with the traditional transportation research methods, it captures the spatiotemporal features of traffic flow and discovers the causal relationships between the sub-systems. Also, it only learns from data instead of using traditional predefined measures, which helps mitigate the impacts from arbitrary rules. Besides, compared to the machine learning methods used previously, it is also fast and easy to implement without the need of expensive labeled data. In addition, it does not involve much site-specific information, which makes it more scalable.
In this study, we used the high-resolution, 2-dimensional real historical traffic data over one month from 11 roadside radar sensors on Interstate 35/80 in Des Moines, Iowa. The proposed graphical modeling approach is used to extract the pattern of traffic dynamics and detect the anomalies. Several anomalies are identified, and potential practical causes are also investigated in the case study.
This work could also be extended into an online detection application. Some related work has already been performed by Lin, Liu, Huang, Sarkar and Sharma (2017). Although an online detection is very useful as sending early warnings to road users, there is also a need of extracting long term trend by using batch processing focused on historical data. It is critical to decision-makers examining the different impacts from past events and preparing appropriate reaction plan accordingly.
2.2 Methodology 2.2.1 Spatiotemporal Pattern Network (STPN)
Built on the concepts of Symbolic Dynamics Filtering, a spatiotemporal feature extraction scheme, STPN, is constructed to discover and represent sub-system behavior and causal interactions among the sub-systems (Sarkar, Sarkar, Virani, Ray, & Yasar, 2014; Jiang
& Sarkar, 2015; Liu, Ghosal, Jiang, & Sarkar, 2017). The fundamental concept of STPN, symbolic dynamic filtering, has advantages in extracting features from time series data (Rao, Ray, Sarkar, & Yasar, 2009). It is able to use symbol sequence to approximate a 𝐷-Markov machine to capture the features in the process.
Data abstraction (discretization and symbolization) is the first step to create discrete symbol sequences from continuous data. Thus, the system is analyzed in the symbolic space instead of the continuous space. The discretization and symbolization of time series data is done by partitioning. The general idea of partitioning is, for a given time series data 𝑇 with n samples, transform 𝑇 into symbol sequence 𝑆 with 𝑘 partitions where 𝑘 ≤ 𝑛. There are several partitioning algorithms could be used, such as uniform partitioning (UP), maximum entropy partitioning (MEP), maximum migration partitioning (MMP), symbolic false nearest neighbor partitioning (SFNNP), etc. (Jin, Sarkar, Mukherjee, & Ray, 2009; Sarkar, Srivastav, & Shashanka, 2013; Sarkar & Srivastav, 2016). In this study, since traffic system is closely related to the physical world, to reflect the relationship between traffic data and public knowledge, a customized UP was proposed to transform all the time series into symbol sequences with 6 partitions. The details will be elaborated in case study.
Another assumption in this modeling approach is that we can approximate a symbol sequence as a Markov chain of order𝐷. Thus, a 𝐷-Markov machine (or 𝑥𝐷-Markov machine for multivariate time series) could be built to analyze the temporal features (𝑥𝐷-Markov machine is for extracting spatial features).
A 𝐷-Markov machine is a probabilistic finite state automata (PFSA) using finite history of 𝐷 symbols as one state. It is formally defined as follows (Sarkar et al., 2014).
• 𝑄 is the finite set of states with cardinality |𝑄| ≤ |Σ|𝐷, the states are represented by equivalence classes of symbol strings of maximum length 𝐷
where each symbol belongs to alphabet Σ;
• and 𝛿: 𝑄 × Σ → 𝑄 is the state transition function that satisfies the condition that if |𝑄| = |Σ|𝐷, there exist 𝛼, 𝛽 ∈ Σ and 𝑥 ∈ Σ⋆ such that 𝛿(𝛼𝑥, 𝛽) = 𝑥𝛽 and 𝛼𝑥, 𝑥𝛽 ∈ 𝑄.
where 𝑄 is a non-empty finite set with cardinality |𝑄| ≤ ∞, called set of states; Σ is a non-empty finite set with cardinality |Σ| ≤ ∞, called symbol alphabet; and Σ⋆ is the collection of all finite-length strings with symbols from Σ.
As defined above, a 𝐷-Markov machine estimates the probability of occurrence of a new symbol given the last 𝐷 symbols for one symbol sequence, thus, it can capture the causal effects of one symbol sequence on another symbol sequence (Jiang & Sarkar, 2015).
To determine the cross-dependence, an 𝑥𝐷 -Markov machine is defined as follows (Sarkar et al., 2014).
Let ℳ1 and ℳ2 be the PFSAs corresponding to symbol sequence {𝑠1} and {𝑠2}
respectively. An 𝑥𝐷-Markov machine is defined as a 5-tuple ℳ1→2 ≜ (𝒬1, Σ1, Σ2, 𝛿1, Π̃12)
such that:
• 𝒬1 = {𝑞1, … , 𝑞|𝒬1|} is the state set of symbol sequence {𝑠1};
• Σ1 = {𝜎0, … , 𝜎|Σ1|−1} and Σ2 = {𝜎0, … , 𝜎|Σ2|−1} are the alphabet sets of symbol
sequence {𝑠1} and {𝑠2} respectively;
• 𝛿1: 𝒬1× Σ1 → 𝒬1 is the state transition function that maps the transition in symbol sequence {𝑠1};
• Π̃12 is the symbol generation matrix of size 𝒬1× Σ2; the 𝑖𝑗𝑡ℎ element of Π̃ 12 denotes the probability of finding the symbol 𝜎𝑗 in {𝑠2} while making a transition from the state 𝑞𝑖 in {𝑠1}.
With this setup, STPN is defined as a 4-tuple 𝑊𝐷:
𝑊𝐷 ≡ (𝑄𝐴, 𝑄𝐵, Π𝐴𝐵, Λ𝐴𝐵) (2.1)
such that:
• 𝐴 and 𝐵 are representing two sub-systems (nodes) of STPN; • 𝑄𝐴 and 𝑄𝐵 are the state set correspondingly;
• Π𝐴𝐵 indicates the transition matrix from 𝐴 to 𝐵;
• and Λ𝐴𝐵 is a metric for quantifying the relational pattern from 𝐴 to 𝐵.
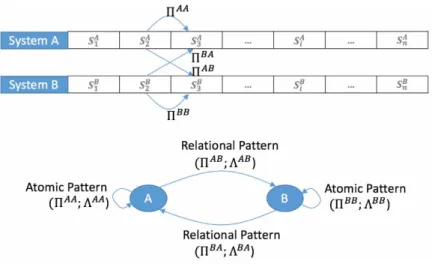
Figure 2.1 demonstrates the structure of STPN model. In Figure 2.1, Π𝐴𝐴 and Π𝐵𝐵 are the transition matrices representing the self-relations for system 𝐴 and system 𝐵
correspondingly, which are also referred to atomic patterns (APs). While Π𝐴𝐵 and Π𝐵𝐴 are the transition metrics reflecting cross relations from 𝐴 to 𝐵 and from 𝐵 to𝐴, which are called relational patterns (RPs). Formally the transition matrix is derived by:
𝜋𝛼𝛽𝐴𝐵≔ 𝑃(𝑆𝑖+1𝐵 = 𝛽| 𝑆𝑖𝐴= 𝛼) ∀𝑖 (2.2)
where 𝛼 ∈ 𝑄𝐴 and 𝛽 ∈ 𝑄𝐵; 𝜋
𝛼𝛽𝐴𝐵 is the probability of transiting from state 𝛼 in system 𝐴 to state 𝛽 in system 𝐵.
Figure 2.1 Extraction of atomic patterns and relational patterns of STPN
The APs intend to extract the state transitions in a sub-system itself, and the RPs describe the state transition from a sub-system to another. Using Equation (2.2), the transition probabilities can be computed and represent the patterns (APs and RPs).
To quantify the APs and RPs in STPN, Λ𝐴𝐵 is defined. Here, an information theoretic metric could be used (Solo, 2008; Wibral, Rahm, Rieder, Lindner, Vicente, & Kaiser, 2011). There are several metrics available, such as transfer entropy and mutual information. In this study, the mutual information (MI) is used.
2.2.2 Mutual Information based Metric
In this study, we define the MI for APs and RPs as follows (RP from system 𝐴 to 𝐵 is used as instance). 𝐼𝐴𝐵= 𝐻(𝑆 𝑖+1𝐵 ) − 𝐻(𝑆𝑖+1𝐵 | 𝑆𝑖𝐴) where 𝐻(𝑆𝑖+1𝐵 ) = − ∑ 𝑃(𝑆𝑖+1𝐵 = 𝛽) 𝑄𝐵 𝛽 𝑙𝑜𝑔𝑃(𝑆𝑖+1𝐵 = 𝛽) 𝐻(𝑆𝑖+1𝐵 | 𝑆𝑖𝐴) = ∑ 𝑃(𝑆𝑖𝐴= 𝛼) 𝑄𝐴 𝛼 𝐻(𝑆𝑖+1𝐵 |𝑆𝑖𝐴= 𝛼)
𝐻(𝑆𝑖+1𝐵 | 𝑆𝑖𝐴= 𝛼) = − ∑ 𝑃(𝑆𝑖+1𝐵 = 𝛽 | 𝑆𝑖𝐴= 𝛼) 𝑄𝐵
𝛽
∙ 𝑙𝑜𝑔𝑃(𝑆𝑖+1𝐵 = 𝛽 | 𝑆𝑖𝐴= 𝛼)
This MI based metric is used to measure the capability of predicting the dynamics of one sub-system from past observations of another sub-system dynamics or itself.
2.2.3 Structural Similarity
In this study, we treat each sensor on the road as one node or sub-system of STPN. Thus, an 𝑁 × 𝑁 MI-matrix (𝑁 is number of sensors) could be obtained to represent the patterns in STPN. As we examine the data in a daily basis, we would obtain 𝑀 MI-matrices in total during study time period (here 𝑀 = 28), and a comparison method is needed. Here we adopt an index called structural similarity (SSIM) from image processing. SSIM (Wang, Bovik, Sheikh, & Simoncelli, 2004) is focusing on the structural information of an image, like the pixels have strong inter-dependencies especially when they are spatially close. Formally it is defined as follows (Wang et al., 2004).
𝑆(𝑥, 𝑦) = (2𝜇𝑥𝜇𝑦+ 𝐶1 𝜇𝑥2+ 𝜇 𝑦 2 + 𝐶 1 ) 𝛼 ( 2𝜎𝑥𝜎𝑦+ 𝐶2 𝜎𝑥2 + 𝜎 𝑦2+ 𝐶2 ) 𝛽 ( 𝜎𝑥𝑦+ 𝐶3 𝜎𝑥𝜎𝑦+ 𝐶3) 𝛾 where
• 𝜇𝑥 and 𝜇𝑦 are the mean of 𝑥 and 𝑦 respectively; • 𝜎𝑥2 and 𝜎
𝑦2 are the variance of 𝑥 and 𝑦 respectively; • 𝜎𝑥𝑦 is the covariance of 𝑥 and 𝑦;
• 𝐶1, 𝐶2, and 𝐶3 are used to stabilize the division if denominator is near 0; • 𝐶1 = (𝑘1𝐿)2, 𝐶
2 = (𝑘2𝐿)2 and 𝐶3 = 𝐶2/2 with 𝑘1, 𝑘2 and 𝐿 being constant; • 𝛼, 𝛽 and 𝛾 are weights for combining those comparative measures with 𝛼,
SSIM measures the local quality/distortion between two images using a sliding window and combines the results to a single value as the index of one image’s quality related to another image (Wang et al., 2004). Although the SSIM index is designed for comparing images, it has been shown to be useful in computing the similarity of features (Liu, Jiang, & Yang, 2014). For our 𝑁 × 𝑁 MI-matrix, which could be treated as images, the SSIM index is efficient in terms of feature extraction and comparison. Here, SSIM index is not related to a specific traffic condition. It is used as a metric to compare the similarity of features
(represented by MI matrix for each day), where a low SSIM index indicates the traffic conditions represented by the MI matrices are different.
2.3 Problem Formulation
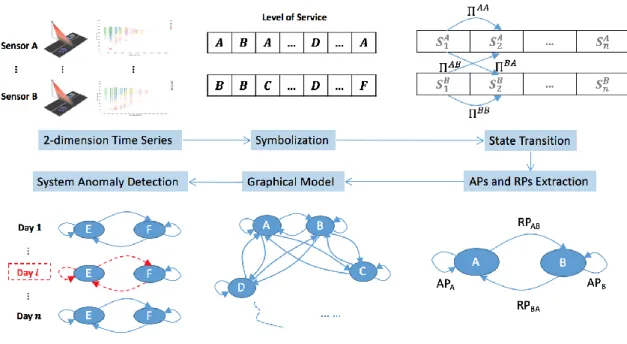
In this study, we utilized real word traffic data from sensors, and applied STPN for anomaly detection. Figure 2.2 depicts the basic work flow.
As shown in Figure 2.2, the multivariate time-series data collected from the sensors are first partitioned into symbols and then state sequences are generated. The state transition matrices are then obtained using 𝐷-Markov machine (𝑥𝐷-Markov machine). The patterns are then evaluated using information-based metric (mutual information in this work) and daily graphical models are formed. The system-wide anomaly affects the patterns (“Day 𝑖” marked at the bottom-left panel) and can be detected through comparing the changes of the mutual information metrics.
2.3.1 Data Preparation
This study used traffic data collected from 11 radar sensors on I-35/80 WB through Des Moines urban area (speed limit is unchanged segment to segment). The location of each sensor is shown in Figure 2.3.
Figure 2.3 Location of studied sensors on I-35/80 westbound
Labeled as order in traveling direction
These sensors are labeled by their orders in terms of traveling direction. Speed and volume data in 20-second intervals were obtained from these sensors. In this case study, we took February 2017 as the study time period.
As the model requires continuity in time series data, we need to preprocess the data when there was no vehicle present. Since this situation happened at night at most times, thus, we excluded night time (11pm-5am) data from the daily data set. For any other missing
values in some sensor, we linearly interpolated the value by using the speed and volume at closest timestamps before and after. However, if a start or end value is missed, the
interpolation will fail. Thus, we also used the smallest overlapping time period in each day with all the sensors available. After the data preprocessing, this system has two-dimensional time series data with 11 nodes for 28 days.
2.3.2 Symbolization
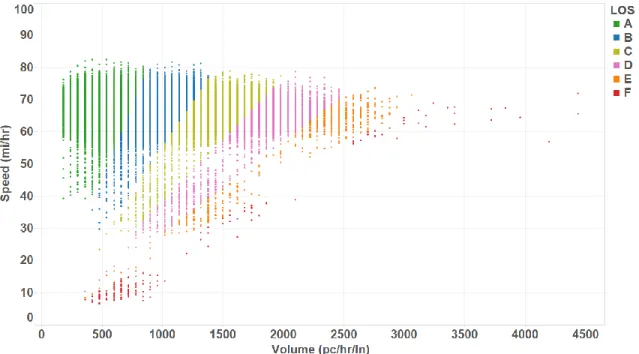
This study uses custom domain knowledge-based partitioning to transform the continuous time-series data into symbol sequence. In Highway Capacity Manual (HCM) (Transportation Research Board, 2000), level of service (LOS) is a quality measure regarding operational conditions under different traffic flows.
There are 6 lettered LOS from “A” to “F”, with “A” representing the best and “F” the worst. Different types of road facilities require different methods to compute LOS. In this study, we employ the method for freeway LOS calculation based on traffic density. The traffic density is defined by the number of passenger cars presenting in one kilometer one lane. The computation of density follows:
𝐷 = 𝑉/𝑆
where V is the flow rate (in pc/hr/ln) and S is the average speed (in mi/hr).
The LOS is determined by the density value. Table 2.1 lists the LOS criteria for basic freeway segments from HCM.
Table 2.1 Freeway LOS Criteria
LOS Density (pc/mi/ln)
A [0, 11] B (11, 18] C (18, 26] D (26, 35] E (35, 45] F (45, maximum]
This LOS-based custom partitioning algorithm is applied on the entire dataset, and the result are illustrated in Figure 2.4. After symbolization, the continuous multivariate time series data are discretized into univariate 6-symbol sequences.
Figure 2.4 Traffic data partitioning via LOS rules 2.3.3 STPN Evaluation
To form the STPN with less complex computation, we treated those symbol
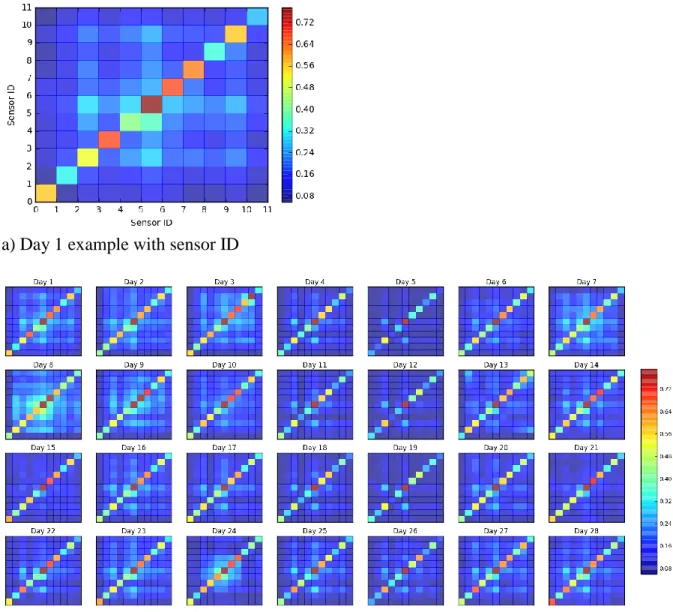
sequences as Markov chains of order 1 and computed the 1-step transition matrices for those chains. To evaluate the connectivity among those sub-systems (i.e. sensors in this case), MI was calculated on those transition matrices. An example of MI results is shown in Figure 2.5.
The Figure 2.5 (a) is just showing the quantification of Day 1’s STPN, in which the darker color represents higher MI between sensors.
a) Day 1 example with sensor ID
b) All days’ presentation
Figure 2.5 Information based metrics
Each block represents the MI between that pair of sensors
The higher value of MI from 𝑎 to 𝑏 indicates the more information obtained in sensor
another. Together they formed the whole metrics of a pattern network, which could reflect the system dynamics.
To efficiently compare those MI-matrices on STPNs, the SSIM is calculated. SSIM is symmetric, which means the SSIM for Day 1 to Day 2 is the same as for Day 2 to Day 1. Since the comparison strategy is sensitive to the baseline selection, in this study, we use the following comparison strategy: for a certain day, calculate all the SSIM indices from this day to the other days, then use the average value as the index for it.
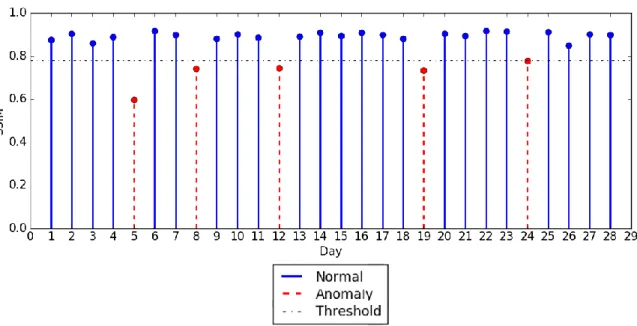
To identify the anomalous days, here we use 85% of the maximum SSIM value as the threshold rather than a percentile thresholding for anomalies. The reason for setting this threshold includes: (i) the SSIM on any anomalous days should be away from the best condition (maximum SSIM); (ii) we should avoid using percentile, which will maintain a fixed portion of days in every month to be anomalies. The results are illustrated in Figure 2.6.
Figure 2.6 Average SSIM from STPN in each day
2.4 Results Discussion
As shown in Figure 2.6, Feb. 5th had a significant drop in average similarity to others. Other days like Feb. 8th, Feb. 12th, Feb. 19th and Feb. 24th also had less similarities. Motivated by the potential day-of-week seasonality (low SSIM on Feb. 5th, 12th, 19th) and a prior knowledge of traffic variation in terms of day of week (especially weekday vs.
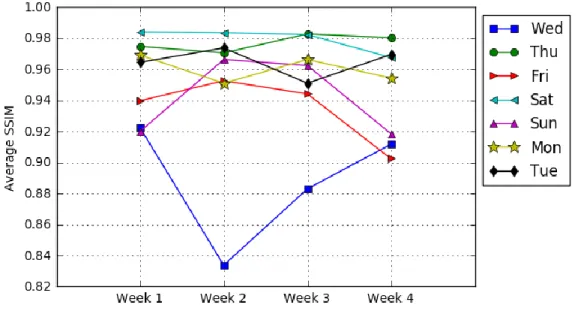
weekend), we further explore the patterns by comparing them at the day of week level. Figure 2.7 shows the average SSIM for each day in day of week level. For example, Wednesday in Week 1 (Feb. 1st) obtained its SSIM index by averaging SSIM indices comparing with all other Wednesdays. Thus, as Figure 2.7 indicates, Wednesdays in the study period show relatively low and diverse SSIM values, and Saturdays have a more stable pattern.
Figure 2.7 Average SSIM from STPN by day of week
To associate the patterns with the real-world situation, a heat map has been generated by using the interpolated data set. Figure 2.8 visualizes the LOS in the whole system every day, by using vertical axis to represent sensors and horizontal axis as time of day.
Figure 2.8 LOS heat map from the traffic system in each day
X-axis represents time of day and y-axis represents sensors
2.4.1 Events: Adverse Weather and Crash
From Figure 2.8, it could be seen that on Feb. 8th (Wednesday, Week 2) and Feb. 24th (Friday, Week 4), there were unusually low LOS present in morning and afternoon peak hours. By checking the historical weather information (Weather Underground, 2017), it shows that there were snowfall events in those two days. Thus, the inclement weather may cause the anomalous pattern in those days since it is reasonable to assume the motorists on highway could be affected by heavy snows.
Another data source that we have access to is the event reports from Iowa DOT Traffic Management Center. Table 2.2 shows the number of events (focused on crash only) on each day in study time period on I-35/80 WB. Here it also shows on Feb. 8th and Feb. 24th, there were 2 and 5 crashes respectively. Therefore, we find that multiple vehicle crashes may contribute in making the system anomalous in those days as well.
Although the weather information and event reports could help us to verify the system anomalies we detected, they could not replace STPN to detect system anomaly directly. The reason why they are not suitable is that bad weather or crashes do not always severely affect the traffic system. For example, in Table 2.2, we could see that on Feb. 25th there were 2 multiple vehicle crashes. However, it still has a relatively high similarity with other Saturdays shown in Figure 2.7 and Figure 2.8 (Saturday, Week 4). The reason could be less volume in the weekend. Note that it is also not identified as a system-level anomaly by the proposed STPN scheme. In this context, STPN shows advantages in detecting the system-wide anomaly for the traffic system with fewer false alarms (the false alarms that may be reported when deploying weather or event information).
Table 2.2 Number of crashes by date from event reports
Event Type 2-1 2-3 2-6 2-7 2-8 2-13 2-21 2-24 2-25
1 Vehicle Crash 1 1 1 2
2 Vehicle Crash 1 1 1 2 2
3+ Vehicle Crash 1 1 1 1
Note that such system-level anomalies arise from a complex combination of multiple factors involving weather, traffic states and incidents that can be highly non-intuitive in nature. Therefore, a multivariate automated feature extraction scheme such as STPN can be more effective compared to a rule-based univariate scheme for real life deployment.
2.4.2 Anomaly in Weekends
As shown in Figure 2.6 and Figure 2.7, Feb. 5th (Sunday, Week 1) had low similarity with all other days and relatively low similarity in Sunday trends. Associated with Figure 2.8, it could be seen that there were no obvious peak hours occurred on Feb. 5th comparing to
other Sundays. This kind of anomaly captured by STPN become more obvious in low traffic volume weekends as the traffic pattern changed.
In addition, there is another relatively low similarity occurred on Feb. 26th (Sunday, Week 4), which is not associated with any obvious physical reason. Because there are only 4 data points in this case study, it is not easy to determine the trend, especially in low volume weekends. Thus, a long-term monitoring of both weekday and weekend trends is needed.
2.5 Additional Study 2.5.1 Comparison with Original Information Similarity
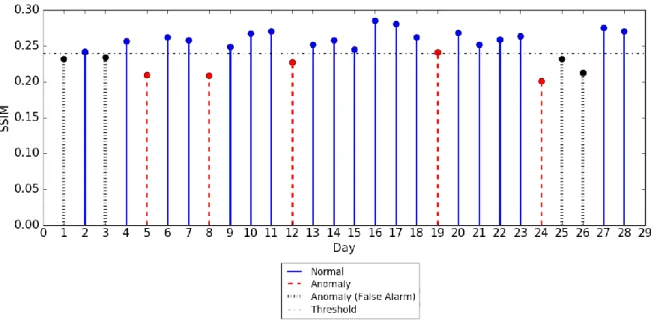
In addition, we also consider if simple image analysis of LOS heat maps (original information without STPN) over different days can be effective in anomaly detection. We compute the SSIM index directly based on the LOS heat maps (Figure 2.8) and use the same averaging and thresholding strategy. The comparison with STPN results is shown in Figure 2.9.
b) SSIM from LOS heat map
Figure 2.9 Comparison of average SSIM from STPN and LOS
Dotted line in b) shows the additional false alarms.
Compared to Figure 2.9 (a), which is obtained from STPN, Figure 2.9 (b) shows more fluctuations. Also, we observe that multiple nominal days and anomalous days are too close around the threshold, which indicates the results tend to be quite sensitive with the threshold. Also, using heat map directly may generate more false alarms.
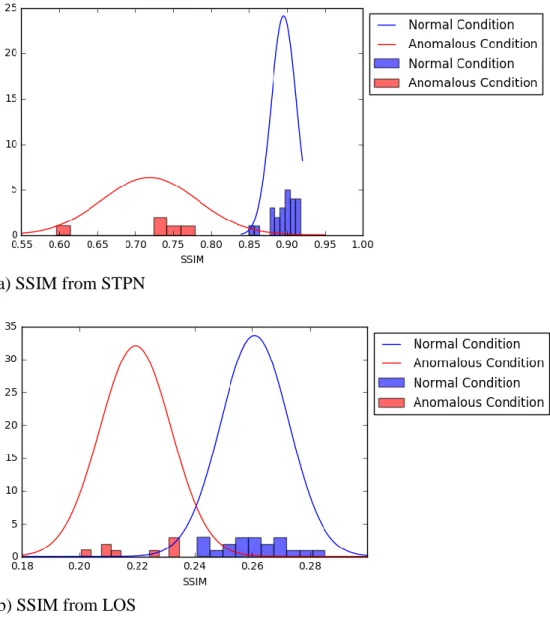
Further investigation is also made regarding the distributions of SSIM under normal and anomalous conditions. Since the sample size is limited, here we assume that the SSIM values follow Gaussian distributions just for illustration purpose. Here we also assume that the severe crash days and weekends have different characteristics than regular traffic flow. Thus, we could illustrate the SSIM distributions based on our benchmark from domain knowledge. Figure 2.10 shows the comparison of SSIM distributions from STPN and LOS heat map.
a) SSIM from STPN
b) SSIM from LOS
Figure 2.10 Comparison of SSIM distributions from STPN and LOS
In Figure 2.10 (a), STPN results show less variance in distribution under normal condition than anomalous condition and two distributions are well separated. Both characteristics are extremely useful for efficient anomaly detection with low false alarm. However, in LOS heat map results (Figure 2.10 (b)), distributions under normal condition and anomalous conditions are not as well separated. This illustrates the need for a
sophisticated scheme such as STPN for detecting traffic system-wide anomalies in a robust fashion.
2.5.2 Generalizability Analysis
One additional case study was also conducted to test the generalizability of this method. Data from the same corridor in January 2017 were used. By using the proposed methodology, Figure 2.11 demonstrates both the SSIM from STPN results and the original LOS information.
a) SSIM from STPN (Additional case)
b) SSIM from LOS heat map (Additional case)
Figure 2.11 Additional case: comparison of average SSIM from STPN and LOS
By checking the weather information (Weather Underground, 2017), those anomaly days (in Figure 2.11(a)) have low visibility with high perception, which impact the driver behaviors more significant than other days. Also, if we simply use the structural similarity method to extract information from original LOS, more variant SSIM values and more false alarms will be generated.
This additional case implied that the proposed method could be easily implemented on other cases without rebuilding model to accommodate any site-specific or time-specific characteristics in transportation system.
2.6 Conclusions and Future Work
This research explored the traffic system dynamics and proposed a health monitoring approach. Built on concepts of symbolic dynamics, a spatiotemporal pattern network
framework was presented to capture the system dynamics, and a mutual information-based metric was used to quantify the causal relationship (atomic pattern and relational pattern) between sensors in the system. To compare the similarity of the information-based metrics of the STPNs and further detect the anomaly, an SSIM measure was adopted to measure the similarity. Based on the assumption that the system-wide anomalies lead to significant variation in the patterns of the STPNs, the less similar patterns were identified as system anomaly.
This study applied the proposed method on one-month traffic data collected from 11 roadside radar sensors along I-35/80 WB in Iowa. By constructing STPN on daily traffic data, and comparing them in day of week level, several system anomalies with low
similarities were detected. Associating weather and incident information, the potential causes of those system were also verified. It shows that the inclement weather and crashes could impact the system dynamics but not necessarily.
This paper employs and customizes the graphical model learning method to solve a traffic system problem. This batch process approach fits the need of long-term traffic pattern extraction and past events impact assessment. Further, it could alarm traffic operation
engineers by identifying which type of events causes traffic pattern change and needs more attention.
In future work, more corridors could be involved. As running on a long-term historical data, the system anomaly could be easily detected by checking how far it is apart from a normal pattern network. Based on this application, a health monitoring framework for the traffic system can be developed. Future research directions will include: (i) analyze the potential causes of system-level anomaly from real world, then set the priority levels for those real-world events; (ii) summarize the anomalies over a long time and further utilize it to evaluate system-level reliability.
2.7 References
Abdulhai, B., & Ritchie, S. G. (1999). Enhancing the universality and transferability of freeway incident detection using a Bayesian-based neural network. Transportation Research Part C: Emerging Technologies, 7(5), 261–280. doi:10.1016/S0968-090X(99)00022-4
Adeli, H., & Karim, A. (2000). Fuzzy-wavelet RBFNN model for freeway incident detection. Journal of Transportation Engineering, 126(6), 464–471. doi:10.1061/(ASCE)0733-947X(2000)126:6(464)
Chakraborty, P., Hess, J. R., Sharma, A., & Knickerbocker, S. (2017). Outlier mining based traffic incident detection using big data analytics. Presented at the Transportation Research Board 96th Annual Meeting, January 8-12, Washington, D.C. Retrieve from https://trid.trb.org/View/1439336
Chen, S., & Wang, W. (2009). Decision tree learning for freeway automatic incident detection. Expert Systems with Applications, 36(2, Part 2), 4101–4105.
doi.org/10.1016/j.eswa.2008.03.012
Jiang, Z., & Sarkar, S. (2015). Understanding wind turbine interactions using spatiotemporal pattern network. Proceedings of the ASME 2015 Dynamic Systems and Control
Jiang, Z., Liu, C., Akintayo, A., Henze, G., & Sarkar, S. (2017). Energy prediction using spatiotemporal pattern networks. Applied Energy, 206, 1022-1039.
doi:10.1016/j.apenergy.2017.08.225
Jin, J., & Ran, B. (2009). Automatic freeway incident detection based on fundamental diagrams of traffic flow. Transportation Research Record: Journal of the Transportation Research Board, 2099, 65–75. doi:10.3141/2099-08
Jin X., Sarkar, S., Mukherjee, K., & Ray, A. (2009) Suboptimal partitioning of time-series data for anomaly detection, Proceedings of Conference on Decision and Control, December 15-18, Shanghai, China. doi:10.1109/CDC.2009.5400158
Kim, J., & Wang, G. (2016). Diagnosis and prediction of traffic congestion on urban road networks using Bayesian networks. Transportation Research Record: Journal of the Transportation Research Board, 2595, 108–118. doi:10.3141/2595-12
Li, L., He, S., Zhang, J., & Yang, F. (2016). Bagging-SVMs algorithm-based traffic incident detection. Proceedings of the 16th COTA International Conference of Transportation Professionals, July 6-9, Shanghai, China. doi:10.1061/9780784479896.132
Liu, C., Ghosal, S., Jiang, Z., & Sarkar, S. (2017). An unsupervised anomaly detection approach using energy-based spatiotemporal graphical modeling. Cyber-Physical Systems, 3(1-4), 66-102. doi:10.1080/23335777.2017.1386717
Liu, C., Gong, Y., Laflamme, S., Phares, B., & Sarkar, S. (2017). Bridge damage detection using spatiotemporal patterns extracted from dense sensor network. Measurement Science and Technology, 28(1), 014011. doi:10.1088/1361-6501/28/1/014011 Liu, C., Huang, B., Zhao, M., Sarkar, S., Vaidya, U., & Sharma, A. (2016). Data driven
exploration of traffic network system dynamics using high resolution probe data. Proceedings of 2016 IEEE 55th Conference on Decision and Control (7629–7634), December 12-14, Las Vegas, NV, USA. doi:10.1109/CDC.2016.7799448
Liu, C., Jiang, D., & Yang, W. (2014). Global geometric similarity scheme for feature selection in fault diagnosis. Expert Systems with Applications, 41(8), 3585–3595. doi:10.1016/j.eswa.2013.11.037
Margreiter, M. (2016). Automatic incident detection based on bluetooth detection in northern Bavaria. Transportation Research Procedia, 15, 525–536. doi:10.1016/j.trpro.2016.06.044 Rao, C., Ray, A., Sarkar, S., & Yasar, M. (2009). Review and comparative evaluation of
symbolic dynamic filtering for detection of anomaly patterns. Signal, Image and Video Processing, 3(2), 101–114. doi:10.1007/s11760-008-0061-8
Ritchie, S. G., & Cheu, R. L. (1993). Simulation of freeway incident detection using artificial neural networks. Transportation Research Part C: Emerging Technologies, 1(3), 203– 217. doi:10.1016/S0968-090X(13)80001-0
Sarkar, S., Sarkar, S., Virani, N., Ray, A., & Yasar, M. (2014). Sensor fusion for fault detection and classification in distributed physical processes. Frontiers in Robotics and AI, 1, 16. doi:10.3389/frobt.2014.00016
Sarkar, S., & Srivastav, A. (2016). A composite discretization scheme for symbolic identification of complex systems. Signal Processing, 125, 156–170.
doi:10.1016/j.sigpro.2016.01.018
Sarkar, S., Srivastav, A., & Shashanka, M. (2013). Maximally bijective discretization for data-driven modeling of complex systems. Proceedings of Americal Control Conference (2674–2679). June 17-19, Washington D.C., USA. doi:10.1109/ACC.2013.6580238 Solo, V. (2008). On causality and mutual information. Proceedings of 2008 47th IEEE
Conference on Decision and Control (4939–4944). December 9-11, Cancun, Mexico. doi:10.1109/CDC.2008.4738640
Tang, S., & Gao, H. (2005). Traffic-incident detection-algorithm based on nonparametric regression. IEEE Transactions on Intelligent Transportation Systems, 6(1), 38–42. doi:10.1109/TITS.2004.843112
Transportation Research Board (TRB). (2000). HCM: highway capacity manual. Washington, D.C., USA: Transportation Research Board.
Wang, Z., Bovik, A., Sheikh, H., & Simoncelli, P. (2004). Image quality assessment: From error visibility to structural similarity. IEEE Transactions on Image Processing, 13(4), 600-612. doi: 10.1109/TIP.2003.819861
Weather Underground (2017, October 10). Weather history for KDSM. Retrieved from: https://www.wunderground.com/history/airport/KDSM/
Wibral, M., Rahm, B., Rieder, M., Lindner, M., Vicente, R., & Kaiser, J. (2011). Transfer entropy in magnetoencephalographic data: Quantifying information flow in cortical and cerebellar networks. Progress in biophysics and molecular biology, 105(1), 80–97. doi:10.1016/j.pbiomolbio.2010.11.006
Wu, L., Liu, C., Huang, T., Sharma, A., & Sarkar, S. (2017). Traffic sensor health monitoring using spatiotemporal graphical modeling. Proceedings of the 2nd ACM SIGKDD
Workshop on Machine Learning for Prognostics and Health Management, August 13-17, Halifax, Nova Scotia, Canada.
Yao, B., Hu, P., Zhang, M., & Jin, M. (2014). A support vector machine with the tabu search algorithm for freeway incident detection. International Journal of Applied Mathematics and Computer Science, 24(2), 397–404. doi: 10.2478/amcs-2014-0030
Yuan, F., & Cheu, R. L. (2003). Incident detection using support vector machines. Transportation Research Part C: Emerging Technologies, 11(3), 309–328. doi: 10.1016/S0968-090X(03)00020-2
CHAPTER 3. PERFORMANCE DIAGNOSIS FOR TRAFFIC SIGNAL WITH ADVANCED DATA ANALYTICS
Modified from a paper accepted by the Transportation Research Record: Journal of the Transportation Research Board
Tingting Huang, Subhadipto Poddar, Cristopher Aguilar, Anuj Sharma, Edward Smaglik, Sirisha Kothuri, and Peter Koonce
Abstract
Automated traffic signal performance measures (ATSPMs) are an effort to equip traffic signal controllers with high-resolution data-logging capabilities and utilize this data to generate performance measures. These measures allow practitioners to improve operations as well as to maintain and operate their systems in a safe and efficient manner. Although these measures have changed the way that operators manage their systems, several shortcomings of the tool, identified by talking with signal operators, are a lack of data quality control and the extent of resources required to properly use the tool for system-wide management. To
address these shortcomings, in this paper intelligent traffic signal performance measurements (ITSPMs) are presented, using the concepts of machine learning, traffic flow theory, and data visualization to reduce the operator resources needed for overseeing data-driven traffic signal management systems. In applying these concepts, ITSPMs provide graphical tools to identify and remove logging errors and data from bad sensors, intelligently determine trends in demand, and address the question of whether coordination may be needed at an intersection. The focus of ATSPMs and ITSPMs on performance measures for multimodal users is identified as a pressing need for future research.
3.1 Introduction
In the United States, more than 300,000 traffic signals are currently in operation. According to the Federal Highway Administration, the operation and performance of most of these signals is assessed through citizen complaints (Federal Highway Administration, 2017). In these settings, agencies are forced to rely on software and simulation models to develop timings, with the presumption that if there are no complaints, everything is working acceptably, often compromising on performance and efficiency.
Automated traffic signal performance measures (ATSPMs) are an effort to equip traffic signal controllers with high-resolution data-logging capabilities and to utilize these to generate performance measures. These measures allow practitioners to improve operations and to maintain and operate their systems in a safe and efficient manner (Federal Highway Administration, 2017). State-of-the-art ATSPM systems primarily present raw data in graphic representations with the goal of providing tools for visual queries to traffic signal experts. The tool has been very useful for data-driven management of traffic signal systems and has been adopted and modified by several agencies. From conversations with several practitioners who use them, the three main shortcomings of the tool are: (i) The tool currently uses raw data feeds but has very little data quality control or quality checks in place, (ii) using the tool for system-wide management is resource intensive, and (iii) the tool’s primary focus is automobile traffic, and it fails to address multi-modal aspects of signal operation.
In this study, the current state of the art is extended by the creation of a new tool called the Intelligent Traffic Signal Performance Measurement System (ITSPM). Instead of primarily automating the signal performance calculation from a raw data stream, this tool uses machine learning techniques, traffic flow theory, and data-driven intelligence to provide additional insights to decision makers. In this paper, three primary enhancements are
provided to address the above-reported shortcomings of the existing state-of-the-art tool, namely:
a. Additional measures for data quality control are provided;
b. Machine learning-based intelligence is provided to deliver initial insights into the data, thus reducing the visual querying time, which results in more efficient utilization of personnel resources;
c. Some of the current graphics in ATSPM are improved to better represent operations at different spatial and temporal resolutions.
Although noted as a shortcoming, multi-modal aspects are not addressed in this paper and will be the focus of future research. The remainder of the paper is presented in the following manner. A literature review and the state of practice are presented next, followed by methodology, data used, and results. The paper then wraps up with conclusions and recommendations.
3.2 Literature Review
The development of ATSPMs began with the collection of event-based data by researchers at Purdue University in the mid-2000s (Smaglik et al., 2007) and the identification of tactical methods to control traffic within NCHRP 3-66 (Urbanik et al., 2006). Since these original works, researchers have emphasized the development of event-based data acquisition systems that have the capability of generating high-level performance measures as well as enough data resolution capable of being used for fault recreation and signal fine tuning (Day et al., 2008). Researchers at Purdue University and University of Minnesota, as well as practitioners at the Indiana and Utah Departments of Transportation spearheaded the effort to move Highway Capacity Manual operational parameters from the post-processed environment to real-time performance measures in a mainstream operational
environment (Taylor, 2016, Liu et al., 2008). Whereas historical performance measure data were limited to hourly volumes, peak hour factors, and v/c values over long analysis periods, these measures use event-based data to empower an agency with the ability to make data-driven decisions regarding detector and communication health, traffic signal coordination, and split efficiency (Day et al., 2014, Day et al., 2015, Bullock et al., 2014, Day et al., 2012). Although this work has been a game changer in the operation and management of traffic signal systems, thus far it has focused mostly on vehicular performance measures with
limited investigation into multimodal performance. One major reason for this limitation is the lack of pedestrian sensing capabilities in existing control systems. The natural platform for this would be an extension of ATSPMs from a multimodal perspective, perhaps
incorporating visualization techniques by the nationally renowned author Edward Tufte (2001). Existing vehicular ATSPMs may also benefit from improved visualization techniques, although the Purdue researchers responsible for much of the ATSPM development work have already spent much effort on visualization (Day et al., 2010, Brennan et al., 2011).
The state-of-practice with respect to ATSPMs involves the use of open source software and continued improvements to visualizations and metrics using advances in data analytics. Several vendors have also engaged in developing similar products. From
conversations with several practitioners who use them, ATSPMs are most often used for troubleshooting, operations, and planning. The AASHTO innovation initiative led by the Utah DOT has led to the adoption of ATSPMs by 26 transportation agencies across the country (Federal Highway Administration, 2017). The open source software used by the Utah DOT produces chart usage reports to track which performance measures and visualizations