UNIVERSITI PUTRA MALAYSIA
NORSIDA BINTI HASAN
IPM 2014 8
MODELING STUDENTS' BACKGROUND AND
ACADEMIC PERFORMANCE WITH MISSING VALUES
©
COPYRIGHT
UPM
MODELING STUDENTS’ BACKGROUND AND
ACADEMIC PERFORMANCE WITH MISSING VALUES
USING CLASSIFICATION TREE
By
NORSIDA BINTI HASAN
Thesis Submitted to the School of Graduate Studies, Universiti Putra Malaysia, in Fulfilment of the Requirements for the Degree of Doctor
of Philosophy December 2014
©
COPYRIGHT
UPM
COPYRIGHT
All material contained within the thesis, including without limitation text, lo-gos, icons, photographs and all other artwork, is copyright material of Universiti Putra Malaysia unless otherwise stated. Use may be made of any material con-tained within the thesis for non-commercial purposes from the copyright holder. Commercial use of material may only be made with the express, prior, written permission of Universiti Putra Malaysia.
©
COPYRIGHT
UPM
DEDICATIONS
To my beloved husband, Abd Wahab Jusoh, parents, Hasan Omar and Diwi Che Mat,
sisters, Ruzana and Siti Nur.
©
COPYRIGHT
UPM
Abstract of thesis presented to the Senate of Universiti Putra Malaysia in fulfilment of the requirement for the degree of Doctor of Philosophy
MODELING STUDENTS’ BACKGROUND AND ACADEMIC PERFORMANCE WITH MISSING VALUES USING
CLASSIFICATION TREE
By
NORSIDA BINTI HASAN
December 2014
Chair: Mohd Bakri Adam, Ph.D.
Faculty: Institute for Mathematical Research
Student’s academic performance is a prime concern to high level educational in-stitution since it will reflect the performance of the inin-stitution. The differences in academic performance among students are topics that has drawn interest of many academic researchers and our society. One of the biggest challenges in universities decision making and planning today is to predict the performance of their stu-dents at the early stage prior to their admission. We address the application of inferring the degree classification of students using their background data in the dataset obtained from one of the high level educational institutions in Malaysia. We present the results of a detailed statistical analysis relating to the final degree classification obtained at the end of their studies and their backgrounds. Clas-sification tree model produce the highest accuracy in predicting student’s degree classification using their background data as compared to Bayesion network and naive Bayes. The significance of the prediction depends closely on the quality of the database and on the chosen sample dataset to be used for model training and testing. Missing values either in predictor or in response variables are a very com-mon problem in statistics and data mining. Cases with missing values are often ignored which results in loss of information and possible bias. Surrogate split in standard classification tree is a possible choice in handling missing values for large dataset contains at most ten percent missing values. However, for dataset contains more than 10 percent missing values, there is an adverse impact on the structure of classification tree and also the accuracy. In this thesis, we propose classification tree with imputation model to handle missing values in dataset. We investigate the application of classification tree, Bayesian network and naive Bayes as the imputation techniques to handle missing values in classification tree model. The
©
COPYRIGHT
UPM
investigation includes all three types of missing values machanism; missing com-pletely at random (MCAR), missing at random (MAR) and missing not at random (MNAR). Imputation using classification tree outperform the imputatation using Bayesian network and naive Bayes for all MCAR, MAR and MNAR. We also com-pare the performance of classification tree with imputation with surrogate splits in classification and regression tree (CART). Fifteen percent of student’s background data are eliminated and classification tree with imputation is used to predict stu-dent’s degree classification. Classification tree with imputation model produces more accurate model as compared to surrogate splits.
©
COPYRIGHT
UPM
Abstrak tesis yang dikemukakan kepada Senat Universiti Putra Malaysia sebagai memenuhi keperluan untuk ijazah Doktor Falsafah
PERMODELAN LATARBELAKANG DAN PENCAPAIAN AKADEMIK PELAJAR DENGAN NILAI HILANG
MENGGUNAKAN POKOK KLASIFIKASI
Oleh
NORSIDA BINTI HASAN
December 2014
Pengerusi: Mohd Bakri Adam, Ph.D.
Fakulti: Institut Penyelidikan Matematik
Pencapaian akademik pelajar menjadi keutamaan di institusi pengajian tinggi ker-ana ia mencerminkan prestasi institusi tersebut. Perbezaan pencapaian aka-demik di kalangan pelajar sentiasa menjadi topik perbincangan yang menarik minat ra-mai penyelidik dan masyarakat umum. Di dalam kajian ini, analisis statistik memperlihatkan perkaitan di antara pencapaian akademik pelajar semasa bergrad-uat dan latarbelakang mereka. Salah satu daripada cabaran besar yang dihadapi oleh pembuat dasar serta perancangan universiti hari ini adalah untuk meramal pencapaian pelajar semasa awal kemasukan mereka ke universiti. Kami menan-gani aplikasi penafsiran klasifikasi ijazah pelajar menggunakan data latarbelakang dalam set data yang diperolehi daripada salah satu Institusi Pengajian Tinggi Awam (IPTA) di Malaysia. Kami paparkan hasil analisis statistik yang terper-inci berkaitan dengan klasifikasi ijazah yang diperolehi semasa tamat pengajian berdasarkan latarbelakang mereka. Model pokok klasifikasi menghasilkan kejituan tertinggi berbanding dengan rangkaian Bayesian dan Bayes naif. Signifikasi ra-malan sangat bergantung kepada kualiti pangkalan data serta bergantung juga kepada sampel yang akan digunakan untuk model latihan dan model pengujian. Nilai hilang samada dalam pembolehubah peramal atau pembolehubah tindak-balas merupakan masalah yang biasa dalam bidang statistik dan perlombongan data. Kes-kes nilai hilang yang selalunya diabaikan menyebabkan kehilangan mak-lumat dan boleh meghasilkan keputusan yang berpihak. Pemisah gantian (surro-gate split) dalam pokok klasifikasi piawai boleh menjadi pilihan semasa mengenda-likan nilai-nilai yang hilang bagi set data besar yang mengandungi paling banyak 10 peratus nilai hilang. Walau bagaimanapun bagi set data yang mengandungi lebih daripada 10 pratus nilai hilang, terdapat impak yang buruk ke atas struktur pokok klasifikasi dan kejituan klasifikasi. Di dalam tesis ini, kami mencadangkan
©
COPYRIGHT
UPM
model pokok klasifikasi dengan imputasi untuk menangani nilai hilang dalam set data. Kami mengkaji penggunaan pokok klasifikasi, rangkaian Bayesian dan Bayes naif sebagai teknik imputasi untuk menangani nilai hilang dalam model pokok klasifikasi. Kajian ini meliputi kesemua tiga jenis mekanisma nilai hilang: hilang sepenuhnya secara rawak (MCAR), hilang secara rawak (MAR) dan hilang bukan secara rawak (MNAR). Imputasi menggunakan pokok klasifikasi mempunyai ke-jituan mengatasi imputasi menggunakan rangkaian Bayesian dan Bayes naif bagi kesemua mekanisma iaitu MCAR, MAR dan MNAR. kami juga membandingkan pencapaian model pokok klasifikasi dengan imputasi dengan kaedah pemisah gan-tian dalam pokok klasifikasi dan regresi piawai (CART). Lima belas peratus dari-pada data latarbelakang pelajar dihapuskan dan model pokok klasifikasi dengan imputasi digunakan untuk meramalkan kelas ijazah pelajar. Model pokok klasi-fikasi dengan imputasi menghasilkan model yang lebih jitu berbanding dengan pemisah gantian.
©
COPYRIGHT
UPM
ACKNOWLEDGEMENTS
In the name of Allah, the Most Gracious and the Most Merciful.
Alhamdulillah, all praises to Allah for the strengths and His blessing in completing this thesis. Special appreciation goes to my supervisor, Associate Professor Dr. Mohd Bakri Adam, for his supervision and constant support. This thesis would have not be possible without his guidance and support for the last four years. Not forgotten, my appreciation to my co-supervisors, Associate Professor Dr. Mohd Rizam Abu Bakar and Associate Professor Dr. Norwati Mustapha for their sup-port and knowledge regarding this topic. I would like to express my gratitude to Universiti Pendidikan Sultan Idris for providing data for this research. I met many great people during my four years stay at Universiti Putra Malaysia, their kindness means a lot to me. Thank you very much.
©
COPYRIGHT
UPM
I certify that a Thesis Examination Committee has met on (18 December 2014) to conduct the final examination of (Norsida binti Hasan) on his (or her) the-sis entitled “Student’s Background and Academic Performance Modeling with Missing Values using Classification Tree” in accordance with the Uni-versities and University Colleges Act 1971 and the Constitution of the Universiti Putra Malaysia [P.U.(A) 106] 15 March 1998. The Committee recommends that the student be awarded the (Degree of Doctor of Philosophy).
Members of the Thesis Examination Committee were as follows:
Mat Rofa b Ismail, Ph.D.
Associate Professor Faculty of Science
Universiti Putra Malaysia (Chairperson)
Noor Akma bt Ibrahim, Ph.D.
Professor
Faculty of Science
Universiti Putra Malaysia (Internal Examiner)
Md Nasir b Sulaiman, Ph.D.
Associate Professor
Faculty of Computer Science and Information Technology Universiti Putra Malaysia
(Internal Examiner)
Mojtaba Ganjali, Ph.D.
Professor
Faculty of Mathematical Sciences Shahid Beheshti University Iran
(External Examiner)
ZULKARNAIN ZAINAL, Ph.D.
Professor and Deputy Dean School of Graduate Studies Universiti Putra Malaysia
©
COPYRIGHT
UPM
This thesis was submitted to the Senate of Universiti Putra Malaysia and has been accepted as fulfilment of the requirement for the degree ofDoctor of Philosophy.
The members of the Supervisory Committee were as follows:
Mohd Bakri Adam, Ph.D.
Associate Professor
Institute for Mathematical Research (INSPEM) Universiti Putra Malaysia
(Chairperson)
Mohd Rizam Abu Bakar, Ph.D.
Associate Professor Faculty of Science
Universiti Putra Malaysia (Member)
Norwati Mustapha, Ph.D.
Associate Professor
Faculty of Computer Science and Information Technology Universiti Putra Malaysia
(Member)
BUJANG KIM HUAT, Ph.D.
Professor and Dean School of Graduate Studies Universiti Putra Malaysia Date:
©
COPYRIGHT
UPM
DECLARATION
Declaration by graduate student I hereby confirm that:
• this thesis is my original work;
• quotations, illustrations and citations have been duly referenced;
• this thesis has not been submitted previously or concurrently for any other degree at any other institution;
• intellectual property from the thesis and copyright of thesis are fully-owned by Universiti Putra Malaysia, as according to the Universiti Putra Malaysia (Research) Rules 2012;
• written permission must be obtained from supervisor and the office of Deputy Vice-Chancellor (Research and Innovation) before thesis is published (in the form of written, printed or in electronic form) including books, jour-nals, modules, proceedings, popular writings, seminar papers, manuscripts, posters, reports, lecture notes, learning modules or any other materials as stated in the Universiti Putra Malaysia (Research) Rules 2012;
• there is no plagiarism or data falsification / fabrication in the thesis, and scholarly integrity is upheld as according to the Universiti Putra Malaysia (Graduate Studies) Rules 2003 (Revision 2012-2013) and the Universiti Pu-tra Malaysia (Research) Rules 2012. The thesis has undergone plagiarism detection software.
Signature: Date:
©
COPYRIGHT
UPM
Declaration by Members of Supervisory Committee This is to confirm that
• the research conducted and the writing of this thesis was under our super-vision;
• supervision responsibilities as stated in the Universiti Putra Malaysia (Grad-uate Studies) Rules 2003 (Revision 202-2013) are adhered to
Signature: Signature: Name of Name of Chairman of Member of Supervisory Supervisory Committee: Committee: Signature: Signature: Name of Name of Member of Member of Supervisory Supervisory Committee: Committee:
©
COPYRIGHT
UPM
TABLE OF CONTENTS Page ABSTRACT i ABSTRAK iii ACKNOWLEDGEMENTS v APPROVAL vi DECLARATION viiiLIST OF TABLES xiii
LIST OF FIGURES xv
LIST OF ABBREVIATIONS xviii
CHAPTER
1 INTRODUCTION 1
1.1 Student’s Academic Performance 1
1.2 Classification Tree 1 1.3 Problem Statements 2 1.4 Research Objectives 4 1.5 Research Contributions 4 1.6 Organization of Thesis 4 2 LITERATURE REVIEW 7
2.1 Factors Affecting Academic Performance 7
2.2 Meta Analysis of Students’ Performance Between Gender 8 2.3 Predicting Academic Performance Using Classification and
Regres-sion Tree 8
2.4 Missing Data and Imputation using Classification Tree 10
2.5 Conclusion 11
3 RESEARCH METHODOLOGY 13
3.1 Introduction 13
3.2 Research Framework 13
3.3 Data Collection 13
3.4 Data Pre-processing and Missing Data Injection 16
3.4.1 Data Selection and Transformation 16
3.5 Model Design 18
3.6 Model Development 18
3.7 Model Implementation and Evaluation 18
3.7.1 Cross Validation 19
©
COPYRIGHT
UPM
4 DATA PRE-PROCESSING AND MISSING DATA INJECTION 21
4.1 Descriptive Analysis on Students Admission 21
4.2 Descriptive Analysis on Students Performance 24
4.2.1 Performance According to Faculty 25
4.2.2 Performance According to Intake Category 27
4.2.3 Performance According to Gender 30
4.2.4 Performance According to Age Group 31
4.2.5 Performance According to Race 32
4.2.6 Performance According to Gender and Faculty 33 4.2.7 Performance According to Gender and Intake Category 33 4.2.8 Performance According to Age Group and Race 35 4.2.9 Performance According to Age Group and Gender 36 4.2.10 Performance According to Age Group and Faculty 37 4.2.11 Performance According to Age Group and Intake Category 38 4.2.12 Performance According to Race and Faculty 38 4.2.13 Performance According to Race and Intake Category 40 4.3 Data Analysis of Academic Performance Using Meta-Analysis 42 4.4 Meta-Analysis for First Class Degree Classification 44 4.5 Meta-Analysis for Second Class Upper Degree Classification 47 4.6 Meta-Analysis for Second Class Lower Degree Classification 49 4.7 Mining Students’ Academic Performance using Classification Tree,
Bayesian Network and Naive Bayes 52
4.8 Simulation of Population Data 61
4.8.1 Algorithm for Simulation of Population Data 62
4.9 Missing Data Injection 64
4.9.1 Missing Data Mechanism 65
4.9.2 Missing Completely at Random (MCAR) 65
4.9.3 Missing at Random (MAR) 66
4.9.4 Missing Not at Random (MNAR) 66
4.10 The influence of Missing Data in Classification Tree, Bayesian
net-work and Naive Bayes 67
4.11 Sensitivity of Missing Value in Classification Tree using Simulated
Dataset 68
4.12 Conclusion 72
5 MODEL DEVELOPMENT 73
5.1 Introduction 73
5.2 Development of Classification Tree with Imputation Model 73 5.2.1 Algorithm for Classification Tree with Imputation Model 73
5.2.2 Algorithm for Missing Values Imputation 74
5.3 Conclusion 80
6 EXPERIMENTAL RESULTS 81
6.1 Introduction 81
6.2 Result of Imputation using Classification Tree 81 6.3 Result of Classification Tree with Imputation using Bayesian Network 83
©
COPYRIGHT
UPM
6.4 Result of Imputation using Naive Bayes 84
6.5 Classification Tree Model with Imputation 86
6.6 Conclusion 87
7 CONCLUSION AND FUTURE WORK 88
7.1 Conclusion 88
7.2 Suggestion for Future Research 89
REFERENCES/BIBLIOGRAPHY 90
APPENDICES 94
BIODATA OF STUDENT 96
©
COPYRIGHT
UPM
LIST OF TABLES
Table Page
3.1 Format of Students Data 15
3.2 Background of Students 17
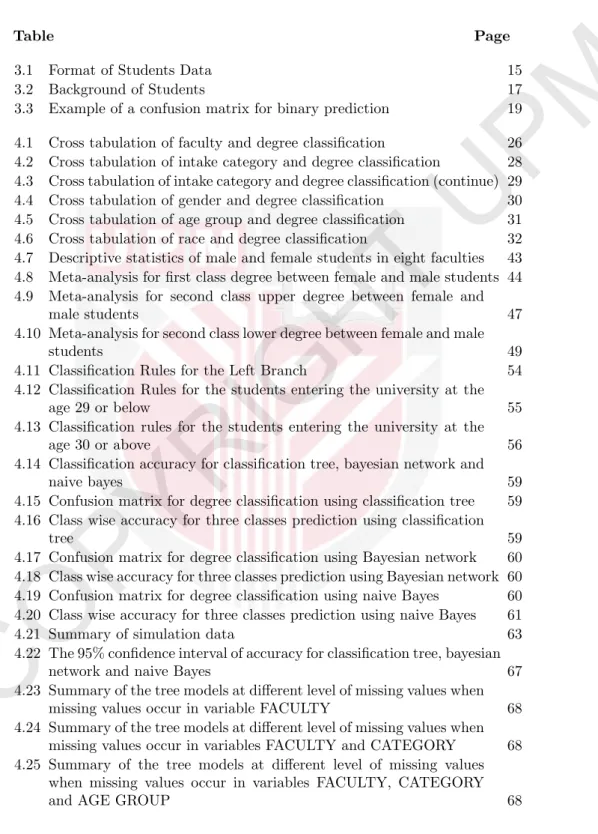
3.3 Example of a confusion matrix for binary prediction 19 4.1 Cross tabulation of faculty and degree classification 26 4.2 Cross tabulation of intake category and degree classification 28 4.3 Cross tabulation of intake category and degree classification (continue) 29 4.4 Cross tabulation of gender and degree classification 30 4.5 Cross tabulation of age group and degree classification 31 4.6 Cross tabulation of race and degree classification 32 4.7 Descriptive statistics of male and female students in eight faculties 43 4.8 Meta-analysis for first class degree between female and male students 44 4.9 Meta-analysis for second class upper degree between female and
male students 47
4.10 Meta-analysis for second class lower degree between female and male
students 49
4.11 Classification Rules for the Left Branch 54
4.12 Classification Rules for the students entering the university at the
age 29 or below 55
4.13 Classification rules for the students entering the university at the
age 30 or above 56
4.14 Classification accuracy for classification tree, bayesian network and
naive bayes 59
4.15 Confusion matrix for degree classification using classification tree 59 4.16 Class wise accuracy for three classes prediction using classification
tree 59
4.17 Confusion matrix for degree classification using Bayesian network 60 4.18 Class wise accuracy for three classes prediction using Bayesian network 60 4.19 Confusion matrix for degree classification using naive Bayes 60 4.20 Class wise accuracy for three classes prediction using naive Bayes 61
4.21 Summary of simulation data 63
4.22 The 95% confidence interval of accuracy for classification tree, bayesian
network and naive Bayes 67
4.23 Summary of the tree models at different level of missing values when
missing values occur in variable FACULTY 68
4.24 Summary of the tree models at different level of missing values when missing values occur in variables FACULTY and CATEGORY 68 4.25 Summary of the tree models at different level of missing values
when missing values occur in variables FACULTY, CATEGORY
©
COPYRIGHT
UPM
4.26 Summary of the tree models at different level of missing values when missing values occur in variables FACULTY, CATEGORY,
AGE GROUP and RACE 68
4.27 The 95% confidence interval of the tree models with different level
of MCAR 69
4.28 The 95% confidence interval of the tree models for MAR and MNAR 69 6.1 Summary of the classification tree model before and after
imputa-tion for MCAR using classificaimputa-tion tree 81
6.2 Summary of the classification tree model before and after
imputa-tion for MAR 82
6.3 Summary of the classification tree model before and after
imputa-tion for MNAR 82
6.4 Summary of the classification tree model before and after
imputa-tion for MCAR using Bayesian network 83
6.5 Summary of the classification tree model before and after
imputa-tion for MAR using Bayesian network 83
6.6 Summary of the classification tree model before and after
imputa-tion for MNAR using Bayesian network 84
6.7 Summary of the classification tree model before and after
imputa-tion for MCAR using naive Bayes 84
6.8 Summary of the classification tree model before and after
imputa-tion for MAR using naive Bayes 85
6.9 Summary of the classification tree model before and after
©
COPYRIGHT
UPM
LIST OF FIGURES
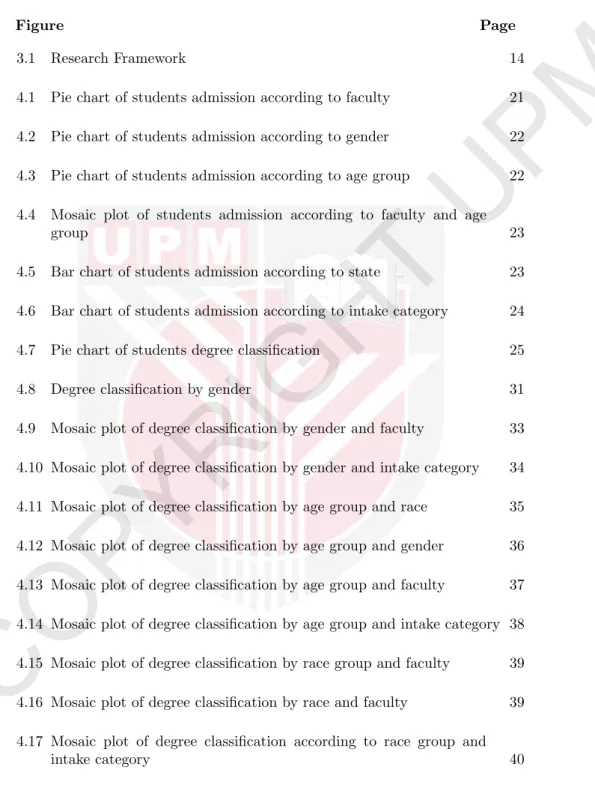
Figure Page
3.1 Research Framework 14
4.1 Pie chart of students admission according to faculty 21 4.2 Pie chart of students admission according to gender 22 4.3 Pie chart of students admission according to age group 22 4.4 Mosaic plot of students admission according to faculty and age
group 23
4.5 Bar chart of students admission according to state 23 4.6 Bar chart of students admission according to intake category 24
4.7 Pie chart of students degree classification 25
4.8 Degree classification by gender 31
4.9 Mosaic plot of degree classification by gender and faculty 33 4.10 Mosaic plot of degree classification by gender and intake category 34 4.11 Mosaic plot of degree classification by age group and race 35 4.12 Mosaic plot of degree classification by age group and gender 36 4.13 Mosaic plot of degree classification by age group and faculty 37 4.14 Mosaic plot of degree classification by age group and intake category 38 4.15 Mosaic plot of degree classification by race group and faculty 39 4.16 Mosaic plot of degree classification by race and faculty 39 4.17 Mosaic plot of degree classification according to race group and
intake category 40
©
COPYRIGHT
UPM
4.19 Forest plot of observed effect sizes and the 95% confidence intervals for the first class degree classification studies. 45 4.20 Funnel plots for the first class degree classification studies. 46 4.21 Forest plot of observed effect sizes and the 95% confidence intervals
for the second class upper degree classification studies. 48 4.22 Funnel plots for the second class upper degree classification studies. 48 4.23 Forest plot of observed effect sizes and the 95% confidence intervals
for the second class lower degree classification studies. 50 4.24 Funnel plots for the second class lower degree classification studies. 51 4.25 Classification tree model of students degree classification 53 4.26 Naive Bayes classification model of students degree classification 57 4.27 Bayesian network classification model of students degree classification 58 4.28 Mosaic plot of students Degree Classification using real dataset 64 4.29 Mosaic plot of students Degree Classification using simulation dataset 64 4.30 Classification tree model of students degree classification using
sim-ulation data 65
4.31 Percentage of correct classification rate for classification tree, bayesian network and naive Bayes with different level of missing values 67 4.32 Percentage of correct classification rate in dataset with different
level of missing values 70
4.33 Percentage of correct classification rate in dataset with different
level of missing values 71
5.1 Classification tree used to impute the missing value in variable
FAC-ULTY 74
5.2 Classification Tree to impute missing data in variable FACULTY 75 5.3 Classification Tree to impute missing data in variable AGE GROUP 76 5.4 Classification Tree to impute missing data in variable RACE 76 5.5 Classification Tree to impute missing data in variable CATEGORY 77
©
COPYRIGHT
UPM
5.7 Naive Bayes classifier to impute missing data in variable FACULTY 79 6.1 Classification tree model with imputation for students degree
clas-sification 86
6.2 Comparison of classification accuracy after imputation using classi-fication tree, Bayesian network and naive Bayes 87
©
COPYRIGHT
UPM
LIST OF ABBREVIATIONS
CART Classification and Regression Tree STPM Malaysian Higher School Certificate PKPG In-service Teacher Education Programme KDPK In-service Teachers with Diploma in Special
Education Programme
MCAR Missing Completely At Random
MAR Missing At Random
MNAR Missing Not At Random
RRP Random Recursive Partitioning
ITree Imputation Tree
UPSI Universiti Pendidikan Sultan Idris
FB Faculty of Languages
FPE Faculty of Business and Economics
FSKPM Faculty of Cognitive Science and Human Development
FSM Faculty of Music
FSS Faculty of Sports Science FSSK Faculty of Human Sciences FST Faculty of Science and Technology
FTMK Faculty of Information Technology and Communication CGPA Cumulative Gred Point Average
FP False Positive
FN False Negative
TP True Positive
©
COPYRIGHT
UPM
CHAPTER 1
INTRODUCTION
1.1 Student’s Academic Performance
Student performance is a prime concern to high level educational institution since it will reflect the performance of the institution. Researchers and educators con-ducted many studies and experiments to determine the factors that affect student’s performance. Socio-demographic characteristics such as age, gender, marital sta-tus, family stasta-tus, ethnicity and previous achievement are shown to affect their undergraduate academic performance (Brown and Burkhardt, 1999; Clayton and Cate, 2004; Stevens et al., 2004; Ding et al., 2006; Ismail and Othman, 2006; Lietz, 2006; Gibb et al., 2008).
One of the biggest challenges in university decision making and planning today is to predict the performance of their students at the early stage prior to their admission. This is not an easy task but the findings is important to assist the university in determining future policy on student admissions and to provide the necessary plans to improve student performance. One of the significant facts in universities is the explosive growth of students’ information in databases system. As the amount of these data increasing rapidly, the interest has grown in tapping these data to extract the hidden information that is valuable to the management. The discipline concern with this task is known as data mining. Data mining tech-niques can be used to extract meaningfull information and to develop significant relationships among variables stored in the students’ background data.
1.2 Classification Tree
In this thesis, we applied classification tree because it produced the best accuracy as compared to naive Bayes and bayesian network. Classification and Regression tree (CART) is a supervised learning method that constructs a flow-chart-like tree as the classification model from the data and uses the tree model to classify the future data. Classification tree is a flow-chart-like tree structure consists of one root, branches, nodes and leaves. Classification tree analysis is a form of binary recursive partitioning where a node (parent node) in a decision tree, can only be split into two child nodes. The term ”recursive” refers to the fact that the binary partitioning process can be applied over and over again (Breiman et al., 1984). Classification tree is usually obtained in two steps. Initially a large tree is grown using a greedy algorithm, and then this tree is pruned by deleting bottom nodes through a process of statistical estimation. The greedy algorithm typically grows a tree by sequentially choosing splitting rules for nodes on the basis of maximizing some fitting criterion. All possible splits consist of possible splits of each predictor variable. This step generates a sequence of trees, each of which is an extension of previous trees. A single tree is then selected by pruning the largest tree according
©
COPYRIGHT
UPM
to a model selection criterion such as cost-complexity pruning, cross-validation, or even multiple tests of whether two adjoining nodes should be collapsed into a single node (Breiman et al., 1984). This pruning process ensures the tree which fits the information in the learning dataset, but does not overfit the information. The CART begins with the entire sample of student’s data. This entire sample is heterogeneous, consisting of all students. It then divides up the sample according to a splitting rule and a goodness of split criterion. Each internal node has an associated splitting rule which uses a predictor variable to assign observations to either its left child node or right child node. The splitting rules for our sample are question of the form, ”Is the FACULTY F2, F3 or F6?” or put more generally, is X ∈d, whereX are some variables anddis some elements within that variable. If the criterion is satisfied, we follow the division to the left and if the said criterion is not satisfied, we follow the division to the right. Such questions are used to divide or split the sample. The CART algorithm considers all possible variables and all possible values in order to find the best split. The best split refers to the question that splits the data into two parts with maximum homogeneity (Breiman et al., 1984). Maximum homogeneity of child nodes is defined by impurity function i(t) which is equivalent to the maximization of change of impurity function ∆itas shown by
∆it=i(tp)−Pli(tl)−Pri(tr), where
• tp is a parent node,
• i(tp) is the impurity measure for the parent node,
• Pl is the proportion of the samples in nodetthat go to the left nodetl,
• Pr is the proportion of the samples in nodetthat go to the right nodetr,
• i(tl) is the impurity measure for left child node,
• i(tr) is the impurity measure for right child node.
Since the parent node is constant for any split, then, the maximization problem is equivalent to minimizing the following expression
Pli(tl) +Pri(tr). (1.1)
Equation (1.1) implies that CART will compare different splits and determines which of these will produce the most homogeneous subsamples. Common measures are:
1.3 Problem Statements
Student’s performance is a prime concern to high level educational institution be-cause it will reflect the performance of the institution. The differences in academic
©
COPYRIGHT
UPM
researchers and our society. However, the student’s performance is not encourag-ing since less than 4 percent of student in public university in Malaysia obtained first class degree classification upon graduation (Graduate Tracer Study Report 2009, Retrieved 14/11/2012).
Even though there is a weak relationship between employees performance with CGPA as reported by Hashim (2012), employers usually use the students aca-demic performance as the selection criteria to shortlist the candidates for the interview. Hashim (2012) also stated that several well-established companies in Malaysia limit their recruitment only to those students who achieve 3.00 CGPA and above. Therefore, the biggest challenges in university decision making and planning today is to understand the student’s performance pattern and then to predict the performance of the students at the early stage prior to their admis-sion. To our knowledge, there is no study has yet been made to model student’s background data from all faculties in a university to classify and predict the final degree classification. The findings can assist the university in determining future policy on student admissions and to provide the necessary plans to improve stu-dent performance.
The significance of the prediction depends closely on the quality of the database and on the chosen sample dataset to be used for model training and testing. Un-fortunately, missing values either in predictor or in response variables are a very common problem in statistics and data mining. Cases with missing values are often ignored and standard methods for complete data are run on the remaining data cases. If the rate of missing values is less than 1 percent, missing values are considered trivial, 1 percent to 5 percent missing values are considered man-ageable, 5 percent to 15 percent missing values require sophisticated methods to handle and more than 15 percent may severely impact any kind of interpretation (Acuna and Rodriguez, 2004; Peng et al., 2005). To our knowledge, there is no study has yet been made of sensitivity of missing data in the classification tree structure and classification accuracy with big sample size.
Case deletion method discards valuable information about features that are ob-served which results in loss of information and possible bias (Shafer, 2002; Little and Rubin, 2002). One effective way of dealing with missing values is to im-pute them with some reasonable value before proceed with inference. The key to imputation techniques is to substitute with the most probable values and mean-while preserve the joint relationships between variables. Imputation by a constant using mean or mode values will ignore the between-attribute relationships and assumes that all missing values represent the same value, probably leading to con-siderable distortions. Surrogate split in standard classification tree is a possible choice for large dataset contains at most ten percent missing values. However, for dataset contains more than 20 percent missing values, there is an adverse impact on the accuracy of the classification tree (Peng et al., 2005). Peng et al. (2005); Saar-Tsechansky and Provost (2007) showed that imputation methods are able to increase the accuracy in classifcation model. However, these research are limited to missing completely at random (MCAR). Tree-based approach for missing values
©
COPYRIGHT
UPM
imputation was proposed by Vateekul and Sarinnapakorn (2009). However, this method is applicable for quantitative data.
In this thesis, we propose classification tree model with imputation to handle missing values in dataset. We investigate the application of classification tree, Bayesian network and naive Bayes as the imputation techniques to handle missing values in classification tree model. The investigation includes all three types of missing values machanism; missing completely at random (MCAR), missing at random (MAR) and missing not at random (MNAR).
1.4 Research Objectives
The main objective of this research is to develop an accurate model to predict student’s academic performance using their background data with the present of missing values. To achieve the objective, the following sub-objectives are adopted: 1. To propose classification tree model with imputation to handle dataset with
missing data.
2. To propose an imputation method for three types of missing data mechanism: MCAR, MAR and MNAR.
3. To propose the predictor variable for student’s academic performance.
1.5 Research Contributions
There are three main contibution of this research:
1. Classification tree model with missing data imputation for predicting the student’s academic performance based on their background data.
2. Imputation method for three types of missing data mechanism: MCAR, MAR and MNAR.
3. Predictor variables for student’s academic performance.
1.6 Organization of Thesis
This thesis contains seven chapters; Introduction, Literature Review, Research Methodology, Data Pre-processing and Missing Data Injection, Model Develop-ment, Experimental Results and Conclusion and Future Work. The details of the chapter are as follow:
Chapter 1 provides an overview of the thesis, such as background studies, problem statement, objectives and reseach contribution.
Chapter 2 presens the literature reviews on the existing work to determine the factors that affect student’s performance. This description is particularly focused
©
COPYRIGHT
UPM
status and ethnicity. We present an overview of the major data mining techniques used in predicting student’s academic performance. Classification tree is the com-mon method for mining student’s data. However it is sensitive to the presence of missing values. The reviews on sensitivity of missing values and how to handle missing values in data mining are also presented.
Chapter 3 provides the methodology applied in this study. Research framework in-cluding data, data pre-processing and missing data injection, model design, model development and model implementation are briefly explained in this chapter. Chapter 4 presents the data pre-processing and missing data injection. The de-scriptive data analysis is carried out to investigate the relationship between cat-egorical variables of student’s academic performance according to their gender, university academic intake category, age and race. Data mining techniques namely classification tree, Bayesian network and naive Bayes are applied to student’s back-ground data to predict student’s degree classification. We also simulate the stu-dent’s background data using the correlation of the actual data, then, we simulate the three types of missing data mechanism (MCAR, MAR and MNAR). The in-fluence of missing values in classification tree, Bayesian network and naive Bayes are then investigated by removing levels of student’s background data.
Chapter 5 provides a detailed explaination on the development of classification tree with imputation model. The imputation of missing values using three imputation techniques; classification tree, Bayesian Network and naive Bayes are explained. All three imputation techniques are implemented on datasets having three types of missing values mechanism; MCAR, MAR and MNAR.
Chapter 6 presents the results of experiments applied to real student’s background and academic performance dataset to evaluate the performance of proposed algo-rithms.
©
COPYRIGHT
UPM
BIBLIOGRAPHY
Acuna, E. and Rodriguez, C. 2004. The treatment of missing values and its effect in the classifier accuracy. In Classification, Clustering and Data Mining Appli-cations (eds. D. Banks, L. House, F. R. McMorris, W. Arabie, and W. Gaul), 639–648. Springer-Verlag Berlin-Heidelberg.
Adeyemo, A. B. and Kuye, G. 2006. Mining Students’ Academic Performance Us-ing Decision Tree Algorithms.Journal of Information Technology Impact 6 (3): 161–170.
Al-Radaideh, Q. A., Al-Shawakfa, E. M. and Al-Najjar, M. I. 2006. Mining Stu-dent Data using Decision Trees. InThe 2006 International Arab Conference on Information Technology (ACIT’2006).
Ali, S., Haider, Z., Munir, F., Khan, H. and Ahmed, A. 2013. Factors Contributing to the Students Academic Performance: A Case Study of Islamia University Sub-Campus.American Journal of Educational Research 1 (8): 283–289. Allison, P. 2002.Missing Data. Thousand Oaks, California: Sage.
Archer, J., Cantwell, R. and Bourke, S. 1999. Coping at University: An Exam-ination Achievement, Motivation, Self-Regulation, Confidence, and Method of Entry.Higher Education Research and Development 18 (1): 31–54.
Batista, G. E., Prati, R. C. and Monard, M. C. 2004. A study of the behav-ior of several methods for balancing machine learning training data. SIGKDD Explorations 6 (1): 20–29.
Bekele, R. and Menzel, W. 2005. A Bayesian approach to predict performance of a student (BAPPS): A Case with Ethiopian Students.Algorithms 22 (23): 24–29. Breiman, L., Friedman, J., Olshen, R. and Stone, C. 1984. Classification and
Regression Trees. New York: Chapman and Hall.
Brown, H. E. and Burkhardt, R. L. 1999, Predicting Student Success: The Relative Impact of Ethnicity, Income, and Parental Education, AIR 1999 Annual Forum Paper.
Chawla, N. V., Bowyer, K. W., Hall, L. O. and Kegelmeyer, W. P. 2002. SMOTE: Synthetic Minority Oversampling TEchnique.Journal of Artificial Intelligence Research 16: 321–357.
Clayton, G. E. and Cate, T. 2004. Predicting MBA No-Shows and Graduation Suc-cess with Discriminate Analysis.International Advances in Economic Research 10: 235–243.
Cortez, P. and Silva, A. 2008. Using Data Mining to Predict Secondary School Student Performance. InProceedings of 5th Annual Future Business Technology
©
COPYRIGHT
UPM
Creel, D. and Krotki, K. 2006. Creating Imputation Classes Using Classification Tree Methodology. InProceedings of the Survey Research Methods Section, ASA. Cumming, G. 2011.Understanding The New Statistics: Effect Sizes, Confidence
Intervals and Meta-Analysis. New York: Taylor & Francis Group, LLC. Delavari, N., Phon-Amnuaisuk, S. and Beikzadeh, M. R. 2008. Data Mining
Appli-cation in Higher Learning Institutions.Informatics in Education 7 (1): 31–54. Diggle, P. J. and Kenward, M. G. 1994. Informative Dropout in Longitudinal Data
Analysis.Applied Statistics 43 (1): 49–93.
Ding, C. S., Song, K. and Richardson, L. I. 2006. Do Mathematical Gender Dif-ferences Continue? A Longitudinal Study of Gender Difference and Excellence in Mathematics Performance in the U.S.Educational studies 40 (3): 279–295. Ding, Y. and Simonoff, J. S. 2010. An Investigation of Missing Data Methods
for Classification Trees Applied to Binary Response Data.Journal of Machine Learning Research 11: 131–170.
Ferrari, P. A. and Barbiero, A. 2012. Simulating ordinal data.Multivariate Behav-ioral Research 47: 566–589.
Gibb, S. J., Fergusson, D. M. and Horwood, L. J. 2008. Gender differences in educational achievement to age 25.Australian Journal of Education 52 (1): 63– 80.
Glass, G. V. 1976. Primary, Secondary, and Meta-Analysis of Research. Educa-tional Researcher 5 (10): 3–8.
Graduate Tracer Study Report 2009. Retrieved 14/11/2012, Website, http://www.mohe.gov.my/portal/en/penerbitan-kpt-selanjutnya/394-tracer-study-report-2009.html.
Graham, L. 1991. Predicting Academic Success of Students in a Master of Business Administration Program.Educational and Psychological Measurement 51: 721– 727.
Han, J. and Kamber, M. 2001.Data mining: Concepts and techniques. London: Morgan Kaufmann.
Hashim, J. 2012. Academic excellence as selection criteria among Malaysian em-ployers.Higher Education, Skills and Work-based Learning 2 (1): 63–73. Hayes, K., King, E. and Richardson, J. 1997. Mature Students in Higher
Educa-tion: III Approaches to studying in access students.Studies in Higher Education 22 (1): 19–31.
Hortan, N. J. and Kleinman, K. P. 2007. Much Ado About Nothing: A Compari-son of Missing Data Methods and Software to Fit Incomplete Data Regression Models.The American Statistician 61: 79–90.
©
COPYRIGHT
UPM
Iacus, S. M. and Porrob, G. 2007. Missing data imputation, matching and other applications of random recursive partitioning.Computational Statistics & Data Analysis 52: 773–789.
Ibrahim, Z. and Rusli, D. 2007. Predicting Students’ Academic performance: Com-paring Artificial Neural Network, Decision Tree and Linear Regression. In21st Annual SAS Malaysia Forum.
Ismail, N. A. and Awang, H. 2008. Assessing the Effects of Students‘ Characteris-tics and Attitudes on MathemaCharacteris-tics Performance.Problems of Education In The 21st Century 9: 34–41.
Ismail, N. A. and Othman, A. 2006. Comparing University Academic Performances of HSC Students at the Three Art-Based Faculties. International Education Journal 7 (5): 668–675.
Jabor, M. K. A., machtmes, K., Kungu, K., Buntat, Y. and Nordin, M. S. 2011. The Influence of Age and Gender on the Students Achievement in Mathematics. InInternational Conference on Social Science and Humanity, 304–308. IACSIT Press.
Jo, T. and Japkowicz, N. 2004. Class imbalances versus small disjuncts.SIGKDD Explorations 6 (1).
Kubat, M. and Matwin, S. 1997. Addressing the Curse of Imbalanced Training Sets: One-Sided Selection. InProceedings of the Fourteenth International Con-ference on Machine Learning, 179–186. Morgan Kaufmann.
Kumar, S. A. and Vijayalakshmi, M. N. 2011. Efficiency of Decision Trees in Pre-dicting Student’s Academic Performance. In Computer Science & Information Technology (CS & IT) series, 335–343. Computer Science Conference Proceed-ings.
Lietz, P. 2006. A Meta-Analysis of Gender Differences in Reading Achievement at the Secondary School Level. Studies in Educational Evaluation 32: 317–344. Lindberg, S. M., Hyde, J. S. and Petersen, J. L. 2010. New Trends in Gender and
Mathematics Performance: A Meta-Analysis.Psychol Bull.136 (6): 1123–1135. Little, R. J. A. and Rubin, D. B. 2002.Statistical Analysis with Missing Data. 2nd
edn. New York: John Wiley and Sons, Inc.
Longadge, R., Dongre, S. S. and Malik, L. 2013. Class Imbalance Problem in Data Mining: Review.International Journal of Computer Science and Network (IJCSN) 2 (1): 2277–5420.
Munnich, R. and Schurle, J. 2003, On the simulation of complex universes in the case of applying the German Microcensus, DACSEIS Research Paper Series No 4, University of Tubingen.
Naderi, H., Abdullah, R., Tengku Aizan, H., Sharir, J. and Kumar, V. 2009. Creativity, Age and Gender as Predictors of Academic Achievement Among
©
COPYRIGHT
UPM
Nghe, N. T., Janecek, P. and Haddawy, P. 2007. A Comparative Analysis of Tech-niques for Predicting Academic Performance. In37th ASEE/IEEE Frontier in Education Conference.
O’keefe, D. J. and Haie, S. L. 2001. An Odds-Ratio Based Meta-Analysis of Research on the Door-in-the-Face Influence Strategy. Communication Reports 14 (1): 31–38.
Peiperl, M. and Trevelyan, R. 1997. Predictors of Performance at Business School: Demographic Factors and the Contrast Between Individual and Group Outomes. Journal of Management Development 16 (5): 354–367.
Peng, L., Lei, L. and Naijun, W. 2005. A Quantitative Study of the Effect of Missing Data in Classifiers. In Computer and Information Technology, 2005. CIT 2005. The Fifth International Conference on, 28–33. IEEE.
Ried, K. 2006. Interpreting and Understanding Meta-Analysis Graphs A Practical Guide.Australian Family Physician 35 (8): 635–638.
Romero, V. and Salmern, A. 2004.Multivariate Imputation of Qualitative Missing Data Using Bayesian Networks.Advances in Soft Computing, vol. 26. Springer Berlin Heidelberg.
Rubin, D. 1976. Inference and Missing Data.Biometrika 64 (3): 581–592. Saar-Tsechansky, M. and Provost, F. 2007. Handling Mising Values when Applying
Classification Models.Journal of Machine Learning Research8: 1625–1657. Shafer, J. 2002.Analysis of Incomplete Multivariate Data. New York: Chapman
and Hall.
Ssali, G. and Marwala, T. 2008. Computational Intelligence and Decision Tree for Missing Data Estimation. InIEEE World Congress on Computational Intelli-gence Proceeding, 201–207.
Sterne, J. A. C. and Harbord, M. 2004. Funnel plots in meta-analysis.The Stata Journal 4 (2): 127–141.
Stevens, T., Olivarez Jr, A., Lan, W. L. and Tallent-Runnels, M. K. 2004. Role of Mathematics Self-Efficacy in Mathematics Performance Across Ethnicity.The Journal of Educational Research 97 (4): 208–221.
Vandamme, J. P., Meskens, N. and Superby, J. F. 2007. Predicting Academic Performance by Data Mining.Education Economics 15 (4): 405–419.
Vateekul, P. and Sarinnapakorn, K. 2009. Tree-Based Approach to Missing Data Imputation. InICDM Workshops, 70–75.
Vialardi, C., Bravo, J., Shafti, L. and Ortogisa, A. 2009. Recommenda-tion in Higher EducaRecommenda-tion Using Data Mining Techniques. In Proceeding of the 2nd International Conference on Educational Data Mining (EDM’09) (eds. T. Barnes, M. C. Desmarais, C. Romero, and S. Ventura), 190–199. www.educationaldatamining.org.