Procedia Engineering 58 ( 2013 ) 31 – 38
1877-7058 © 2013 The Authors. Published by Elsevier Ltd.
Selection and peer-review under responsibility of the Hypervelocity Impact Society doi: 10.1016/j.proeng.2013.05.006
The 12
thHypervelocity Impact Symposium
Artificial Neural Networks for Characterizing Whipple Shield
Performance
Shannon Ryan
a,*, Stephen Thaler
baDefence Science and Technology Organisation, 506 Lorimer St, Melbourne, VIC 3207, Australia bImagination Engines, Inc.,1550 Wall St, Suite 300, St. Charles, MO 63303-3545, USA
Abstract
An artificial neural network model has been developed for predicting the perforation limits of spaced aluminum armor (aka Whipple shield) under impact of aluminum projectiles at hypervelocity. The network, utilizing a multilayer perceptron architecture, was trained on data from 769 impact tests, for which it accurately predicted the perforation of the shield rear wall (or lack thereof) 92% of the time. Comparatively, the leading empirical approach is capable of accurately predicting the outcome of 71% of the impact tests. The network lso provides physically plausible confidence bounds (i.e. error bars). Interrogation of the network was performed to identify the input parameters that most heavily correlated with the output prediction. Although the majority of the traditional parameters (i.e. those identified in the empirical ballistic limit equation) were amongst the most influential, some unexpected (and potentially spurious) parameters were also identified. A more widely sampled set of training data incorporating increased diversity in projectile and target materials would likely improve the network internal weighting for material properties and avoid accidental identification of biases in the training exemplars. © 2012 Published by Elsevier Ltd. Selection and/or peer-review under responsibility of the Hypervelocity Impact Society.
Keywords: Hypervelocity impact, ballistic limit, artificial neural network
1.Introduction
Analytical or empirical equations are commonly used to predict the perforation of armor systems by impacting projectiles. Due to the complexity of material behavior and target response under high strain-rate loading, these equations predominantly apply a number of simplifying assumptions and include empirical parameters or curve fits. Inherently, therefore, these equations are limited to application on projectile/target interactions similar to those used in deriving the empirical coefficients. Advanced statistical methods now have the capacity to significantly improve our modeling of complex problems with many, and often unanticipated, contributing factors and inherent non-linearities. Such an approach can also transgress traditional borders in empirical algorithm development based on specific projectile and target types. Common characteristics/patterns should be identifiable in non-similar interactions, for example, fragment simulating projectiles impacting rolled homogenous armor at 100 m/s and aluminum alloy spheres impacting spaced aluminum armor, i.e. Whipple shield, at hypervelocity, something limited in empirical approaches.
In this study, an artificial neural network (ANN) has been developed for predicting the perforation limits of aluminum Whipple shields impacted by spherical aluminum projectiles at hypervelocity. This particular interaction has been selected as a proof-of-concept demonstrator due to the large volume of unclassified test data available and the decades-long development of the state-of-the-art empirical approach for predicting the perforation limits. Additionally, the presence of
* Corresponding author. Tel.: +61 (0)3 9626-7706; fax: +61 (0)3 9626-8889. E-mail address: [email protected].
© 2013 The Authors. Published by Elsevier Ltd.
Selection and peer-review under responsibility of the Hypervelocity Impact Society Open access under CC BY-NC-ND license.
bifurcations in the relevant velocity range (i.e. onset of projectile shatter, melt, and vaporization regimes) that induce distinctly different shield damage and failure modes makes the problem well suited to ANN analysis.
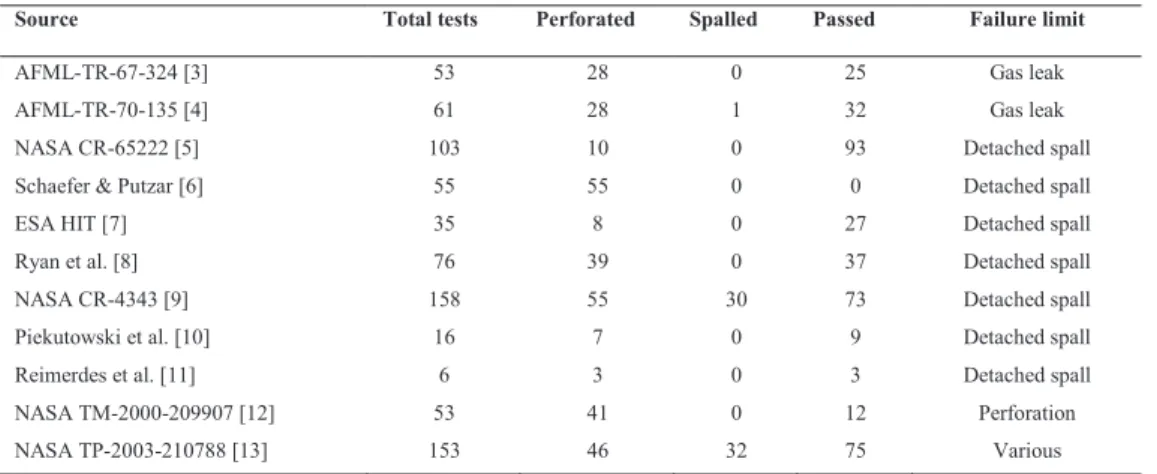
2.Test database
The performance of aluminum Whipple shields against micrometeoroid and orbital debris (MMOD) particles has been extensively investigated since 1958 [1]. For this study, a total of 769 impact tests were collated from a range of references, a summary of which is provided in Table 1. The tests presented in Table 1 were all performed with spherical aluminum/aluminum alloy projectiles and did not include multi-layer insulation (MLI) blankets. The database includes tests performed at normal (72%) and oblique incidence (28%), with impact velocities ranging from 0.6906 km/s to 9.89 km/s. There is wide variation in projectile and target geometry combinations, including projectile diameter to bumper thickness ratios, dp/tb, of 0.1 to 25.3, shield spacing to projectile diameter ratios, S/dp, of 0 to 96.5, and non-dimensional geometric
parameters, tw2S/tb3(from [2]), from 0 to 494261.
3.Artificial neural network
The neural architecture utilized in this study is known as a multilayer perceptron, or MLP, a common feed-forward artificial neural network. The MLP consists of a system of interconnected processing nodes (or neurons) that absorb arbitrarily complex and often non-linear mappings between two vector spaces for pattern recognition. Effectively a nested fit, MLPs are not amenable to the linear matrix techniques typically employed in regression fits. At their most basic, an MLP consists of three layers: an input layer, intermediate (or hidden) layer, and output layer, shown in Fig. 1.
Table 1. Overview of Whipple shield impact test database source.
Source Total tests Perforated Spalled Passed Failure limit
AFML-TR-67-324 [3] 53 28 0 25 Gas leak
AFML-TR-70-135 [4] 61 28 1 32 Gas leak
NASA CR-65222 [5] 103 10 0 93 Detached spall
Schaefer & Putzar [6] 55 55 0 0 Detached spall
ESA HIT [7] 35 8 0 27 Detached spall
Ryan et al. [8] 76 39 0 37 Detached spall
NASA CR-4343 [9] 158 55 30 73 Detached spall
Piekutowski et al. [10] 16 7 0 9 Detached spall
Reimerdes et al. [11] 6 3 0 3 Detached spall
NASA TM-2000-209907 [12] 53 41 0 12 Perforation
NASA TP-2003-210788 [13] 153 46 32 75 Various
The connection weights, wji, are tantamount to fitting coefficients that are evaluated by exposing the network to a set of
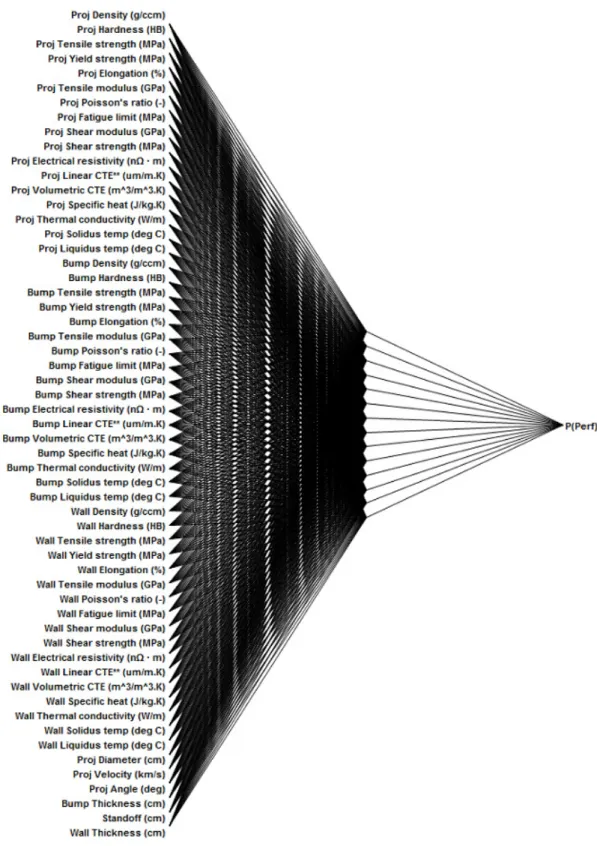
training data, or exemplars. For this study, the test data presented in Table 1 was used for training the MLP. A total of 57 inputs were used in the MLP, covering material properties, impact conditions, and shield geometry (shown in Fig. 2). The network output layer was a single node that provided a boolean prediction of Whipple shield perforation (P(perf)=1) or not (P(perf)=0). The network is trained on the test exemplars using a simple algorithm called back-propagation that iteratively corrects the connection weights until a global prediction error, E, is minimized. Typically, the global prediction error of a neural net is reported as the root-mean-square (RMS) training error, which is the average Euclidean distance between actual and desired network output patterns, the latter representing the experimental data (see, for instance [15]).
Fig. 1. A multi-layer perceptron [14] consisting of an input layer, hidden layer, and output layer.
3.1.Confidence bounds
The output of the MLP was an analogue prediction of the probability of perforation, P(perf), based on experimental conditions and shield design. The analogue prediction was then categorized as a perforation, P(perf)=1, or non-perforation, P(perf)=0, with the sigmoidal output of the MLP connecting these two plateaus (see Fig. 3). Three key points on this sigmoid were identified through application of an algorithm that searched it for (1) P(perf) = 0.5, identifying the critical level of any input parameter leading to perforation, (2) P(perf) = 0.1, and (3) P(perf) = 0.9. The latter two points were used to establish the width of the sigmoid, effectively defining an 80% confidence channel as an approximate measure of experimental error. The probabilistic nature of this output becomes evident when considering contradictory results (i.e. a mixture of pass/fail experiments for the same, or near identical conditions) as the learning algorithm seeks the minimum error in fitting inconsistent results. Less ambiguous test data produces sharp transitions in the sigmoid and thus lower magnitude uncertainty in the prediction, whereas experimental uncertainty broadens the sigmoid fit, shown in Fig. 3.
3.2.Network skeletonisation/input weighting
A common criticism in the use of neural networks for engineering app - it is inherently
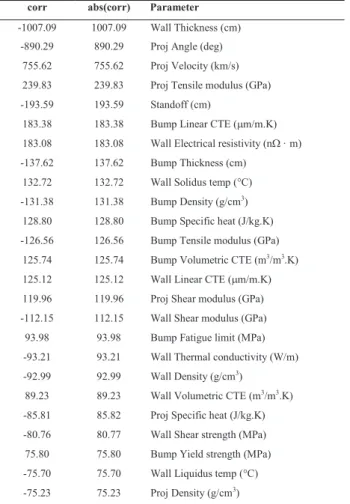
difficult to rapidly identify the key parameters and relationships within a trained net. Empirical techniques, conversely, may be less accurate, but provide a sense of security in that the influences of the parameters are directly apparent in the equation. To address this, the network was interrogated to identify and better understand the absorbed schema within the net (i.e. the key network inputs and interplay of connection weights in determining network outputs). The results of this analysis are shown in
the two hidden layer nodes with the largest magnitude connection weights). In the table we can identify some traditional parameters such as wall thickness, projectile velocity, shield standoff, etc amongst the most influential inputs. However, some expectedly important parameters such as projectile density and wall yield strength correlate less significantly with shield failure than some parameters not even considered in the empirical BLE, such as projectile tensile modulus, bumper linear coefficient of thermal expansion, wall electrical resistivity, etc. Further investigation is required to generate a fully validated list of critical factors, as the preliminary results are expected to be heavily influenced by issues in the statistical sampling of the data.
Fig. 2. Architecture of the artificial neural network used for predicting shield perforation. The network contains 57 nodes in the input layer (covering material properties, impact conditions and shield geometry), 14 nodes in the hidden layer, and a single node in the output layer (57/14/1 architecture) providing a boolean prediction of Whipple shield perforation (P(perf)=1) or not (P(perf)=0).
Fig. 3. The conceptual effect of ambiguity in the training data set on definition of the 80% confidence channel. Left: an ideal situation where there is a clean transition between perforation (black markers) and non-perforation (white markers) results, right: typical for hypervelocity impact test data. In this instance the vertical axis is probability of perforation, P(perf), while the horizontal axis is projectile diameter dp with constant impact velocity, v.. Table 2. The top 25 input parameters ranked in descending order of overall importance to network perforation predictions.
corr abs(corr) Parameter -1007.09 1007.09 Wall Thickness (cm)
-890.29 890.29 Proj Angle (deg) 755.62 755.62 Proj Velocity (km/s) 239.83 239.83 Proj Tensile modulus (GPa) -193.59 193.59 Standoff (cm)
183.38 183.38 Bump Linear CTE ( m/m.K) 183.08 183.08 Wall Electrical resistivity (n · m) -137.62 137.62 Bump Thickness (cm)
132.72 132.72 Wall Solidus temp ( C) -131.38 131.38 Bump Density (g/cm3)
128.80 128.80 Bump Specific heat (J/kg.K) -126.56 126.56 Bump Tensile modulus (GPa)
125.74 125.74 Bump Volumetric CTE (m3/m3.K) 125.12 125.12 Wall Linear CTE ( m/m.K) 119.96 119.96 Proj Shear modulus (GPa) -112.15 112.15 Wall Shear modulus (GPa) 93.98 93.98 Bump Fatigue limit (MPa) -93.21 93.21 Wall Thermal conductivity (W/m) -92.99 92.99 Wall Density (g/cm3)
89.23 89.23 Wall Volumetric CTE (m3/m3.K) -85.81 85.82 Proj Specific heat (J/kg.K) -80.76 80.77 Wall Shear strength (MPa) 75.80 75.80 Bump Yield strength (MPa) -75.70 75.70 Wall Liquidus temp ( C) -75.23 75.23 Proj Density (g/cm3)
4.Results
The predictive network was trained to an RMS error of 0.10 on all 769 exemplars presented in Table 1. This
corresponded to accurate predictions of the Pass/Fail result ( ) for
92.2% of t Comparatively, the JSC Whipple
shield BLE [16] correctly predicts the result in 71% of the tests, including 80% accuracy for .
In Fig. 4 the ANN output is plotted in terms of critical wall thickness required to defeat the test projectile (i.e. design
curve). The curve provides an excellent fit of test data for velocities between ~2.5 km/s and 7 km/s. Above 7 km/s the magnitude of the confidence channel is seen to significantly increase, due to ambiguity in the test data for similar shield configurations. Part of this ambiguity is due to inconsistency in the definition of failure amongst the test data sources in Table 1. In some instances, failure was defined as the onset of detached spall, while others specified failure upon gas leak or light transmission through the shield rear wall. Above ~7.2 km/s the ANN designs a rear wall thickness approaching zero. This is likely due to an absence of high velocity test data for comparable shield geometries, and the influence of tests performed on the same shield geometry at 45 and 60
and 60 with rear wall thicknesses of 0.3175 cm and 0.2286 cm respectively.
In Fig. 5 the ANN output is plotted in terms of critical projectile diameter required to defeat a specific shield configuration based on test SS-T2-2 from [9] (i.e. performance curve). In the figure, test data on similar configurations is also supplied. The ANN is shown to provide a good fit to the test data, particularly in comparison with the BLE. An 4.47 km/s. Due to the degree of scatter in hypervelocity impact testing, it is unlikely that even the most perfect predictive system could provide 100% accuracy (indeed ~90% may be the functional limit). The increasing critical diameter predictions above ~8 km/s are due to a lack of training data in this regime and are, as such, not valid.
The ANN curves in Fig. 4 and Fig. 5 show a number of additional features that, interestingly, correspond well with the phenomenological curve presented by Hopkins et al. in [17]. Some key features from the phenomenological curve can be identified, such as 1) an intact projectile; 2) the onset of projectile shatter; 3) limit of projectile fragmentation, and; 4) onset of projectile melting. For full definition of the impact regimes in the phenomenological curve, readers are directed to [17]).
Fig. 4. The ballistic limit design curve generated for the HD series of experiments from [8] by the ANN and JSC Whipple shield BLE. Curves are plotted as critical rear wall thickness, twc, predicted to defeat the test projectile.
Fig. 5. Ballistic limit performance curves based on test SS-T2-2 (from [9]) generated by the ANN and BLE. Curves are plotted as critical projectile diameter, dc, above which the Whipple shield rear wall is predicted to fail.
5.Summary and conclusions
An artificial neural network (ANN) has been utilized to predict the perforation limits of aluminum Whipple shields under hypervelocity impact. The network, a multilayer perceptron (MLP) architecture, has been built with inputs for material properties, Whipple shield geometry and impact conditions, and trained on a database of 769 impact tests collated from a range of sources. The output of the network was an analogue probability of perforation that was subsequently classified as a sigmoidal fit between perforation and non-perforation test results. This fit provided a physically plausible confidence channel (i.e. prediction error bounds) that defined a region of mixed pass/fail behavior, the size of which is dependent on ambiguity or conflicting results in the test data. Skeletonisation of the network was performed in order to identify the key traces through the hidden layer and measure the influence, and hence importance, of the input parameters. The interrogation revealed some traditional parameters amongst the critical inputs, such as wall thickness, projectile velocity and shield standoff, but also identified some unexpectedly important parameters such as projectile tensile modulus, bumper linear coefficient of thermal expansion, wall electrical resistivity, etc. These latter input parameters may be accidently identified by the network if the training data unwittingly used, for example, high resistivity materials in perforated shield designs and low resistivity materials in those that passed. A more widely sampled set of training data incorporating increased diversity in projectile and target materials would be expected to improve the network internal weighting for material parameters, as would a balanced design of experiments.
The ANN model was able to provide accurate Pass/Fail predictions for 92% of the 769 impact tests collected for this study. The leading empirical ballistic limit equation (BLE), comparatively, was found to be accurate for 71% of the tests. In addition to significantly increased accuracy, the network predictions are provided with confidence bounds, something lacking in current empirical methodologies. Furthermore, the ANN outputs were found to reproduce phenomenological curves, with key features such as shatter peak and melt peak easily identifiable.
Currently, the ANN model is limited to application in the parameter space over which clusters of measurements (i.e. HVI tests) exist, plus approximately 10% extrapolation in any parameter beyond these hypervolumes. To extend the application of the ANN, new data outside these regimes (e.g. very high and very low velocities) is required, preferably in a uniform sampling of the parameter space with equal proportions of pass and fail results. In addition to extending the application of the Whipple shield net to velocity extremes (both high and low), the ANN should be extendable to a wide range of other problems of interest, including: non-spherical projectiles, non-Whipple shielding configurations (e.g. honeycomb core
sandwich panels, stuffed Whipple shields, Nextel multi-shock shields etc.) and other impact regimes (e.g. ballistic). Such extensions are, in theory, only limited by the amount of test data available.
References
1. Willig, F.J. and H.W. Semon, A Multi-Stage H.E. Actuated Hypervelocity Gun, in Third Symposium on
Hypervelocity. 1958: Chicago.
2. Housen, K. and R. Schmidt, Whipple Shields Characterized by a Nondimensional Geometry Parameter. Journal of Spacecraft and Rockets, 1995. 32(1): p. 162-168.
3. Swift, H., J. Carson, and A. Hopkins, Ballistic Limits of 6061-T6 Aluminum Bumper Systems, 1967, University of Dayton Research Institute: Dayton, AFML-TR-67-324
4. Swift, H., et al., Response of Materials to Impulsive Loading, 1970, University of Dayton Research Institute: Dayton, AFML-TR-70-135
5. Maiden, C., et al., Experimental Investigations of Simulated Meteoroid Damage to Various Spacecraft Structures
(Summary Report), 1965, GM Defence Research Laboratories: Santa Barbara, NASA CR-65222
6. Schaefer, F. and R. Putzar, Triple Wall Ballistic Limit Equation, in Fourth European Conference on Space Debris. 2005: Darmstadt.
7. HIT - Hypervelocity Impact Test Database, European Space Agency.
8. Ryan, S., M. Bjorkman, and E.L. Christiansen, Whipple shield performance in the shatter regime. International Journal of Impact Engineering, 2011. 38(6): p. 504-510.
9. Schonberg, W., A. Bean, and K. Darzi, Hypervelocity Impact Physics, 1991, Alabama University: Huntsville, NASA CR-4343
10. Piekutowski, A., et al., Performance of Whipple shields at impact velocities above 9 km/s. International Journal of Impact Engineering, 2011. 38(6): p. 495-503.
11. Reimerdes, H., D. Noelke, and F. Schaefer, Modified Cour-Palais/Christiansen Damage Equations for
Double-Wall Structures. International Journal of Impact Engineering, 2006. 33(1-2): p. 645-654.
12. Hayashida, K. and J. Robinson, Double-Plate Penetration Equations, 2000, NASA Marshall Space Flight Center: Huntsville, TM-2000-209907
13. Christiansen, E., Meteoroid/Debris Shielding, 2003, NASA Johnson Space Center: Houston, NASA TP-2003-210788
14. Andina, D. and D. Pham, Computational Intelligence for Engineering and Manufacturing. 2007, Dordrecht: Springer.
15. Freeman, J.A. and D.M. Skapura, Neural Networks: Algorithms, Applications, and Programming Techniques. Computation and Neural Systems Series, ed. C. Koch. 1991, Reading: Addison-Wesley.
16. Ryan, S. and E.L. Christiansen, A ballistic limit analysis programme for shielding against micrometeoroids and
orbital debris. Acta Astronautica, 2011. 69(5-6): p. 245-257.
17. Hopkins, A., T. Lee, and H. Swift, Material Phase Transformation Effects upon Performance of Spaced Bumper
![Fig. 1. A multi-layer perceptron [14] consisting of an input layer, hidden layer, and output layer](https://thumb-us.123doks.com/thumbv2/123dok_us/9911469.2484332/3.816.235.599.96.417/multi-layer-perceptron-consisting-input-layer-hidden-output.webp)
![Fig. 4. The ballistic limit design curve generated for the HD series of experiments from [8] by the ANN and JSC Whipple shield BLE](https://thumb-us.123doks.com/thumbv2/123dok_us/9911469.2484332/6.816.93.713.539.933/ballistic-limit-design-generated-series-experiments-whipple-shield.webp)
![Fig. 5. Ballistic limit performance curves based on test SS-T2-2 (from [9]) generated by the ANN and BLE](https://thumb-us.123doks.com/thumbv2/123dok_us/9911469.2484332/7.816.130.719.106.476/fig-ballistic-limit-performance-curves-based-test-generated.webp)
