Procedia - Social and Behavioral Sciences 58 ( 2012 ) 1434 – 1442
1877-0428 © 2012 Published by Elsevier Ltd. Selection and/or peer-review under responsibility of the 8th International Strategic Management Conference doi: 10.1016/j.sbspro.2012.09.1128
8
thInternational Strategic Management Conference
A comparative performance analyze model and supplier
positioning in performance maps for supplier selection and
evaluation
*a b c
a,b Istanbul Kultur University
c Yildiz Technical University, 34349 Istanbul, Turkey
Abstract
In supply chain, supplier has an important role and in this situation supplier evaluation and selection is gained more significance for companies. So that, it is purposed to improve an evaluation model to evaluate and select suppliers ethodology and
-divest supplier evaluation from its general evaluation concept by presenting alternative selection criteria, suppliers and methods for working with positioning of these in performance maps.
Keywords: Supplier evaluation, Supplier selection, supplier performance, performance-effect analysis, supplier positioning.
2012 Published by Elsevier Ltd. Selection and/or peer-review under responsibility of The 8th
International Strategic Management Conference
* Corresponding author. Tel. + 90-212-383-2887 Email address: [email protected].
© 2012 Published by Elsevier Ltd. Selection and/or peer-review under responsibility of the 8th International Strategic Management Conference Open access under CC BY-NC-ND license.
1.Supply Chain Management
Supply chain management (SCM) is denned as the set of approaches utilized to efficiently integrate suppliers, manufacturers, warehouses, and stores, so that merchandize is produced in the right quantities, distributed to the right locations, and at the right time, in order to minimize system-wide costs (or maximize profits) while satisfying service level requirements (Mak, 2009). For this reason, the firms which provides supply chain support service processes, is called as supplier, has an important role in the supply chain management. In addition, selection and evaluation of suppliers are the critical decision problems for efficient supply chain management.
Supplier selection is sometimes highly complex, since it incorporates a great variety of uncontrollable and unpredictable factors that affect the decisions involved. This should prompt careful attention to the way in which such decisions are reached and justified, and would consequently suggest (among other things) the use of decisional models to support procurement decision making. Moreover, supplier assessments or ratings should be done routinely to ensure that incoming materials meet relevant quality standards (Bevilacqua, 2006).
There are lots of studies in literature about supplier evaluation and selection. Some of these studies are summarized here. Lee et.al. (2009) propose a model for evaluating green suppliers. They use the Delphi method to differentiate the criteria for evaluating traditional suppliers and green suppliers. To consider the ic named as Adaptive Neuro Fuzzy Inference System (ANFIS) based model for supplier selection problem. The model which they suggest takes the learning advantage of neural networks and integrates this with fuzzy logic that represents human reasoning mechanis
by investigating possible quantitative and qualitative criteria from the earlier studies in the literature and in this study they report the buyer supplier integration level.
Generally companies evaluate their suppliers by financial indicators. But these financial indicators are not enough because of the reasons listed below:
Financial indicators are determined by past data.
Financial indicators are not concerned with the customer service, mannerism and quality which have a strategic importance.
Financial indicator are not concerned with operational efficiency directly.
Because of these reasons, in supply chains, the evaluation methods below are suggested for suppliers performance evaluations:
Balanced scorecards SCOR Model Logistics scoreboard Activity based cost Economical added value
2.Strategic measurement methodology
The above information
The information and methodologies contain important knowledge about the companies will work which suppliers. But, in this stage there is not an efficient strategic measurement methodology to have functional excellence from the customer perspective. At this point, the analyses are bounded because companies cannot have the appropriate comparison values according to the significance and accuracy. The results of these methodologies must be analyzed to make strategic actions and be compared with other existed functional indicators. In this study, to have action plans and to make comparative performance assessments, a statistical analyze based methodology is suggested.
2.1. Methodology
In the first stage, a form about the supply chain processes and suppliers is prepared to send the companies experts and supervisors and managers by e-mail. The assessments are made by Likert scale (5: very good-1: Very poor). For the analyses of assessments, the weighted satisfaction rate calculation and correlation analysis are used.
2.2. The suppliers evaluation criteria The criteria in the form are:
a. To keep up with critical situations b. Meeting the demand
c. Meeting the cost requirements d. Process capability and quality e. Personnel capability
f. To match the lead times g. To be solution-oriented h. Accessibility
i. To keep up with technological developments j. Communicating
k. The general efficiency
2.3. Criteria evaluation
The criteria will be evaluated by two different analysing techniques. The first technique is the weighted satisfaction score. To calculate this score and to make the reliability and homogeneity tests SPSS 18 is used. The scoring methodology is explained below:
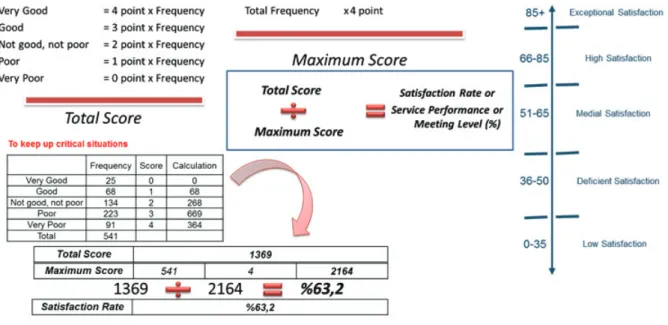
2.3.1. Weighted satisfaction score
In this technique, the Likert scale scores and the frequency of the Likert scale score are multiplied and the total score of criteria is found. By rating this total score to the maximum evaluation score (this occurs when all of the research participants give the highest points), a satisfaction rate is handled. This rate can be called as service performance score or satisfaction/efficiency rate or meeting level. In the below flow, the calculation details and an example are shown.
Figure 1. The calculation details
2.4.Correlation analysis (effect value determination)
Effect or importance value, in other words information score, is a rate which shows the relationship -criteria scores. To determine this rate, correlation analysis is made.
Statistical analysis defines the variation in one variable by the variation in another, without establishing a cause-and-effect relationship. The coefficient of correlation is a measure of the strength of the relationship between the variables; that is, how well changes in one variable can be predicted by changes in another variable [1].
The correlation coefficient, denoted by r, is a measure of the strength of the straight-line or linear relationship between two variables. The correlation coefficient takes on values ranging between +1 and -1. The following points are the accepted guidelines for interpreting the correlation coefficient [2]: 1. 0 indicates no linear relationship.
2. +1 indicates a perfect positive linear relationship: as one variable increases in its values, the other variable also increases in its values via an exact linear rule.
3. -1 indicates a perfect negative linear relationship: as one variable increases in its values, the other variable decreases in its values via an exact linear rule.
4. Values between 0 and 0.3 (0 and -0.3) indicate a weak positive (negative) linear relationship via a shaky linear rule.
5. Values between 0.3 and 0.7 (0.3 and -0.7) indicate a moderate positive (negative) linear relationship via a fuzzy-firm linear rule.
6. Values between 0.7 and 1.0 (-0.7 and -1.0) indicate a strong positive (negative) linear relationship via a firm linear rule.
7.
8. Linearity Assumption. The correlation coefficient requires that the underlying relationship between the two variables under consideration is linear. If the relationship is known to be linear, or the observed pattern between the two variables appears to be linear, then the correlation coefficient provides a reliable measure of the strength of the linear relationship. If the relationship is known to be nonlinear, or the observed pattern appears to be nonlinear, then the correlation coefficient is not useful, or at least questionable.
Correlation coefficient (Montgomery, 2007):
2 / 1 2 i 2 i i i ] ) Y Y ( ) X X ( [ ) X X ( Y R
2.5. Performance effect analysis methodology 2.5.1. Supplier evaluation
In supplier evaluation not only the supplier analysis is done, also the general supply chain management perception is done for the related company. The objective is to measure the effectiveness of suppliers in teria is important firstly and the company work primarily with which supplier is investigated and determined. From this
features scoring by Likert scale.
criteria and supplier criteria correlatio correlation matrix.
These effect rates and performance scores are positioned in these titles on a coordinate system which Strong and Important Criteria:
These criteria which have a high level performance/efficiency and effect/importance, is evaluated mainly
Secret Criteria:
These criteria which have a high level performance/efficiency and low level effect/importance, is evaluated secondly
Poor and Unimportant Criteria:
These criteria which have a low level performance/efficiency and effect/importance, is not evaluated preferential
Standart Criteria:
These criteria which have a low level performance/efficiency and high level effect/importance, is open to improvement
Figure 2. Comparative performance analysis model for supplier evaluation criteria
the criteria based evaluation for supplier selection. 2.5.2.Supplier selection
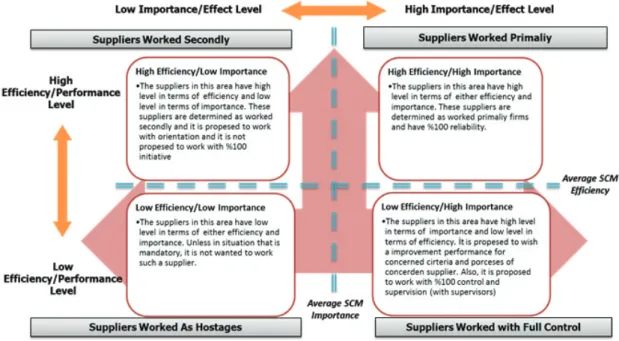
In terms of making an evaluation for suppliers general performance and efficiency, an average value for performance and effect/importance is calculated by arithmetical average of criteria performance scores (efficiency rate/satisfaction rate/meeting level) and effect/importance rates. These average performance and effect rates are positioned in a coordinate system which is called in this paper as
r. But, there are important things in this map those are comparison values for performance and effect. These comparison values are calculated by titles on the performance map:
Suppliers worked primarily:
The suppliers which have high level performance/efficiency and effect/importance Suppliers worked secondly:
The suppliers which have high level performance/efficiency and low level effect/importance Suppliers worked such as hostages:
The suppliers which have low level performance/efficiency and effect/importance Suppliers worked with full control:
The suppliers which have low level performance/efficiency and high level effect/importance This performance map model is showed below:
Figure 3. Comparative performance analysis model for supplier selection
3.Conclusion
meeting level for supply chain of company with performance of suppliers to see efficiency of supplier on supply chain management. Also, designing model presents alternatives with the situations that show to which times, which alternative are used and propose to activity that is made.
For instance, this model will recommend that:
(Results in this table are not current)
This table shows, generally strong and poor indicators of suppliers. According to this table, the making decision for suppliers will be more efficiency in terms of company needs. But this evaluation is more intuitive. Also, it is improved to convert this evaluation to selection with a statistical analyze that is correlation with company needs and calculation of average performance and effect values. And this analyze will give that results:
(Results in this table are not current)
After to see results of analyses, it is clear to improve model but it can be proposed to use AHP model to score criteria and with a supplier panel research, results of model can be compared with study.
References
-Purchasing & Supply Management 12 (2006) 14 27.
Lee A.H.I., Kang H.Y., A green supplier selection model for high-tech industry Expert Systems with Applications 36 (2009) 7917 7927.
alifornia, Berkeley.
fuzzy inference system to supplier Strong and Important Criteria Secret Criteria Poor and Unimportant
Criteria Standart Criteria
Process capability and quality To be solution-oriented Personnel capability Communicating
The general efficiency Meeting the cost requirements
Z Supplier Meeting the cost requirements Accessibility To keep up with critical
situations To match the lead times
Meeting the cost requirements Personnel capability The general efficiency To keep up with critical
situations
To be solution-oriented Process capability and
quality
Communicating To match the lead times
To keep up with technological developments
Meeting the demand Company Needs
Accessibility
Personnel capability To keep up with technological
developments Accessibility
X Supplier
Meeting the demand
To match the lead times Y Supplier
Suppliers worked primarily: Suppliers worked
secondly:
Suppliers worked such as hostages:
Suppliers worked with full control:
selection problem Journal of Engineering and Natural Sciences, Sigma 28,224-234.
quantitative supplier selection criteria considering the buyer-supplier integration strategies', International Journal of Production Research, 46: 7, 1825 1845
[1] http://www.allbusiness.com/glossaries/correlation-analysis/4964988-1.html [2] http://www.dmstat1.com/res/TheCorrelationCoefficientDefined.html