POLICY RESEARCH WORKING PAPER.
1360
Are Portfolio Flows
-elopingcounuiesmust
E
compete with each other fUrto Emergig Markets
the poolof
private voluntarycapital allocated by portfolio
Complementary
tomp
ementary
managers to emergingor Com
petitive
?
-
market securities. Tocompete
for such investment, developing country
Sudarshan Gooptu policymakers must send tie :
night signals about domestic economic and institonal reforms to international capital markets.
The World Bank
In=enational Ecoiomics
Department
In=enadional Finace Divison.Setember 1994
Public Disclosure Authorized
Public Disclosure Authorized
Public Disclosure Authorized
POLIcY RESEARtH WORKING PAPER 1360
Summary findings
Increasing portfolio investment flows to emerging markets (India, Indonesia, the Republic of Korea, and markets in the past few years have led to fears of a Thailand in Asia, and Argentina, Brazil, Chile, and sudden revcrsal of these flows and possible portfolio Mexico in Latin America) for the period from the first switching (from one emerging market to another) among quarter of 1989 to the second quarter of 1993.
foreign investors. Results indicate an inverse relationship between total
To assess the sustainability of such portfolio flows, portfolio flows to emerging Asian stock markets and Gooptu examines econometrically whether portfolio those to Latin America. This negative relationship holds investment flows to one region in the developing world for both debt portfolio flows (through bonds, certificates are significantly related to those going to another region. of deposit, and commercial paper) and e4uity portfolio
This question has important policy implications for flows (through closed-end couantry funds, depository policymakers in developing countries who, in receipts, and direct equity purchases by foreigners in the considering domestic policy reforms to attract foreign emerging markets).
portfolio investment, want to ascertain whether financial There has been a surge of portfolio flows to flows from abroad are coming from an increasing pool of developing countries in the 1990s, but developing investible resources in the industrial world or whether countries must compete for those flows.
they rcpresent the same funds (for examplc, 'hot In the long term, portfolio flows to well-performing money') chasing different high-yield securities as countries will be sustained because of improved
emerging markets change. creditworthiness and proportionately greater investor
In other words, does a sort of 'adding-up" constraint interest (however marginal, on the whole). Increasing the apply to these flows - do they function as substitutes- pace of reform in an emerging stock market is essential or not? Or could these flows be complementary? for sustaining portfolio flows.
Gooptu analyzes new quarterly World Bank data on gross portfolio investment flows for eight emerging
This paper - a product of the International Finance Division, International Economics Department - is part of a larger effort in the department to analyze the behavior of private capital flows to developing countries. Copies of the paper are available free from the World Bank, 1818 H Street NW, Washington, DC 20433. Please contact Rose Vo, room S8-114, extension 31047 (32 pages). September 1994.
Cbe Policy Research Workg Paper Soducesdby the PoiRse Dissemina pror to Cenoge r hc cc^ac of ieas abos developmcnt cns. An objcstiuc of fhe series is to get the findnW 0uw qwlkzy, ever if th romta_ns arc less than fully polished. Tc pap7s carry the nam of the authors and should be used and cited accwxlrngly. The rjndgs;, hdrpsretons, and condusins are the
autbors'oun and shosdd not be attrihsed ro the WorldBaik, its Erecct Board ofDitos, or any of ismmcm6crcounre
Are Portfolio Flows to Emerging Markets Complementary
or
Competitive?*
by
Sudarshan Gooptu
Intemational Economics Department World Bank
SUMMARY
Increasing portfolio investment flows to emerging markets in the last few years have led to fears about a sudden reversal of these flows and possible "portfolio switching" activities of foreign investors from one emerging market to another in the short run. In an endeavor to address this issue of sustainability of portfolio flows to emerging markets, this paper econometrically examines whether portfolio investment flows (rather than equity returns, that has been the subject of earlier studies) to one part of the developing world are significantly related to those going to another region. This has important implications for policy makers in developing countries who wish to attract portfolio investment from abroad through domestic policy reforms and, in doing so, are trying to ascertain whether these financial flows from abroad are coming from an increasing pool of investible resources from the industrialized world, or whether it comprises of primarily the same fimds (e.g. "Hot Money") chasing different high-yield emerging market securities as conditions in each market change over time. In other words, is there a sort of "adding up" constraint that applies to these flows, making them fiaction as substitutes or not? Or could there even be complementarities among these flows?
This study conducts an econometric analysis of new quarterly World Bank data on gross portfolio investment flows for a sample of eight emerging markets (namely, India, Indonesia, South Korea and Thailand in Asia, and Argentina, Brazil, Chile and Mexico in Latin America) for the period 1989Q1-l993Q2. Results indicate the existence of an inverse relationship between total portfolio flows to Asian emerging stock markets and those to Latin America. This negative relationship holds both for debt portfolioflows (i.e. through bonds, certificates of deposits and commercial paper) and equity portfolio flows (i.e. through closed-end country funds, depository receipts and direct purchases by foreigners in the emerging markets), examined separately. Therefore, not only has there
been a surge of portfolio inflows to developing countries in the 1990s, there also exists real competition for these flows among developing countries. In addition, gross total portfolio flows to Latin America were found to be more significantly related to those going to East Asia (Indonesia, South Korea and Thailand in this sample) dtan those to South Asia (i.e. India in this sample).
Hence, developing country policy makers are really in competition to provide the right signals to intemational capital markets, in terms of economic and domestic institutional reforms, that attract portfolio investment from abroad. They are in competition with other developing countries for the pool of private voluntary capital that is allocated by portfolio managers to the emerging markets group. Over the long term, portfolio flows into "well performing" countries will be sustained by improved creditworthiness and increased interest of international institutional investors to allocate a share (even though marginal) of their large investible portfolio to these markets. In addition, the results highlight the need to continue the increasing pace of reforms in as given emerging stock market in order to maintain the sustainability of portfolio flows to that country over the long ternm
'The findings, interpretations, and condusions in this paper are entirely those of the author. Thcy do not necessauily represent the views of the World Bank its Execuive Directors or the countries the reprsenL I would like to thank Sarbashis Ohosh Irr his excellentesearch assistnce, Paul Amnington, LeonardoHernandez and Ntandu Marningi for their useu commrnts.
JEL Classification Codes: G15, C12 and F3.
Portfolio Flows to Emerging Markets Complementary or Compefitive?
* * {~~~~~. .
INTRODUCTION
The 1990s have seen a rapid increase in portfolio investment flows to emerging markets. According to the World Bank's World Debt Tables, 1993-94, gross portfolio
investment flows to developing counties increased from $7.5 billion in 1989 to about
$36.8 billion in 1992. The level of gross portfolio flows to these markets during 1993 is
estimated to be $55.8 billion'. Recent estimates of gross portfolio investment flows in
developing counties (See Gooptu (1993) and World Bank (1993a)) show that, although the magnitudes involved are large, these flows have been going to a few developing
countries. For example, between 1989 and 1992, five countries accounted for over
two-thirds of the cumulative total gross portfolio investment flows to developing countries,
namely, Argentina, Brazil, Mexico, South Korea and Turkey (See Ahmed and Gooptu (1993))2.
Previous studies on international linkages between stock markets have focused
prnmarily on those of the industial countres and have examined equitb retune rather than equity
s.
This is a result, until recently, of the non-availability of relevant data on portfolio flows over a long enough time period to allow for meaningful applications ofeconometric techniques. This paucity of portfolio flows data has been especially critical
in the case of developing countries. Researchers have used a variety of methodologies to
examine the intemational capital market linkages. For example, Hilliard (1979) and Levy and Samat (1990) have examined the contemporaneous and lagged correlatons in the
rates of return across equity markets. Hilliard (1979) analyzed the effect of the OPEC
Embargo (July 1973 to April 1974) on the behavior often equity market retum indices.
1 Source: Wodd Bank, WorldDebt Tablis. 1993-94. Volumc 1. Table 1.5, p. 21.
2 ThCS estmats exclude the uNew Moncy bonds hat were issued in Brady-type debt and debt service (DDSR) padgca smce
tihy wcre part of a concerted debt resuctiog operations and not truly voluntay private capitla fiom abmad.
He found that these indices moved simultaneously across countries in the same continent
but were not closely related across continents. Levy and Samat (1990) also showed the
lack of interdependence across equity market retunms and, therefore, supported the
diversification benefits of international investment. Eun and Shim (1989) analyzed the
interdependence structure of nine developed equity markets using daily data between
1980-1985. They find, using vector autoregression (VAR) analysis, that although
developments in the U. S. exchanges are rapidly transmitted overseas, movements in other equity markets do not explain the behavior of U.S. stock market returns. Similar
results have been obtained by Becker. Finnerty and Gupta (1990) who looked at the U.S.
and Japanese equity markets over time, and Hamnao, Masulis and Ng (1990) who used the
autoregressive conditional heteroskedastic (ARCH) model to examine short-run interdependence of stock prices across the U.K., U.S. and Japan.
The behavior of equity retums in industrial countries around the October-1 987 crash has been examined by Arshanapalhi and Doukas (1993), Lau and Mclnish (1993).
Recently, Park and Fatemi (1993) have used the VAR approach to examine the linkages
between the emerging markets in the Pacific-Basin (namely, Hong Kong, South Korea,
Taiwan and Thailand, among others) and the equity markets in the U.S., U.K. and Japan.
They find that despite their strong economic integration with industrial countries, these
emerging markets exhibit a weak linkage to the equity markets of the U.S., U.K and
Japan. More interestingly, they find that "as these markets have grown in size, both in absolute and in relative terms, and as government regulation has eased (in some cases
relaxing rules on access by foreign investors), the linkages have strengthened."
Availability of flow data of late has permitted researchers to address the issue of
possible linkages between international equity markets from the point of view of por(folio
flows. Tesar and Wemer (1993) have examined the behavior of U.S. equity investment
flows in 19 countries. They find that net equity purchases by U.S. investors are generally not significantly correlated across countries. They also find that cross conrelation
coefficients between emerging markets are small and of ambiguous sign. Their results
are based on simple correlation coefficients without addressing possible problems that
may arise due to the existence of spurious correlationis over the long term. Tsetsekos
(1993) devised a model to show that when cross border equity markets are cointegrated,
the correlation between the retums from these markets is a function of the length of the
investment horizon. As the investment horizon increases, the correlation between the
cointegrated market approaches unity, suggesting limited diversification hbnefits over the long run. On the basis of this model he found that the emerging equity markets in his
sample were not co-integrated, thereby implying possible diversification benefits from
investing in these markets. Hence, testing for the existence of co-integrated relationships
is an essential exercise before examining correlations between equity markets. This paper takes this approach a step fiurther by examining whether there is any significant linkage
between gross portfolio investment flows to the emerging markets of Latin America and
those to Asia. In contrast to Tesar and Werner (1993), this study looks at portfolio
investment flows through both equity and debt instruments.' Tests are conducted for
total portfolio flows, as well as separately for debt portfolio flows and equity portfolio
flows to emerging markets, to ascertain whether there is a significant relationship
between these flows across Latin America and Asia
This has important implications for policy makers in developing countries who wish to attract portfolio investment from abroad through domestic policy reforms and, in
doing so, are trying to ascertain whether these financial flows from abroad are coming from an increasing pool of investible resources from the industrialized world, or whether
3 Equityporfolio bwestmnent is in through dosed-end countiy finds, depository receipts (ADRs and GDRs) and direct purchases by
foreigners in the emerging stock markeLt Debt Portfolio investment is through bonds. certificates of deposit and commercial paper.
For details see Gooptu (1993).
it comprises of primarily the same funds (e.g. "Hot Mo w'y") chasing different high-yield
emerging market securities as conditions in each market change over time. Any
relationship across regions in portfolio investment flows will have significant
implications regarding the type of policy prescriptions a country must adopt in order to
ensure sustainability of portfolio investment flows over the next few years.
Some analysts have tried to explain the distinction between "Hot Money" and
long-tern sustainable portfolio flows in terms of ascertaining the motivation for these
flows. Chuban (1994), Howell and Cozzini (1992), and Gooptu (1993) have found that
the choice of instrument of portfolio investment to emerging markets is different for
different investor groups. For example, institutional investors look for stability and long-term returns from their portfolios while retail securities traders typically look for
short-term high yield instruments. Although portfolio investment in developing countries has increased substantially in recent years, it remains a very small share of the asset portfolios
Of international institutional investors. What rmains is a dominance in some emerging markets of high yield-oriented retail and wholesale portfolio managers whose
performance is generally based on whether the return from their portfolios is higher than
some benchmark (such as the S&P 500 index or the IFC Emerging Markets [ndex, among
others) in the short run. Other portfolio investors in these markets allocate a small share
of their total investible portfolios to emerging markets for portfolio diversification
reasons. These groups of investors generally continuously rebalance their emerging
markets portfolios in order to maintain high average returns. Under these circumstances,
each emerging market must compete for a share of these funds through removal of
barffers to entry into their securities markets and efforts to improve their economic and financial performances (and thereby increase their creditworthiness) through appropriate
domestic policy reforms,4 This phenomenon was alluded to in Park & Fatemi (1993) in their analysis of equity returns. It is this issue of the competition among emerging
markets in an endeavor to attract portfolio investnent from abroad that this paper sets out to address, using portfolio flow data.
The paper is organized as follows: Section I provides a description of the magnitudes involved in these emerging market portfolio flows and delineates the
foundation for the hypotheses that are tested econometrically. Section 2 discusses the data
and methodology used for arriving at the empirical results, which are provided in Section
3 of the paper. The main conclusions of the study and the policy implications for developing country policy makers in the context of their access to portfolio investment
from abroad are provided in the last section of the paper.
1. TRENDS IN PORTFOLIO FLOWS TO EMERGING MARKETS5
Private capital flows to developing countries have, for the first time since the
international debt crisis of the early 1980s, surpassed the volume of official flows to developing countries in 1992-93. This shift in the creditor composition of extemal
financing to developing countries has been accompanied by a similar shift in the
borrower composition. Private to private flows now account for almost 60 percent of net
flows to developing countries. These flows have been primarily in the form of portfolio
investment (through bonds and equities) and foreign direct investnent.
Portfolio flows increased from about $7.5 billion in 1989 to $36.8 billion in 1992,
and topped an estimated $55.7 billion in 1993 (Table 1). Since 1989, more than half the
4
1hese portfolio switching' activitics between emerging markets coexist with the overall increase in the share of foreign investors! portfolios that arc allocated to emerging markets in genral. These two effects are analogous to the "substitution cffccr and 'income effcctC associated with a change in relative prics of commodities.
5
Sources: World Bank, World Debt Tables, 1993-94, Volume l; Qanrerty Review of Financial Flows to Developing Counires
(various issues); and GlobalEconomic Prospects, 1993.
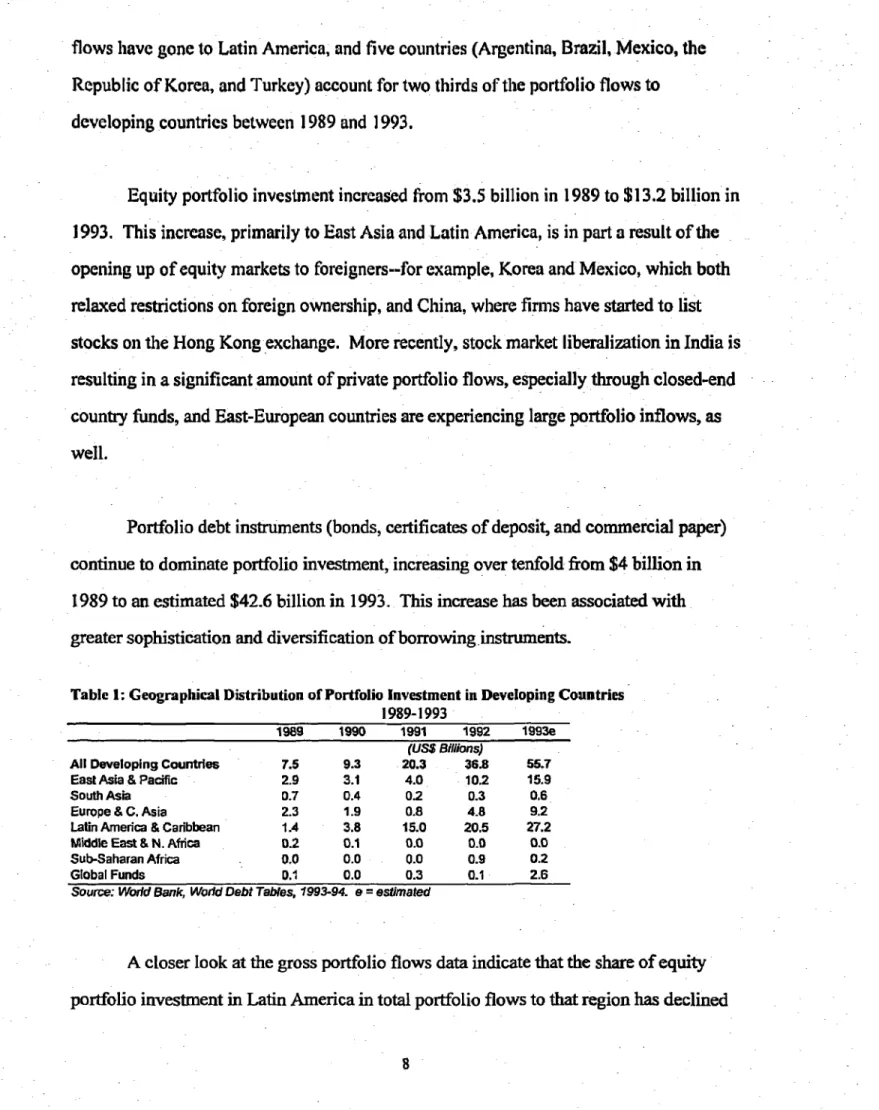
flows have gone to Latin America, and five countries (Argentina, Brazil, Mexico, the
Republic of Korea, and Turkey) account for two thirds of the portfolio flows to
developing countries between 1989 and 1993.
Equity portfolio investment increased from $3.5 billion in 1989 to $13.2 billion in
1993. This increase, primarily to East Asia and Latin America, is in part a result of the opening up of equity markets to foreigners--for example, Korea and Mexico, which both
relaxed restrictions on foreign ownership, and China, where firimls have started to list
stocks on the Hong Kong exchange. More recently, stock market liberalization in India is
resulting in a significant amount of private portfolio flows, especially through closed-end
country funds, and East-European countries are experiencing large portfolio inflows, as well.
Portfolio debt instruments (bonds, certificates of deposit, and commercial paper) Continue to dominate portfolio investment, increasing over tenfold from $4 billion in
1989 to an estimated $42.6 billion in 1993. This increase has been associated with greater sophistication and diversification of borrowing instruments.
Table 1: Geographical Distribution of Portfolio Investment in Developing Countries 1989-1993
1989 1990 1991 1992 1993e
(US$ Billions)
All Developing Countries 7.5 9.3 20.3 36.8 55.7 East Asia & Pacific 2.9 3.1 4.0 10.2 15.9
South Asia 0.7 0.4 0.2 0.3 0.6
Europe & C. Asia 2.3 1.9 0.8 4.8 9.2 Latn America & Caribbean 1 A 3.8 15.0 20.5 27.2 Middle East & N. Afica 0.2 0.1 0.0 0.0 0.0 Sub-Saharan Africa 0.0 0.0 0.0 0.9 0.2
Global Funds 0.1 0.0 0.3 0.1 2.6
Source: World Bank, World Debt Tables, 1993-94. e = estimated
A closer look at the gross portfolio flows data indicate that the share of equity
portfolio investment in Latin America in total portfolio flows to that region has declined
since 1992 while that in the East Asia and the Pacific region increased. There have also
allegedly been a significant amount of portfolio rebalancing by investors by "switching" their portfolio allocations from one emerging market to anotlher. Table 2 highlights the
marked increase in portfolio investment flows, especially in equities, to Asia as compared
to the emerging markets in Latin America in 1992. This has been accompanied by an
increase in the number of regional closed-end country funds that endeavor to tap these
switchable portfolio investments in emerging markets. It is this portfolio "switching"
behavior by investors between different emerging markets that this paper sets out to examine.
Table 2: Gross Portfolio Flows to Asia nad Latin America, 1989-93
CUSS billions) 1989 1990 1991 1992 1993e
EastAsia & Pacific 2.9 3.1 4.0 10.2 15.9 Equity Portfolio Investment 2.6 2.2 1.0 4.5 4.2
Debt Portfolio Investment 0.3 0.9 3.0 5.7 11.7 South Asia 0.7 0.4 0.2 0.3 0.6 Equity Portfolio Investment 0.2 0.1 0.0 0.3 0.3 Debt Portfolio Investment 0.5 0.3 0.2 0.0 0.3 Latin America & Caribbean 1.4 3.8 15.0 20.5 27.2 Equity Portfolio Investment 0.4 1.1 6.2 7.9 6.0 Debt Portfolio Investment 1.0 2.7 8.7 12.6 21.2
Source: Computed by authorfrom data in WYorld Bank World Debt Tables. 1 993-94
NVote: a = estimated
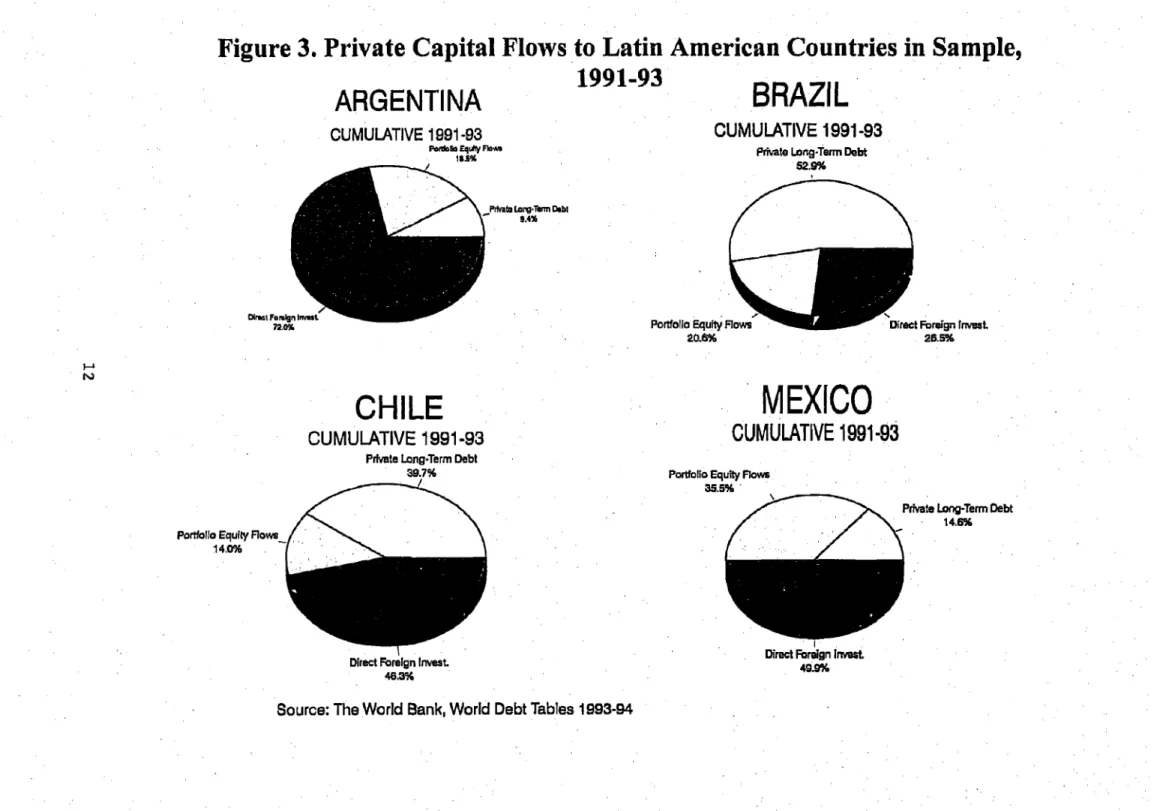
Figures I and 2 show the behavior of gross portfolio flows in the sample of
countries included in this study. It can be gleaned from these charts that although total
portfolio flows have increased between 1991-93 in both Latin America and Asia, equity portfolio flows to the countries in Latin America are declining since 1992 while those to
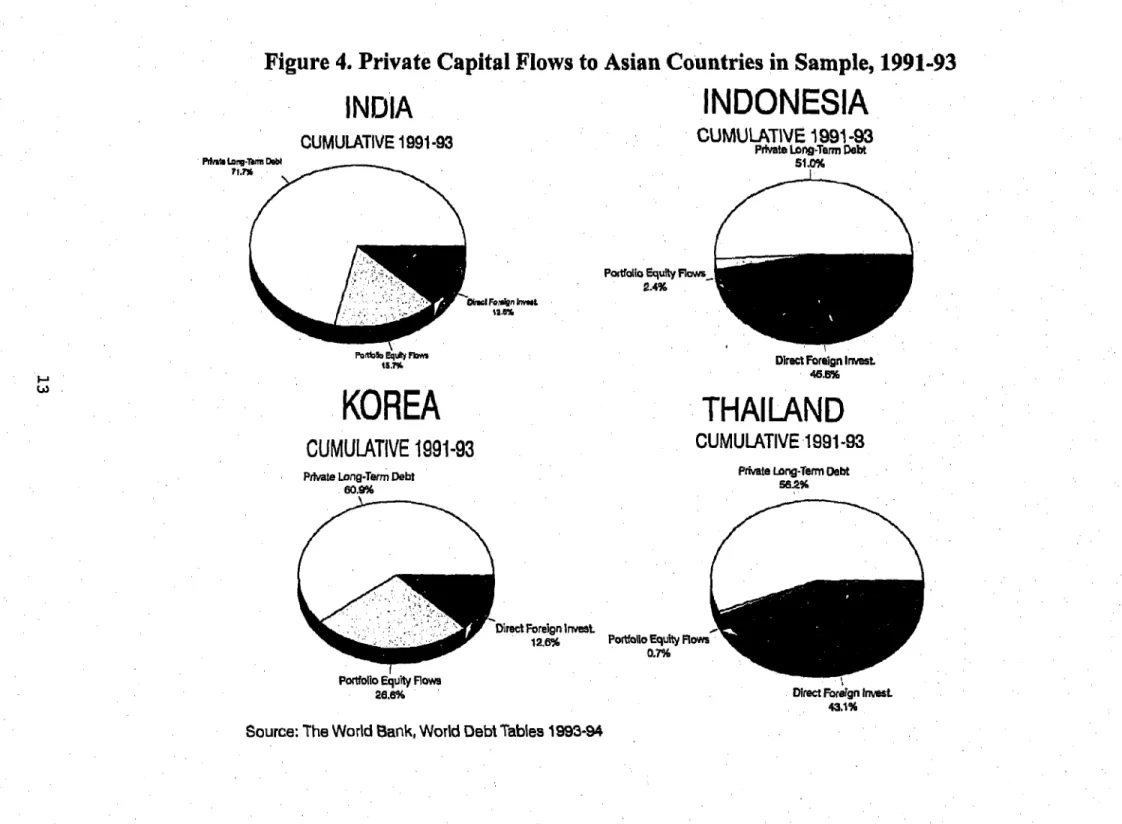
Asia were stagnant during the same period. Figures 3 and 4 show the diversity in the composition of private capital flows to the eight countries being examined here.6 Figure
5 shows that about 90 percent of the gross portfolio flows to Latin America (bonds and
6 Private long-term debt includes intemational bond issucs and portrolio investments through Certificates of Dcposits and
Commcrcial Paper.
equities)
in 1991-93
went to the four countries
included
in this study. Similarly,
about 72
percent of the gross portfolio
flows to Asia in 1991-93
went to the four countries
included
in this study.
Chuhan (1994) lhas found that institutional
investors from Canada, Germany,
Japan, U.K., and the U.S. have not led the growth in portfolio investment
in emerging
markets. These investors, who otherwise
are major playcrs in the intemational
capital
markets, have approached
developing
country securities
markets
with great caution. The
share of their total assets that is invested
in developing
country stocks is typically
around
0.2 percent. Only about 5 percent of their foreign equity holdings are invested in
developing country equities. In 1992, only 3 percent of emerging stock market
capitalization
was in the hands of foreign pension funds and insurance companies.
The
total investible
portfolio
of institutional
investors
is very large and any marginal increase
in their investments
in emerging
market securities
will be translated into a significantly
large portfolio investment
inflow relative to the market capitalizations
in these markets.
Institutional investors generally enter markets with significant liquidity (market
capitalizations)
and claim to have a longer time horizon in their risk-retum assessments
than other investors such as performance
based retail traders. Given that their current
exposure
in the developing
country
stock markets
is very small, one would expect that the
portfolio switching activities by other investors currently in the emerging markets,
indeed, may be significant,
given their predominantly
short-term risk-retum
decision-making process in portfolio allocations. So, any country that is showing a good track
record in its reform process may by interpreted
to have a lower risk and higher expected
retums from portfolio investments
there. Consequently,
larger portfolio flows are
expected to go to countries with "good" track records of liberalization, fiscal
consolidation
and regulatory
reform than to those emerging
markets that do not exhibit
such a performance
on a sustained
basis.
Figure 1. Gross Portfolio Flows to Latin America
Selected Countries
US$ millions
25
20 --.
---
---
7- - -- - - - -_ --_10
l_
-5
-0
1989
1990
1991
1992
1993
Note: Latin America includes Argantina, Brazil, Chile and Mexico
Figure 2. Gross Portfolio Flows to Asia
Selected
Countries
US$ millions
25
2
0-
15-10 --- ----5 --- ----.0
#tt ;$~r4¢wwtttMti
Equity -- " 4f~w;| | Flows 1f.,..
1989
1990
1991
1992
1993
Note: Asia includes India, Indonesia, Korea and Thailand
Figure 3. Private Capital Flows to Latin American Countries in Sample,
ARGENTINA
1991-93
BRAZIL
CUMULATIVE 1991-93 CUMULATIVE 1991-93
PraRM Equy F1a, Private Long-Ternm Debt
52.9%
'flv.?a Larg-Thrm Debt
9.4%
72. t Portfolio Equity 1:10w _ Direct Foreign Invst
-20.8%36 26.5%
CHILE
MEXICO
CUMULATIVE 1991-93
CUMULATIVE
1991-93
Private Long-Term Debt
39.7%e Portfolio Equity Frows
Pr;vate Long-Term Debt 14.6% Porttollo Equity Flows
14.0%
Direct Foreign Invest DirectrignIst
46.3%.
Figure 4. Private Capital Flows to Asian Countries in Sample, 1991-93
INDIA
INDONESIA
CUMULATIVE 199i-93
CUMULATIVE
1991-93
Privat LogTerm DebtPitjem LorgiV-Tm Deb
Po_/foa .quiy Fkows
2.4%
budi Formn knvue
Far*lb EqA rbvvi Direct Foreign Irrmest
KOREA
THAILAND
CUMULATIVE
1991-93
CUMULATIVE
1991-93
Prhvate Long-Term Debt Piate Long-Term Debt
Pdmie Long-Term Debt W~~~~~5A%
< :jS' ~~~~~~~Direct Frelin lvest,
D:rsd Foreign 16st -- Porfolio Equity Fbws 0.7%
Portfollio Equity Flows
26.6% Dir.rt Fbregn IrweeL
43.1%
Figure 5. Gross Portfolio
Flows
Cumulative 1991-93.
Brazil
Korea
Chile
(2'.6%)
Argentina
(42.6%)
(2.1%)
Argent/n
g <
S
~~~(14.0%)(l
O
6
°c)
\.O/ ~~~~~~~Indonesia(10.6%)
Others
India
(11.7%)
Thailand
(6.9%)
Mexico
(I11.9%)
(50.5%)
Others
(28.0%)
Latin America
Asia
Therefore, on the basis of these stylized facts, any functional relationship between
portfolio flows to Latin America relative to Asia should postulate an inverse relationship.
That is, when portfolio flows to Asia increase one should expect to see a decline in the
portfolio flows from abroad to Latin American emerging markets, ceterisparibus. This is the basic question that is being addressed in this paper.
2. DATA AND METHODOLOGY
The econometric analysis in this study is based upon panel data for a sample of
eight countries, namely, Argentina, Brazil, Chile India, Indonesia, Mexico, South Korea
and Thailand. The data for each country are quarterly from 1989QI to 1992Q2. As shown
previously in figures 3-5, the choice of countries in the sample is motivated by the
availability of data on gross portfolio flows and the fact that these countries together
account for a significant proportion of total portfolio flows to developing countries during
the sample period. Given the recent nature of the dataset, the number of observations is
not large enough to obtain robust econometric results on an individual country basis. The
use of panel data estimation techniques allow for the most efficient way of
simultaneously examining cross country relationsbips at any point in time and country-specific trends in portfolio flows over time. In addition, it addresses the problem of
inadequate data on a country-specific level and increases the degrees of fieedom in the
econometric tests that are conducted.7
Quarterly data on gross portfolio investment flows for the eight countries in this
study are obtained from the World Bank. These figures, in aggregate, are reported in the World Debt Tables (1992-93 and 1993-94). Initially, the econometric analysis is
7Chuhan, Claesscns and Maningi (1993) have used this methodology as well when evaluating the determinants of portfolio flows to
cmerging markets. For a related study see also CalVo. Liederman and Rcinhart (1993).
conducted on total portfolio flows. Subsequently, the tests are repeated for debt portfolio
flows and equity portfolio flows in order to assess whether these portfolio flows are
functionally related across regions. Given that equity portfolio flows have greater risk sharing characteristics between investor and recipient than debt portfolio investment
(through bonds, certificates of deposit and Commercial paper), knowing which flows are
related across regions is crucial in narrowing down the type of policy prescriptions that would be relevant in each case.
The first step is to estimate the cross correlation matrix for the eight countries in
the sample to get a preliminary idea about any possible relationships between portfolio flows across countries over time. Then the autocorrelation plots are examined. In
addition, Box-Pierce Q-tests and Ljung-Pierce 9-tests are subsequently conducted in
order to test for autocorrelation in each time series, for each country and each series (i.e.
total quarterly portfolio flows, dcbt portfolio flows, and quity portfolio flows,
respectively) for the sample period. This allows us to get a preliminary idea about whether the time series for an individual country are serially correlated (i.e. whether the
autocorrelation coefficient is significantly different from zero) or not. In order to construct a panel for each region (i.e. Asia and Latin America) in our sample that is
stationary, it is crucial that each individual series that makes up the panel to be stationary
itself. If this is not found to be so, the particular series has to be differenced first to
achieve stationarity before combining them to get the regional panel. Next the
Augmented Dickey-Fuller (ADF) Unit Root tests are conducted
for
each country's time series of portfolio flows. For a AR(1) process, this test consists of running a "levels"regression of the form:
Y, =c+pY(I-n)+eI
where c and p are parameters and et is a random error term et - LD (0, ca). In this case,
the ADF statistic tests the null hypothesis that Ho: p = 1. This is compared to MacKinnon
critical values at 5 percent and 10 percent levels of significance to detennine whether the
series is stationary or not. If Ho is rejected, then the series is deemed stationary.
For a "Difference Regression" on an AR(I) process the estimated model for each panel is:
A(Y) = c +yY(t-i)+et
where A is the difference operator and 'y = (p - 1). Again, et is a random error term et
IID (0, cr). In this case, the estimated Dickey-Fuller statistic tests the null hypothesis ffiat:
Ho: p =0
This estimated test statistic for each panel is then compared against the Levin and Lin
(1992) critical values, which are specific to unit root tests on panel data, at 5 and 10
percent levels of significance. The Levin-Lin critical values yield a higher power of the
test of the joint null hypothesis that all the country series that comprise the regional panel
are together I (1) as compared to the standard Dickey-Fuller or Mackinnon (1991) critical
values. Here again, if Ho is rejected, the series in the panel are together deemed stationary.
If two series Yt and xt are found to be stationary, their linear combination (i.e. a
levels regression of Yt on x) will be stationary. If, on the other hand, a series is found to
be non-stationary (e.g. it is a simple "random walk" of the form: xt = x(t -1) + ut, where Ut is a random error term with zero mean), it can be rendered stationary by differencing.
The number of times a series must be differenced to achieve stationary is called the
"order" of integration. The above random walk example is integrated of order one
(denoted by I(l)) because xt has to be differenced once to make it stationary. An I(1)
senes will display long run dominant swings.
If two series, Yt and xt are both non-stationary of order one (i.e. both I(()), then
any linear combination of the two (Yt - Pxt) will generally be I(1). However, in some
cases, the linear combination of the two variables may be stationary. In this special
circumstance, Yt and xt are said to be cointegrated. implying that there is a long-run
equilibrium relationship between Yt and xt. Hence, to determine whether portfolio flows
to Asia and Latin America are related, if one ran a regression of the levels of these flows
over time when the series were non-stationary, one would get spurious correlations unless
there was a cointegrating relationship between the two non-stationary series. In this
paper, results are obtained after testing for the existence of such spurious correlations in
the series in order to determine, in an econometrically robust manner, whether portfolio
flows across regions are causally or not related.
Following Engle and Granger (1987), if the two series are found to be
cointegrated, there exists a corresponding error-correction model which yields consistent
coefficient estimates (and corresponding esimated standard errors of these coefficients).
This is tested by applying a unit root test on the residuals of the cointegrating regression.
If there exists a unit root in the residuals, the expected value of the Dickey-Fuller
t-statistic is zero, and the series are not cointegrated. The test t-statistic is compared against
the MacKinnon critical values at 5 and 10 percent levels of significance to test for the null
hypothesis of unit root in the residuals. In the context of this study, the error-correction
model provides a way of testing the dynamic interaction of gross portfolio flows to Asia
and Latin America Specifically, the error correction equation provides evidence about
the long-run relationship and nature of the adjustment process of portfolio flows in Asia
and Latin America
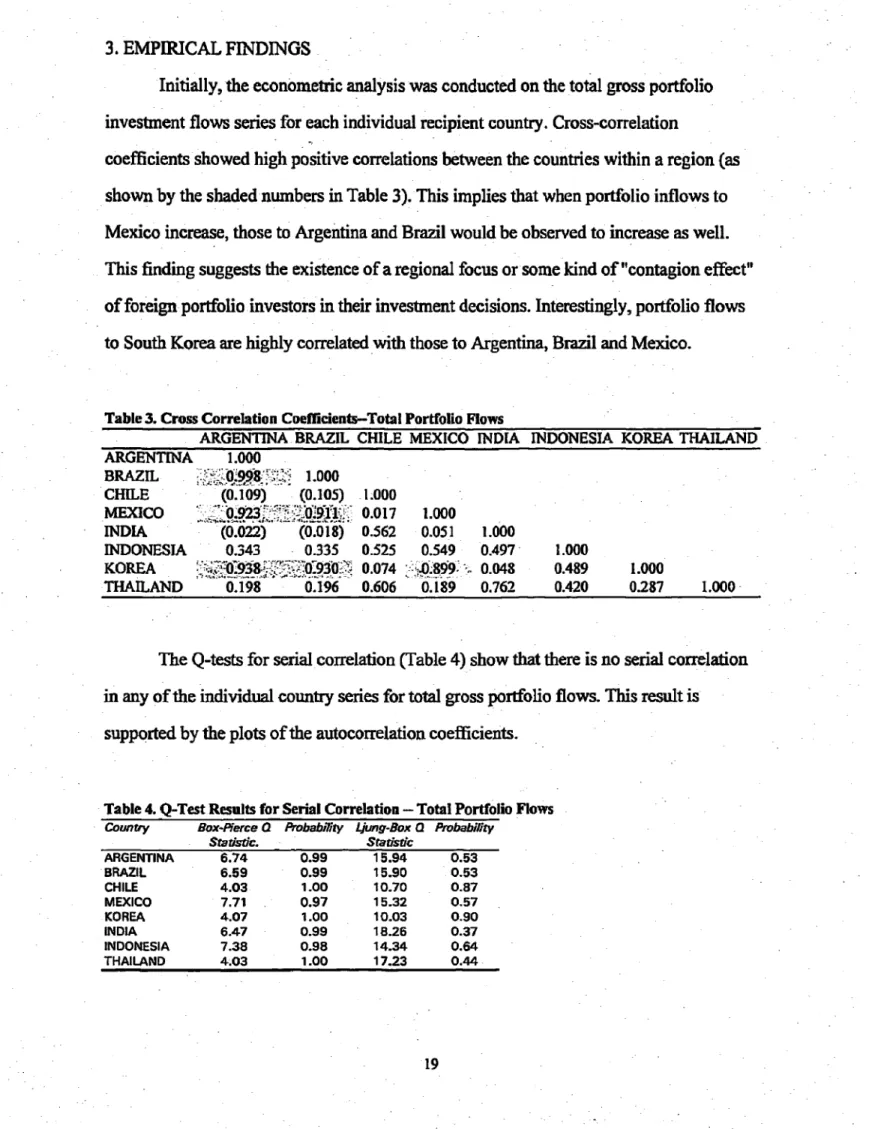
3. EMPIRICAL FINDINGS
Initially, the econometric analysis was conducted on the total gross portfolio
investnent flows series for each individual recipient country. Cross-correlation
coefficients showed high positive correlations between the countries within a region (as
shown by the shaded numbers in Table 3). This implies that when portfolio inflows to Mexico increase, those to Argentina and Brazil would be observed to increase as well.
This finding suggests the existence of a regional focus or some kind of "contagion effect"
of foreign portfolio investors in their investment decisions. Interestingly, portfolio flows
to South Korea are highly correlated with those to Argentina, Brazil and Mexico.
Table 3. Cross Correlation Coefficients-Total Portfolio Flows
ARGENTINA BRAZIL CHILE MEXICO INDIA INDONESIA KOREA THAILAND
ARGENTINA 1.000
BRAZIL ;> . '9 iY 1.000
CHILE (0.109) (0.105) 1.000
MEXICO ;<>O[ 2o2.jfi; 0.017 1.000
INDIA (0.022) (0.018) 0.562 0.051 1.000
INDONESIA 0.343 0-335 0.525 0.549 0.497 1.000
KOREA :o:&;C0930> 0.074 >g,3989..9 0.048 0.489 1.000
THAILAND 0.198 0.196 0.606 0.189 0.762 0.420 0.287 1.000
The Q-tests for serial coirelation gTable 4) show that there is no serial correlation in any of the individual country series for total gross portfolio flows. This result is
supported by the plots of the autocorrelation coefficients.
Table 4. Q-Test Results for Serial Correlation - Total Portfolio Flows
Country Box-Pierce a Probabiity Liung-Box C0 Probability
Stadstc. Statisdc ARGENTINA 6.74 0.99 15.94 0.53 BRAZIL 6.59 0.99 15.90 0.53 CHILE 4.03 1.00 10.70 0.87 MEXICO 7.71 0.97 15.32 0.57 KOREA 4.07 1.00 10.03 0.90 INDIA 6.47 0.99 18.26 0.37 INDONESIA 7.38 0.98 14.34 0.64 THAILAND 4.03 1.00 17.23 0.44 19
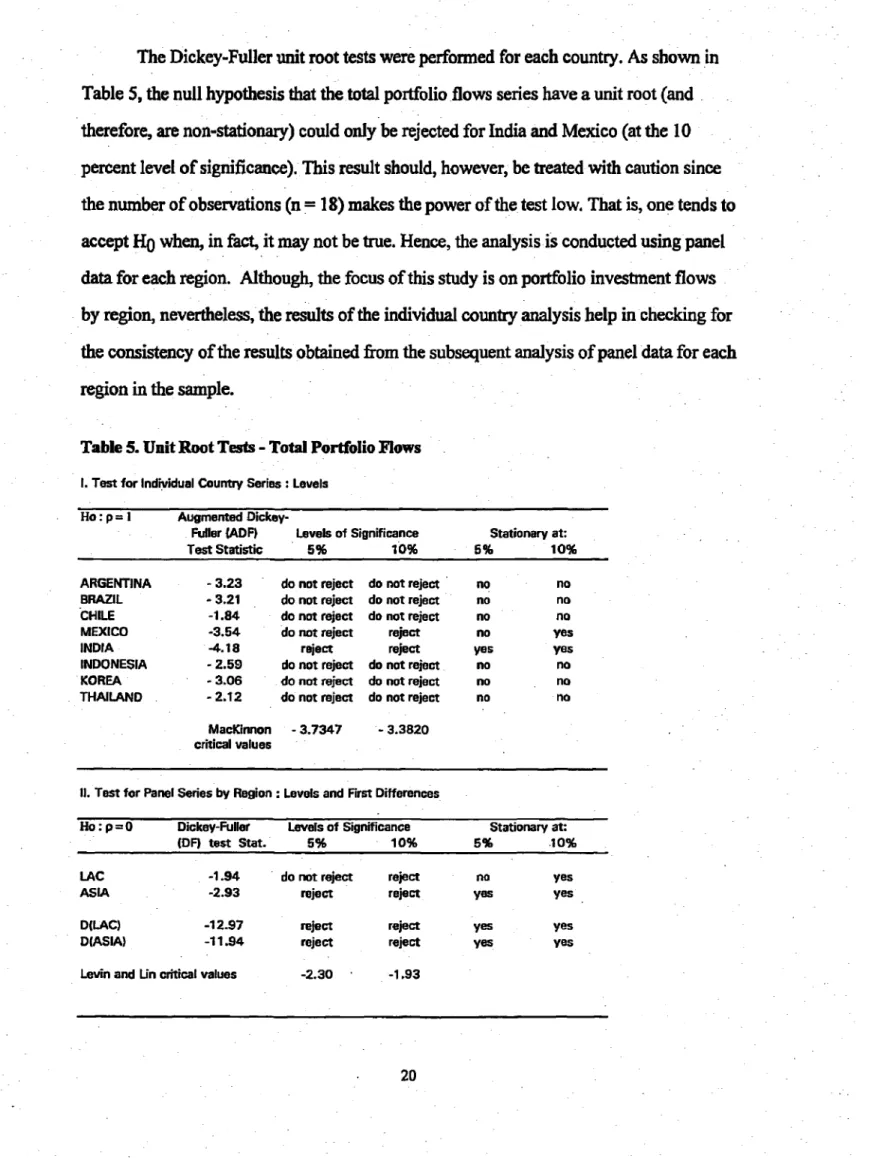
The Dickey-Fuller unit root tests were performed for each country. As shown in
Table 5, the null hypothesis that the total portfolio flows series have a unit root (and
therefore, are non-stationary) could only be rejected for India and Mexico (at the 10
percent level of significance). This result should, however, be treated with caution since the number of observations (n = I8) makes the power of the test low. That is, one tends to
accept Ho when, in fact, it may not be true. Hence, the analysis is conducted using panel
data for each region. Although, the focus of this study is on portfolio investment flows
by region, nevertheless, the results of the individual country analysis help in checking for
the consistency of the results obtained from the subsequent analysis of panel data for each
region in the sample.
Table 5. Unit Root Tests - Total Portfolio Flows
1. Test for Individual Country Series: Levels
Ho: p = I Augmented
Dickey-Fuller (ADF) Levels of Significance Stationary at: Test Statistic 5% 10% 5% 10% ARGENTINA -3.23 do not reject do not reject no no BRAZIL - 3.21 do not reject do not reject no no CHILE -1.84 do not reject do not reject no no MEXICO -3.54 do not reject reject no yes INDIA 4.18 reject reject yes yes INDONESIA - 2.59 do not reject do not reject no no KOREA - 3.06 do not reject do not reject no no THAILAND - 2.12 do not reject do not reject no no
MacKinnon - 3.7347 - 3.3820 critical values
II. Test for Panel Series by Region: Levels and First Differences
Ho: p = O Dickey-Fuller Levels of Significance Stationary at: IDF) test Stat. 5% 10% 5% 1 0%
LAC -1.94 do not reject reject no yes ASIA -2.93 reject reject yes yes D(LAC) -12-97 reject reject yes yes D(ASIA) -11.94 reject reject yes yes Levin and LUn critical values -2.30 -1.93
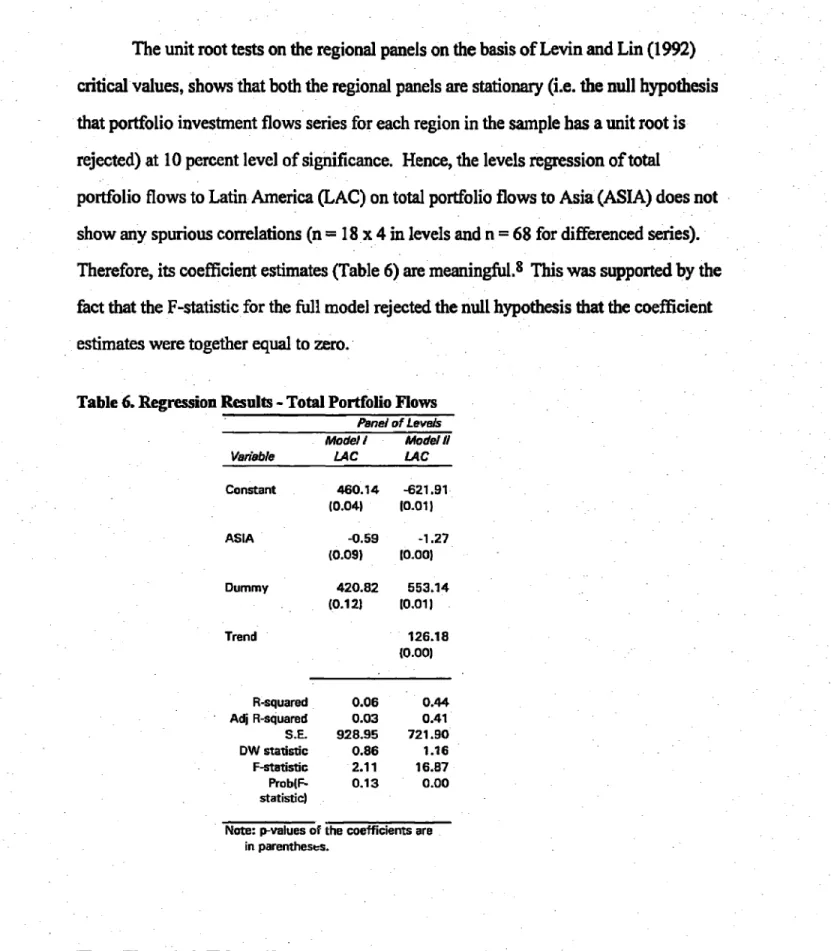
The unit root tests on the regional panels on the basis of Levin and Lin (1992)
critical values, shows that both the regional panels are stationary (i.e. the null hypothesis
that portfolio investment flows series for each region in the sample has a unit root is
rejected) at 10 percent level of significance. Hence, the levels regression of total
portfolio flows to Latin America (LAC) on total portfolio flows to Asia (ASIA) does not show any spurious correlations (n = 18 x 4 in levels and n = 68 for differenced series).
Therefore, its coefficient estimates (Table 6) are meaningful.8 This was supported by the fact that the F-statistic for the full model rejected the null hypothesis that the coefficient
estimates were together equal to zero.
Table 6. Regression Results - Total Portfolio Flows
Panel of Levels mode / model/I Varable LAC LAC
Constant 460.14 -621.91 (0.04) 10.01) ASIA -0.59 -1.27 (0.09) 10.00) Dummy 420.82 553.14 (0.123 10.01) Trend 126.18 (0.00) R-squared 0.06 0.44 Adj R-squared 0.03 0.41 S.E. 928.95 721.90 DW statistic 0.86 1.16 F-statistic 2.11 16.57 Prob(F- 0.13 0.00 statistic)
Note: p-values of the coefficients are in parentheses.
BThe panel for total portfolio flows to Latin America showed the existence of a unit root at the 5 percent level of significance (Table 3). This series was found to be integrated of order I (denoted by 1(1)) since it became stationary when diffirenced once. The unit root tests for first diffesenccs of each regional panel (D(LAC) and D(ASIA)) rejectd the presence of a unit root at bodi 5 and 10 percent levels of significance.
Levels regressions for the panel were run with (Model II) and without (Model I) a
trend variable, respectively. A constant term was included in both cases to account for
explanatory variables other than those in the model that have a fixed effect on portfolio
flows to Latin America at any point in time. Coefficient estimates in both cases show that there was a statistically significant negative relationship between portfolio flows to Latin
America and those to Asia. Model II (with the trend variable) was found to be more
statistically robust. The coefficient estimate for Model II indicates that $1 more of
portfolio investment for Asian emerging markets takes away $1.27 from that going to
Latin American emerging markets. Another factor that is specifically incorporated in thea
estimated equation is a dummy representing which part of Asia the portfolio investment
flows are going to (that is, d = 1 for South Asia and d = 0 otherwise). The coefficient of
this dummy variable (in the levels regression with trend) was found to be significant and
positive at the 10 percent level of statistical significance. Comparing the relative sizes of
the estimated coefficients, one can infer that gross total portfolio flows to Latin America
are negatively related to the flows to East Asia (Indonesia. South Korea and Thailand in
this sample) and positively with those to South Asia (i.e. for India in this sample, when
the dummy variable d=l and the coefficient estimate becomes relevant).9 The inclusion
of a trend variable is very significant in the levels regression. The trend variable
embodies other factors, not included in the model, that explain variability in portfolio
investment flows to Latin America over time.10
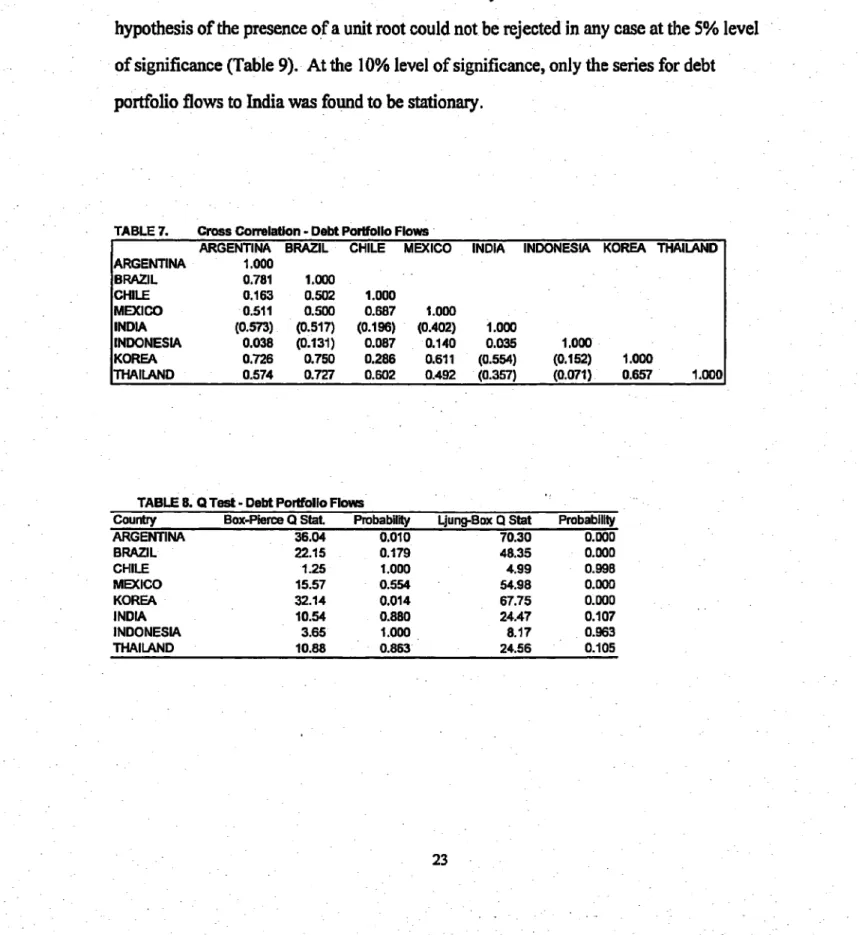
Next the analysis was furither disaggregated for debt portfolio flows.
Gross-correlation coefficients for the individual countries in the sample (Table 7) showed high
positive correlations of Brazil with Argentina, and Chile with Mexico. As in the case of
9
This result should be explained by the fact that portfolio flows from abroad have only recently been permitted into India. They still account for a very small share of the asset portfolios of foreign investors. Theretbre, at this early stage, one sees the overal incmas in portfolio investment in cmerging markes to be the dominant influence in India rather than 'portfolio switching' by forcigp investors between diffreet cmerging markets.
10 Sec Chuhan. Claessens and Mamningi (1993) for details on the possible determinants on bond and equity flovs to developing countries. For a related study, see Calvo, Lierleman and Reinhart (1993).
total portfolio
flows, the correlation
coefficients
for South Korea with Argentina,
Brazil
and Mexico were high. The Q-Test
for debt portfolio
flows for each country show that
there was serial correlation
in the cases of Argentina,
Brazil, Mexico and South Korea
(Table 8). This would partly account
for the observed
high cross-correlation
coefficients
in Table 7. Unit root test for each individual
country were conducted
and the null
hypothesis
of the presence
of a unit root could not be rejected
in any case at the 5% level
of significance
(Table 9). At the 10% level of significance,
only the series for debt
portfolio
flows to India was found to be stationary.
TABLE 7. Cross Correlation - Debt Portfolio Flows
ARGENTINA BRAZIL CHILE MEXICO INDIA INDONESIA KOREA THAILAND ARGENTINA 1.000 BRAZIL 0.781 1.000 CHILE 0.163 0.502 1.000 MEXICO 0.511 0.500 0.687 1.000 INDIA (0.573) (0.517) (0.196) (0.402) 1.000 INDONESIA 0.038 (0.131) 0.087 0.140 0.035 1.000 KOREA 0.726 0.750 0.286 0.611 (0.554) (0.152) 1.000 ITHAILAND 0.574 0.727 0.602 OA92 (0.357) (0.071) 0.657 1.000
TABLE S. Q Test - Debt PorifolIo Flows
Country Box-Pierce Q Stat Probability Ljung-Box 0 Stat Probability
ARGENTINA 36.04 0.010 70.30 0.W00 BRAZIL 22.15 0.179 48.35 0.000 CHILE 1.25 1.000 4.99 0.99B MEXICO 15.57 0.554 54.98 0.D00 KOREA 32.14 0.014 67.75 0.000 INDIA 10.54 0.880 24.47 0.107 INDONESIA 3.65 1.000 8.17 0.963 THAILAND 10.88 0.863 24.56 0.105 23
Table 1 Unit Roat Tat. - Debt Partlollo Flow.
1. Test for Indivdual Country Seris Levols Ho: p. I Augrmnted Dickey.
Fuller (ADF) Lovels of Slgnificnce Stationary at:
Tint Statistlo 5% 10% 5% 10%
ARGENTINA -1.40 do not rejct do not reject no no BRAZIL .2,37 do not roject do not reject no no CHILE near mingulur matrix
MEXICO .1.16 do not reject do not reject no no
INDIA - .3.73 do not reject reject no yes
INDONESIA .241 do not reject do not reject no no KOREA 2.30 do not rejct do not reject no no THAILAND -2.19 do not reject do not reject no no
MacKlnnon crItical values -3.7511 .3.3228
11. Test for Panel Series by Region Levels end First DIffrences
Ho: p e o Dickey-Fuller
(DF) Tast Levels of Significance Stationary at:
StatItic 5% 10% 5% 10%
LAC -0.48 do not reject do not reject no no
ASLA -2.67 reject reject yes yes
D(LAC) -11.11 reject reect yes yes
D(ASI) -10.91 reject reject yes yes
Levin and Un critical values -2.30 -1.93
When Unit root tests were conducted for the panels for Latin America and Asia,
the forner was found to contain a unit root. This is consistent with the results obtained
using the Ljung-B3ox Q tests for the individual countries in the LAC panel. That is, the
series for Argentina, Brazil and Mexico were found to contain serially correlated errors.
In addition they were found to be non-stationary.1 The panel of first difference of both
LAC and Asia were found to be stationary on the basis of the Levin and Lin (1992)
critical values.
1 Once again, the individual county results should bc treated with caution because the small number of observations (n-8) imply low power of tesis.
Table 10 shows the results of the difference
regressions
for debt portfolio flows
panels of Latin America on Asia with a constant
term, the dummy for South Asia (i.e.,
d =1 for South Asia and 0 otherwise),
with and without a trend variable. When the first
difference
of debt portfolio flows to LAC (a stationary
series) was regressed
on the 11d
of debt portfolio flows to Asia (also a stationary
series), a constant
term, South Asia
dummy and the trend variable, the negative
relationship
between
portfolio flows to Latin
America and Asia continues
to be statistically
significant
at the 10 percent level.
However,
the F-test for these regressions
fail to reject the null hypothesis
that the
coefficients
are together equal to zero.
Table 10. RegressIon Results - Debt Portfolio Flows
Vadable D(LAC) D(LAC) D(LAC) D(LAC
Constant 26.05 -150.25 12.63 -101.64 (0.82) (0.33) (0.90) (0-49) ASIA -0.21 -0.34 (0.26) (0.09) Dummy 132.38 157.36 110.52 110.73 (0.32) (0.24) (0.38) (0.38) Trend 21.39 13.44 (0.00) (0.10) (0.25) D(ASIA) -0.54 -0.55 (0.03) (0.03) R-squared 0.03 0.07 0.08 0.10 Adi R-squared 0.00 0.03 0.05 0.06 S.E. 442.42 436.08 429.80 428.62 DW statslic 2.51 2.56 2.52 2.58 F- 0.91 1.55 2.75 2.31 statistic Prob(F-statisfic) OAl 0.21 0.07 0.09
Note: p-values are in paentheses.
The regressions of the first difference of Latin America on the first difference of
debt portfolio flows to Asia (with and without the trend variable) are more significant on
the basis of their F-test. These results are shown in the last two columns of Table 10. In
both these cases the coefficient for D(Asia) was found to be negative and statistically significant at the 5% level. This implies that, even in the case of debt portfolio flows, the
change in these flows to LAC are inversely related to changes in debt portfolio flow to
Asia. Specially, if debt portfolio flows to Asia increase between two quarters of any year,
those to Latin American emerging markets will be expected to decrease. This further
supports the "portfolio adjustment" hypothesis in the case of emerging markets. The
presence of the trend variable or the South Asia dummy did not lead to any improvement
in this result.
Since the panel series of kv&1 of debt portfolio flows to Latin America w-as found to be non-stationary, i.e., with the presence of a unit root, the additional step of testing for
cointegration between Latin America and Asia levels of debt portfolio flows was
undertaken. The residuals from the level regression was tested for the presence of a unit
root. The Dickey-Fuller statistic (Table I 1) was computed and compared to the
Mackitmon critical values at 5 and 10% level of significance. The null hypothesis for the
presence of a unit root (Ho: p = 0 for the residuals regression) could not be rejected
implying that the error terms were non-stationary. That is, the integration of order 1, I(l),
dominates integration of order zero, I(0) in the series of residuals. This showed that the levels of debt portfolio flows for LAC were not cointegrated with the levels of flows to
Asian emerging markets. The levels regression would yield spurious results. Hence, one
should base conclusions on the basis of the difference regressions (that were found to be
stationary).
TABLE 11. Cointegration Vectors: Levels Regression
Debt Portfolio Flows
Variable LAC LAC Constant 210.18 -548.08 (0.191 10.00) ASIA -0.40 -0.98 (0.16) (0.00) Dummy 429.58 483.10 (0.03) (0.001 Trend 91.73 (0.00) DF statistic -0.49 -2.08 R-squared 0.08 0.44 AdM R-squared 0.05 0.42 S.E. 676.86 531.56 DW statistic 0.51 0.79 F-statistic 2.84 16.87 Prob(F-statistic) 0.07 0.00 Signif. level MacKinnon 5% -3.48 Critical 10% -3.17 values:
Afore: p-values for each coeffiaent are in paren7theses.
Similar results were obtained for the regional linkages between equity portfolio
flows. However, although the inverse relationship between equity flows to Latin America and Asia was observed, it was not found to be statistically significant below a
17% level of significance. The trend variable in the levels regression on equity portfolio
flows was significant at the 10 percent level, implying that other factors that are specific to the countries in question within the region over time are more important in determining
equity flows to that region.
The pace of liberalization of the domestic equity markets is one such factor
influencing the direction of equity portfolio flows. An important policy. implication of
this is tiat some potential policy measures may be warranted if the autiorities in a
parficular developing country wish to enhance portfolio inflows (especially those with
risk sharing characteristics such as equity portfolio investment).
4. CONCLUSIONS AND POLICY IMPLICATIONS
The conclusions in this paper are based on an econometric analysis of new
quarterly World Bank data on gross portfolio investment flows for a sample of eight
emerging markets forte period 1989QI-1993Q2. Four countries in each geographical region (namely, India, Indonesia, South Korea and Thailand in Asia, and Argentina,
Brazil, Chile and Mexico in Latin America) were examined, all of which have been
experiencing large portfolio investnent inflows in recent years.
According to the findings of this study, the perceived competition between
developing countries for portfolio investments from abroad is, indeed, real and should not
be considered to be merely a part of the general increase of portfolio allocations to
emerging markets as a group from investors in industrialized countries. In addition, gross
total portfolio flows to Latin America are found to be more significantly related to those
going to East Asia (Indonesia, South Korea and Thailand in this sample) than those to
South Asia (i.e. India in this sample). Hence, developing country policy makers must
continue to provide the right signals to international capital markets, in tenms of economic and domestic institutional reforms that attract for portfolio investment from
abroad, if they expect to compete successfully with other developing countries for the pool of private voluntary capital that is "allocated" by portfolio managers to the emerging
markets group. Over the long term, this will also ensure the susinability of the portfolio
flows into those "well performing" countries with improved creditwortiiness; they will benefit from increased interest of intemational institutional investors in allocating a
(even, though, marginal)
of their large investible
portfolio
to these markets. In addition,
the results highlight
the need to continue
the increasing
pace of reforms in any given
emerging stock market in order to maintain
the sustainability
of portfolio
flows to that
developing
country over the next few years.
BIBLIOGRAPHY
Ahmed, Masood and Sudarshan Gooptu (1993), "Portfolio Investment Flows to
Developing Countries," Finance and Development, March 1993, Vol. 30, No. 1,
pp. 9-12
Arshanapalli, B. and Jehn Doukas (1 993), "International- stock market linkages: Evidence
from the pre- and post-October 1987 period," Journal of
Banking
and Finance,17, pp. 193-208.
-Becker, K.G., J.E. Finnerty and M. Gupta (1990), "The Intertemporal Relation Between
the U.S. and the Japanese Stock Markets," Journal of Finance, 45, December
1990,pp. 1297-1306.
Calvo, Guillermo A., Leonardo Leidennan and Carnen M. Reinhart (1993), "Capital
Inflows and Real Exchange Rate Appreciation in Latin America," IMP Staff
Papars, Vol. 40, No. 1, March 1993.
Chuhan, Punam (1994), "Are Institutional Investors an Important Source of Portfolio
Investment in Emerging Markets?" World Bank Policy Research Working Paper
No. 1243, January 1994.
Chuhan, Punam, Stijn Claessens and Nlandu Mamingi (1993), "Equity and Bond
Portfolio Flows to Latin America and Asia: The Role of Extemal and Domestic
Factors," World Bank Policy Research Working Paper No. WPS 1160, July 1993.
Claessens, Stijn (1993), "Equity Portfolio Investment in Developing Countries: A
Literature Survey," World Bank Policy Research Working Paper No. WPS 1089,
February 1993.
Engle, R.F. and C.W.J. Granger (1987), "Co-integration and Error Correction:
Representation, Estimation and Testing," Econometrica, 55, pp. 251-76.
Eun, Cheol S. and S. Shim, "International Transmission of Stock Market Movements,"
Journal of Financial and Quantitative Analysis, 24, June 1989, pp. 241-256.
Gooptu, Sudarshan (1993), "Portfolio Investment in Developing Countries," World Bank Policy Research Working Paper No. 1117, March 1993.
Grubel, H. and K. Fadner (1971), "The Interdependence of International Equity Markets,:
Journal of Finance, 26, pp. 89-94.
Hamao, Y., R.W. Masulis and V. Ng (1990), "Correlation in Price Changes and Volatility
Across International Stock Markets," Review of Finiancial Studies, 3, Summer
1990, pp. 281-308.
Hilliard, J.E. (1979), "The Relationship Between Equity Indices on World Exchanges,"
Journal of Finance, 34, March 1979, pp. 103-114.
Howell, Michael and Angela Cozzini (I993), "International Equity Flows," Baring
Securities, London, U.K.
Lau, Sie T. and Thomas H. McInish (1993), "Comovements of International Equity
Returns: A Comparision of the Pre- and Post-October 19, 1987, Periods," Global
Finance Journal, 4(1), pp. 1-19.
Levin, Andrew and Chien-Fu Lin (1992), "Unit Root Tests in Panel Data: Asymptotic
and Finite-Sample Properties," University of California, San Diego Discussion Paper No. 92-23, May 1992.
Levy, H. and MK Sarnat (1970), "Intemational Diversification of Investment Portfolios,"
American Economic Review, 60, September 1970, pp. 668675.
MacKinnon, J.G. (1991), "Critical values for Cointegration Tests," in R.F. Engle and
C.W.J.
Granger (eds.), Long-run economic relationships: Readings inCointegration, Oxford: Oxford University Press.
Meric, I. and G. Meric (1989), "Potential Gains from Intemational Portfolio
Diversification and Inter-temporal Stability and Seasonality in International Stock
Market Relationships," Journal of Banking and Finance, 13, pp. 627-M40.
Park, Jinwoo and All M. Fatemi (1993), "The Linkages Between the Equity Markets of
Pacific-Basin Countries and Those of the U.S., U.K., and Japan: A Vector
.Autoregression Analysis," Global Finance Journal, 4(1), pp. 49-64.
Pindyck, Robert S. and Daniel L. Rubinfeld (I 991), "Econometric Models and Economic
Forecasts," 3rd. edition, New York: McGraw Hill, Inc., pp. 459-68.
Tesar L. and I. Werner (1993), "U.S. Equity Investnent in Emerging Stock Markets," in
Stijn Claessens and Sudarshan Gooptu (eds.), Portfolio Investnent in Developing
Countries, World Bank Discussion Paper No. 228, December 1993, Washington
D.C., World Bank. pp. 200-220.
Tsetsekos, George P. (1993), "Emerging Capital Markets: Results from Cointegration
Tests," Drexel University, College of Business and Administration Faculty
Working Paper Series, No. WP 5 1-93, October 1993.
Wong, Jason K (1993), "Testing and Esfimating Cointegrating Relationships: A Survey,"
Reserve Bank of New Zealand Discussion Paper No. G93/1, January 1993.
World Bank (1993a), "World Debt Tables, 1993-94", Intemational Economics
Department, Washington, D.C.:World Bank.
World
Bank(1993b),
"Quarterly Review of Financial Flows to Developing Countries," Debt and Interational Finance Division, Washington, D.C.:World Bank, variousissues.
World Bank (1993c), "Global Economic Prospects and the Developing Economies, 1993"
Intemational Economics Department, Washington, D.C.: World Bank
Policy Research Working Paper Series
Contact
Title Author Date for paper
WPS1344 Which Foreign investors Worry About Eric Bond August1994 A. Estache Foreign Exchange Risk In South Antonio Estache 81442 Asia and Why?
WPS1345 The Decentralizalion of Public Jacques Cremer August 1994 A. Estache Services: Lessons lrom the Theory Antonio Estache 81442
of the Firm Paul Seabright
WPS1346 Unidng Compelition and Trade Bemard M. Hoekrinan August 1994 F. Hatab, Policies in Central and Eastem Petros C. Mavroidis 35835 European Countries
WPS1347 Antitrust-Based Remedies and Bernard M. Hoekman August 1994 F. Hatab Dumping in International Trade Petros C. Mavroidis 35835 WPS1348 Quality Change and Other Influences Robert E. Lipsey August 1994 J. Ngaine
on Measures of Export Prices of 37947
Manufactured Goods
WPS1349 The New Regionalism and the Threat Andrew Hughes Hallett August 1994 A. Kgm
of Protectionism Carios A. Priro Braga 33715
WPS1350 Economic Parameters of Joachim von Amsberg August 1994 E. Schaper
Deforestation 33457
WPS1351 NAFTA's Implications for East Asian Carlos A. Primo Braga August 1994 A. Kim
Exports Raed Safadi 33715
Alexander Yeats
WPS1352 Trade and Growth in Ecuador Jesko Hentschel August 1994 D. Jenkins
A Partial Equilibrium View 37890
WPS1353 Nontariff Measures and Developing Patrick Low August 1994 J. Jacobson Countries: Has the Uruguay Round Alexander Yeats 33710 Leveled the Playing Field?
WPS1354 The Effects of Fiscal Consolidaion Warwick J. McKlbbin September 1994 J. Queen
in the OECD 33740
WPS1355 Export Incentives: The Impact of Sanjay Kathuria September 1994 M. Haddad
Recent Policy Changes 32160
WPS1356 Central Bank Independence: Ignacio Mas September1994 PRDC
A Critical View 334B2
WPS137 Does Participation Improve Project Jonathan Isham September 1994 M. Geller Performance? Establishing Causality Deepa Narayan 31393 with Subjecfive Data Lant Pritchett
Pollcy Research Working Paper Series
Contact
Tide Author Date for paper
WPS135B8 Pattems of Behavior in Andrw Metldck September 1994 A. Marafion Blodiversity Preservation Martin L Weitzman 39074 WPS13S9 When Method Maners: Toward a Martin Ravalilon September 1994 P. Cook
Resolutlon of the Debate about Blnayak Sen 33902 Bangladesh's Poverty Measures
WPS1360 Are Portfollo FRows to Emerging Sudarshan Gooptu September 1994 R. Vo
Markets Complementary or 31047