Evaluating Software Support for Video Data Capture and Analysis in Collaborative
Design Studies
Linda Candy Zafer Bilda Mary Lou Maher
John S. Gero
Key Centre of Design Computing and Cognition University of Sydney
2006, NSW
Email: [email protected]
Abstract
In order to understand the implications of introducing new digital tools into design practice, research into how designers work collaboratively using both traditional and digital media is being undertaken. For that purpose it is necessary to gather large quantities of empirical data and this poses problems as to how to manage and analyse that data effectively. This paper describes the evaluation of a software system for capturing and analysing video data in the context of collaborative design studies. These studies will generate large amounts of data and support for its management and analysis is vital to the successful completion of the work. In order to find a match to our specific requirements, we conducted a survey from which the software application, INTERACT was identified. A study of its use and suitability was carried out in conditions as near as possible to the intended research. We found that INTERACT met our requirements and provided significant efficiency gains for the analysis of the data.
INTRODUCTION
This paper arises from research conducted by industry and academic partners into the characteristics of collaborative design. The investigations focus on the collaboration processes adopted by designers working on the same project but in different places. A distinctive aspect of the research is that it is being undertaken in a live commercial environment where the participant designers carry out real projects alongside their colleagues and in familiar locations.
The paper begins with a brief account of the research context and then goes on to describe the industrial scenario including how the data is collected whilst the designers are working normally. This is followed by a discussion of the reasons why software support is needed to support the capture, management and analysis of collaborative design process data. Reviewing available software alternatives, we present the main features of the software application that were applied in the pilot study described. Finally, the paper discusses strengths of the software and how it met the requirements of the research.
STUDYING COLLABORATIVE DESIGN
Recent developments in networked 3D virtual worlds and the proliferation of high bandwidth communications technology have the potential to transform the nature of collaboration in professional design. There have been numerous studies of collaboration in Europe and the USA and, whilst these initiatives have undoubtedly led to important advances in the enabling technologies required to support global economic practices, there has been insufficient attention paid to the way people work in their natural working environments. This is not a new problem but has persisted whenever new technologies are proposed as solutions to market driven changes. It is this gap in empirical evidence that the Cooperative Research Centre on Construction Innovation (CRC) project, “Team Collaboration in High Bandwidth Virtual Environments” addresses.
The research design was developed by the University of Sydney with the co-operation of industry partners, Woods Bagot Pty Ltd and Ove Arup Pty Ltd, and the CSIRO, Melbourne. The studies will provide empirical results that will lead to more effective use of virtual environments in professional design and construction processes. The experience and knowledge about collaboration in a high bandwidth environment is particularly important for design teams that are not co-located, as is generally the case. The aim is to provide empirical evidence that will support organizations in the drive towards more effective use of new technological resources. The research findings will contribute to a growing corpus of knowledge about the emerging area of collaborative
virtual environments for design. In order to understand the practical implications of introducing new digital tools on working practices, research into how designers work collaboratively using both traditional and digital media is being undertaken. The following section describes the approach to gathering and analysing data in the context of studies of design practice as it takes place in an international architectural design company.
Industrial Scenario
The project under consideration involves undertaking a series of research studies into how designers work collaboratively using both traditional and digital media. The research takes place in a multi-national architectural design firm where collaboration between designers typically occurs in both co-located and remote geographical locations. The work is being undertaken in the company design offices in two remote locations and focuses on collaboration in design within the context of a design competition. While preparing a submission to a design competition, the designers have to develop and document a design concept as well as produce a set of drawings and perspectives in a very short time frame as the competition design process is typically confined to a two-week period. In the studies, we will focus primarily on collaboration between two designers; one located in the Sydney office and one located in the Melbourne office. Other participants in the process will be included in the data as they appear naturally in the live situation.
The research approach is case study based and will involve detailed studies of a small number of people working in their normal environment. There are three separate phases to this study in which the designers and the design offices are the same, but the collaborative technologies change. The change in collaborative technologies is incremental, moving from the technology already in use in a specific design office to a high bandwidth virtual environment. The data collected in these phases will be coded and analysed, and then compared to determine the impact of the change in collaborative technology. The three phases are:
1. A collaborative design process in which designers work with their current design and communication tools.
2. A collaborative design process in which we introduce a shared drawing system with synchronous voice and video in addition to the currently used design and communication tools.
3. A collaborative design process in which we introduce a 3D virtual system that is used in addition to the current design and communication tools.
Data Collection Method
The methods for collecting and analysing data are based on established approaches that have been developed by the authors in previous projects (Britton et al, 1998, Candy and Harris, 2001, Gero and McNeill, 1998; Gabriel and Maher, 2002). The data collection method is to monitor and record data using multiple video cameras. The data captured enables precise inspection of the events and actions by rewinding and forwarding the video thus helping the researcher to fill in the gaps in direct observation records and to focus on specific aspects of the process. Our aim is to record the designers’ activities and verbal exchanges for the complete length of time the design project takes place. An assessment of the capability of the audio video equipment and of the locations into which it was to be placed was carried out. The requirements of the system include:
• Two or three cameras to record activity from different viewpoints. One camera (which we call overhead camera) focuses on the design drawings and materials in use in the baseline study. Second and third cameras view the design workspace from two different angles, Figure 1. In the second and third phases of the study, instead of an overhead camera, input will be directly the computer screen.
• A mountable and mobile system in order to be able to carry the system from one place to another and to set it up easily.
• Minimum interference with the designing environment
• Sufficient storage space for large volumes of audio/video records from three different channels. Since the amount of audio/video data is huge, storage of the data on a hard disk is an advantage in our system that provides us with precise time-stamping and quick/easy access to the scenes at specific time intervals. • Tie-clasp wireless microphones to minimize impact on designers and to obtain a good quality sound
recording for later transcriptions of the data.
• Conversion of the video recordings into digital video file format for analysis of the data as well as for saving space in archiving.
The placement of the cameras is an important issue, since all participant movement, verbalizations, gestures and the drawing actions and outcomes must be recorded. Cameras 2 and 3 in both study settings capture the gestures, and general actions such as walking, looking at, moving to the side, etc. while Camera 1 has to capture the drawing process in detail, Figure 1. Camera 1 is mounted on the ceiling, while the other two cameras stand on
tripods. The study setting in the work environment involves one camera directed at the pin-up wall where designers hang the related visual materials, one camera mounted on the ceiling capturing the drawing process on the table and another camera directed onto the designers in order to capture their interaction with the environment or with another colleague as well as the gestures involved. In the following phases, the designing actions will be captured via the digital tools using video streaming. As additional computer tools are introduced into the designing process, the data set will be augmented accordingly to include for example, text chat, video conferencing and design modelling data.
Figure 1. Camera Positions
The recording process will take place for several hours per day over a number of days, which means that the data collection will yield many hours of design protocols. Additionally the protocols have to be transcribed and analysed using the video recordings. The important issues about this process are:
• Ease of locating the precise times (time stamp) of spoken comments, drawing marks etc.
• Ease of capturing verbalizations and synchronously associating them with drawings on paper/ images on the video-tape.
• Ease of reaching specific instants/ actions /speech in the recorded long design session.
• Support for analysis of multi-modal conversations, i.e. two (or more) designers drawing, two (or more) designers talking.
• It is desirable to observe proceedings of both drawings and speech in the same digital media. Analysing Design Protocols
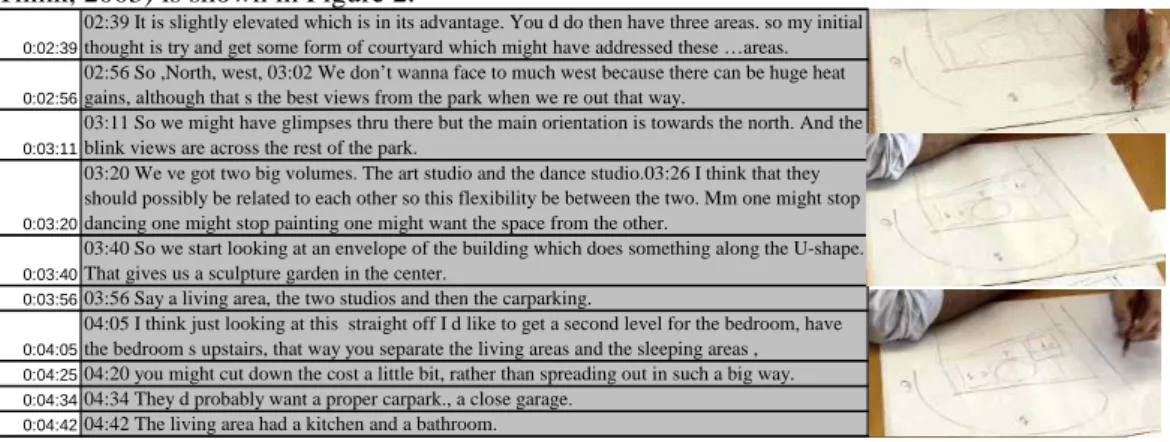
Analysing the protocols in design research involves investigation of video recordings together with transcribed audio files. The transcribed verbalizations are usually time stamped and segmented manually, which is a lengthy process. Additionally, video recordings require particular care in order to capture a complete picture of the actual drawing process. For the purpose of analysis, scene shots have to be captured from the video each time the researcher wants to refer to the related verbalization. In that way, the design protocol document has the associating image/ drawing with the verbalization. The traditional way of handling these two types of data has been in Excel worksheets, where the analyst captures a picture of the actual drawing process from the video recording and attaches it to the related segmented transcription located in cells. While two columns are used for the time start and end of the segment, a third column is used for transcription, and next to them are the related images. An example of a typical way of handling design protocol data using an excel worksheet (How Designers Think, 2003) is shown in Figure 2.
Figure 2. Protocol data in an Excel worksheet
0:02:39
02:39 It is slightly elevated which is in its advantage. You d do then have three areas. so my initial thought is try and get some form of courtyard which might have addressed these …areas.
0:02:56
02:56 So ,North, west, 03:02 We don’t wanna face to much west because there can be huge heat gains, although that s the best views from the park when we re out that way.
0:03:11
03:11 So we might have glimpses thru there but the main orientation is towards the north. And the blink views are across the rest of the park.
0:03:20
03:20 We ve got two big volumes. The art studio and the dance studio.03:26 I think that they should possibly be related to each other so this flexibility be between the two. Mm one might stop dancing one might stop painting one might want the space from the other.
0:03:40
03:40 So we start looking at an envelope of the building which does something along the U-shape. That gives us a sculpture garden in the center.
0:03:5603:56 Say a living area, the two studios and then the carparking.
0:04:05
04:05 I think just looking at this straight off I d like to get a second level for the bedroom, have the bedroom s upstairs, that way you separate the living areas and the sleeping areas , 0:04:2504:20 you might cut down the cost a little bit, rather than spreading out in such a big way. 0:04:3404:34 They d probably want a proper carpark., a close garage.
This process is time-consuming and inflexible for the following reasons.
The analyst has to insert time codes manually in each cell. When the analyst wants to change the segmentation, s/he has to go back and capture the time stamp and insert the new one .
Synchronization of the video stream and segmented transcripts is needed when the analyst wants to code the drawing actions. Since the drawing strokes occur frequently in each frame, capturing arbitrary images is not sufficient. The analyst has to watch the actions on the video/media window and code the actions next to the transcriptions. This procedure is labour and attention intensive for the analyst/coder. In the case of a need for re-coding, going back to a previous segment and searching for the related image or video stream is also time consuming.
This process has been used for analysing the design session of an individual. When there is more than one designer and collaboration is taking place, there are likely to be overlapping actions or verbal exchanges which should be transferred from one segment to another. Thus, the traditional ways of handling data are not convenient for coding multiple actions of a design team in a collaborative session.
Given the well-known problem associated with collating, indexing and structuring large amounts of qualitative data, software applications are an obvious source of support to the analysis process. However, not all applications provide sufficient support to all requirements of a given set of research objectives and data. In order, to find a match to the specific requirements of the studies under consideration here, a survey of available software applications was carried out. The outcomes are described below.
SOFTWARE SUPPORT FOR DATA CAPTURE AND ANALYSIS
For the research investigations described above, a software application was needed for the following requirements:
Data Transferring Requirements
• Handling heterogenous data. Heterogeneity refers to synchronization of recorded audio and video data. • Compatibility with movie compression formats for reasonable file sizes. Since data capture involves
long hours of recording, this becomes an important requirement. Software should operate effectively with long recorded sessions which require large file sizes.
Data analysis requirements
• Capturing activities and verbalizations with precise timing.
• Streaming more than one camera channel at one time, to observe multiple actions and tasks in one event. • Interactive update of the coded data with the updates in the coding scheme would be an advantage since
coding is an exploratory process and the scheme could be subject to changes.
• Management of video channel(s), utilized code list/scheme, and the coding input for each event with time codes in one interface.
• Representation of the coded actions over the timeline of the observed session is an advantage for effective presentation of the data. Estimating duration for each action should be a default for detailed analysis and presentation purposes.
• When the analyst needs to access a scene at a specific time, the software should be able to locate that instant, in addition to the transcribed verbalization attached to it.
• Being able to access the coding several times with the same time stamp in order to re-code, modify or compare coding.
• When a second analyst /coder is in charge s/he should later be able to handle and understand the data and coding process through the interface of the software.
Software packages exist for qualitative analysis and observational data analysis. These packages enable the researcher to code, retrieve, build theories and conduct analysis of the data. Most packages are able to work with text, graphics, audio and video sources. The aim is primarily to support the researcher in the very difficult task of reducing complexity and marshalling verifiable results from large sets of heterogeneous data.
Software Survey
Software applications for supporting qualitative data analysis that have been investigated include:
NUD*IST/ NVivo where data are stored as sets of text documents, which can include field notes, interview transcripts, communications between individuals (especially email communications), and any other form
of textual data. It is a text based analysis tool, which does not provide us with the synchronous analysis of audio video data (www.qsr.com.au).
ATLAS.ti (by Scolari) is an application for the visual qualitative analysis of large bodies of textual, graphical and audio video data. The goal is to uncover complex phenomena hidden in the qualitative data. It provides rapid search, retrieval and browsing of all data segments and notes relevant to an idea (http://www.atlasti.de/).
Observer (by Noldus) is for the collection, analysis, presentation and management of observational data. It can be used to record activities, postures, movements, positions, facial expressions, social interactions or any other aspect of human or animal behaviour. Observer could be ideal for behavioural research while analysis of textual data or handling transcripts is not central to its data capture and analysis methods. The advantage of this software is that time codes are directly acquired from video tape or media file, which allows accurate event timing (http://www.noldus.com/products/ ).
“HyperRESEARCH" which enables the coding of any type of source including text, audio, video and image. The software is powerful in analysing text based records and transcripts. However the multimedia capabilities of the software are not its central utility. The video recordings or captured images could be attached to text records to support heterogenous analysis (http://www.researchware.com/).
INTERACT can handle more than one video file to be coded in a single code, which would be an advantage to the particular project under consideration as three cameras will be recording simultaneously and therefore, it is advantageous to be able to see three files on one interface and to be able to code them synchronously (http://www.mangold.de/english/intlatest.htm).
The first four of the above applications, do not handle more than one stream of audio/video synchronously. However the digital recording equipment in use for the current project records three different video channels because it is important to focus on the details of a scene since talking, looking, drawing, and making gestures are involved as part of a design activity. Thus the selected software should be able to manage more than one video stream as well as the time codes of the streams in one coding list. Reviewing these software alternatives, and taking the coding process into account, we decided that the multiple tasks such as managing the codes, accessing the multimedia stream, and viewing the coding scheme as well as presentation and management of the data should preferably be done in one interface. Of the applications listed above, only the last met this requirement. INTERACT
INTERACT was identified as meeting the requirements of the design studies for the following reasons.
It does not limit the coding process with predefined/ behavioural codes or categories which makes it compatible with variations in individual methods. This means for each individual’s observations a new code list file can be created and archived. Additionally multiple users can work with one observation result list at any time, to change any pre recorded data, to add new events or to fill new behavioural codes in existing events. Thus it allows different coders to work on the same data. When this is the case, comparing different codings is essential in order to handle the congruence in data analysis. In the protocol analysis literature, this is referred to as ‘inter-coder reliability’. INTERACT preforms a mathematical estimation method using a standard numerical value called Cohen’s Kappa (international standard for inter-rater reliability) to compare the results of different codings by two analysts. The value of this standard could change across the coding of different categories, informing the agreement levels and thus reliabilities of these categories or codes.
The key advantages that INTERACT provides us with for handling data are the following (INTERACT User Guide 2004):
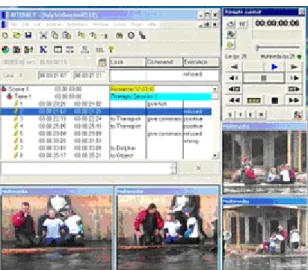
The software enables multiple video streams to be observed simultaneously in a single coding session and enables several videos recorded from different camera views of the same scene to be analysed, Figure 3. It is possible to apply different coding schemes and categories to one session as long as the segmentation is
maintained (i.e. when the event intervals are identical for either coding scheme). The 'lexical coding' option assigns an unlimited number of different behavioural codes to keys on the computers keyboard during one coding session.
INTERACT allows flexible segmentation of the filmed data. Segmentation could be done based on events; “something happens at a time or in a time interval”, on time sampling; “what happens in a pre defined time interval, say every five minutes” or done by entering the start time and end time for a segment. The software makes the segmentation easier because an event can be defined with pressing a key at the start and the end time of the observed behaviour. This function also makes it possible to record events which overlap in time simultaneously (e.g. someone talking, meanwhile someone coming into the room). Assigning the codes is also made easy by just pressing a letter on the keyboard. Definition of the codes
appear in a different window where codes are previously named and explained and assigned to letter keys on the keyboard. Thus, it is also easy to organize behavioural codes in categories and coding schemes.
Figure 3. The INTERACT Interface with multiple video streams in one coding session
The interface has a text area related to each segment, which can be used to paste the associated transcription, or write any free text, behavioural code or annotation any time. It is possible to enter large amount of text and associate to any event or to assign any multimedia file (video, picture) for further description of that event.
INTERACT has search operations to find time codes, behavioural codes or text in annotations and jump directly to the associated video scene. That becomes a useful function when there is a long recording sessions and complex actions happen together. The search option allows the analyst to go back and re-code the event as well as edit and correct time re-codes of the recorded events.
INTERACT uses standard Windows multimedia video and audio files and it can remote control various video equipment or cam coders. The coded data can be imported into applications like Excel or Word.
PILOT STUDY
A pilot study of phase 1 was conducted to explore and evaluate the features of INTERACT in order to establish whether it met the requirements of the planned collaborative design studies. The study was undertaken in as near conditions to the future studies as was possible and applied the coding scheme developed specifically for the studies.
We recorded a collaborative design session between two architects reviewing and re-working a design according to further client requirements and emerging technical issues. The design task involved discussing how to make the changes and modifications to a previous version. The collaboration medium was face to face in which two architects took turns drawing and communicated verbally with each other. Consequently, the tools utilized were limited to tracing paper and pen. There was a range of representations involved in the design activity such as layout and elevation plots, computer generated coloured print outs of 3D image of the building, and sketches/drawings on tracing papers.
The architects had two sessions of design review, the first session lasted for 45 minutes, after which they took a lunch break. The second session lasted for an hour and five minutes, in which they finished the review and solved the target problems. The sessions were recorded with three camera views and audio recordings on the hard-disk of the digital video recorder system in use. The verbalizations were not transcribed for this preliminary evaluation study and so the coding was done by listening to the conversations several times. When the actual case study takes place all audio recordings of designer conversations will be transcribed and the transcriptions will be attached to each segment in the video coding process.
Coding process
A single filmed session is called a Scene in INTERACT. There are “Takes” in a Scene which we refer to as design episodes. “Events” are smaller activity definitions that building up the “Takes”. Thus, the smallest segmentation definition is an event. The ‘event’ is an optimal definition in behavioural research because happenings are arbitrary and because actions change in a relatively small and unpredictable time intervals. Typically, in collaborative design, actions and intentions change arbitrarily because architects draw and communicate interactively. Thus the events should reflect WHO is doing WHAT in a collaborative environment. When WHO or WHAT items change, this starts/ends an event.
Two phases of coding were employed for the analysis of the sessions as follows: 1st phase coding (Analysis of Context)
The analysis of context was based on descriptions of the context in which the events take place. The questions can be: are they involved in a design related activity? If yes, what type of design activity? Are the architects communicating or producing representations or both? In which medium do those activities occur? Who is engaged in the activity? What tools do they use?. Table 1 shows the codes used for the 1st phase coding in the pilot study.
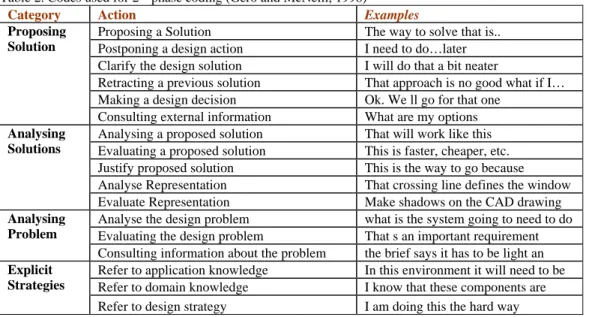
Table 1. Codes used for 1st phase coding
Category Action
Drawing new
Tracing on a previous material Looking at previous representations Representation
Activity
Re-working previous representations Conversation
Pen and Paper Medium
Conversation + pen and paper
Who Des1, Des2, other
One designer present Both designers present No designers present Presence
Interruption (designers present but not designing) 2nd phase coding (Analysis of Designing Process)
The analysis of the designing process is based on theories that characterise design as an ill-structured problem solving process. In order to analyse the designing process, we used selected codes from a process-oriented coding scheme (Gero and McNeill, 1998). The scheme is based on problem understanding and solving strategies and it involves categories of analysing a problem, evaluating a problem, proposing solutions, as well as the knowledge types referred to. Table 2 shows the codes used for the 2nd phase coding.
Table 2. Codes used for 2nd phase coding (Gero and McNeill, 1998)
Category Action Examples
Proposing a Solution The way to solve that is.. Postponing a design action I need to do…later Clarify the design solution I will do that a bit neater
Retracting a previous solution That approach is no good what if I… Making a design decision Ok. We ll go for that one
Proposing Solution
Consulting external information What are my options Analysing a proposed solution That will work like this Evaluating a proposed solution This is faster, cheaper, etc. Justify proposed solution This is the way to go because Analyse Representation That crossing line defines the window
Analysing Solutions
Evaluate Representation Make shadows on the CAD drawing Analyse the design problem what is the system going to need to do Evaluating the design problem That s an important requirement
Analysing Problem
Consulting information about the problem the brief says it has to be light an Refer to application knowledge In this environment it will need to be Refer to domain knowledge I know that these components are
Explicit Strategies
Refer to design strategy I am doing this the hard way Example Results
The design process codes reflect the qualitative aspects of the design process. The use of a coding scheme enables us to quantify those qualitative aspects, so that it is possible to count the number of occurrence of each action during the design process. The occurrence frequency of actions can be investigated in events, in specific time intervals where design content changes or over the whole design session. These explorations on the qualitative data inform us about the characteristics and even anatomy of the design activity (or design task) at hand.
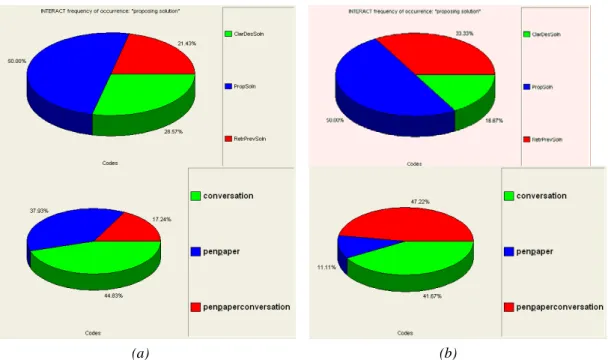
When the coding process is finalized with INTERACT it is possible to obtain the percentage of each action in a category, in one session, or in overall sessions. We preferred to produce pie charts for each coding category, to observe what percentage of each activity was involved in each session. As an example, percentages of actions in “proposing solution” category and the percentages of Medium category are demonstrated for each session in
Figure 4. The change in the percentages of actions can be observed in the two following design sessions, which means the anatomy of the design activity in each case is different although there they work on the same design task.
(a) (b)
Figure 4. (a) Session 1 and (b) Session 2: Occurrence of Actions in Proposing Solutions Category (top). and by Medium (bottom) in percentages
An analysis of time data was carried out using data from both sessions recorded. The duration of an event was from 28 seconds to 4:58 minutes. The average length of time interval for an event was 01:15 minutes Session 1 and 01:24 min in Session 2. After coding the sessions with INTERACT it was possible to plot each action over the timeline of the design activity. An example can be seen in Figure 5 which demonstrates the representational activity patterns over the timeline of the sessions. This type of representation enables us to explore the action profiles during the sessions. “The actions over time” plots in Figure 5 shows different activity patterns for the two following design sessions, which again distinguishes each design session.
Figure 5. Representation of activities along the timeline (above: Session1, below: Session 2)
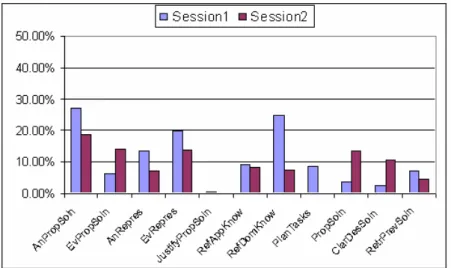
INTERACT precisely documents the total time spent in each action/code. This feature is convenient for estimating the percentage of durations of each action over the total time of the session. So that the total time spent on specific actions can be observed and compared in each session. This type of information also contributes to our understanding of the anatomy of the design activity. As an example we show in Figure 6 the duration of the actions in the second coding phase as a percentage of the elapsed time in each session.
Figure 6. Duration of actions as a percentage of the elapsed time
SOFTWARE EVALUATION
By exploring the facilities and features of the INTERACT software system in conditions that replicate the future design studies, we have ascertained that it meets our requirements to a high degree. The following section summarises the results of the software evaluation.
INTERACT handles the observational data in a comprehensive way. The interface, Figure 3, allows the analyst to view video streams in the same monitor or in a separate monitor depending on preference. The coding list results are represented with time codes in rows and action codes in columns within Scene, Take, and Event hierarchy from larger to smaller activity definitions. Segmenting the design session into events was relatively easy compared to the traditional methods, where the time code has to be noted down manually every time a new segment starts. We saved time using the software since the start of a new event can be marked by simply pressing the space bar on the keyboard, and start/end time of the event is automatically entered in the coding list. Watching the video and deciding on the segment intervals interactively in one interface allows continuity of the segmentation process. This is an advantage from an analyst’s perspective since his/her focus is not disturbed by going back and forth between different media (which slows down the decision on the start or end of the segments/events).
We saved time by using the software for handling the data and for the coding process. The software provides us with a comprehensive platform to explore, view and code the audio-video recordings. Once the connection is constructed between the frames of the video stream(s) and the codes, it is possible to play back again those sequences of frames with the associated codes to it. Any time in the coding process, the analyst can go back and change the associated codes to an event (sequence of frames). It is also possible to change the event interval, delete events or create overlapping events in the session. The user can interact with the coding process in a simple and intuitive way, by pressing a key to start and end an event or press letters on the keyboard to input the codes in the list.
Since we are using a relatively rich coding scheme, we have established that the software can accommodate multiple codings in one event. INTERACT has a “lexical coding” option which enables coding a number of behavioural codes in one event say for an architect in one event looking at a previous representation, drawing a new depiction and then commenting on the window size can easily be coded. Further, the “combined coding” option enables us to input two codes together from the same category. Consider the WHO category includes architects A and B and if two architects are drawing on the same paper at the same time, A+B should be the input code for the WHO category. Combined coding option allows the analyst to do that. The result of a combined coding option can be observed, as shown in Figure 4 above, and a combination of two codes “pen & paper plus conversation” is presented as a new code (pen & paper /conversation) which means two codes occur at the same time in one event.
The coded sessions in INTERACT can be exported as an Excel worksheet. This allows us to carry out different types of statistical analysis that are additional to those provided by the software. For example, in order to produce the graph shown in Figure 6, one has to estimate the duration of the actions as a percentage of the elapsed time. Since the event start and end times were created automatically it is possible to obtain the duration of each action and then estimate percentages using Excel. Having reliable transfer of data between different software applications is thus a useful feature for allowing customised analyses and representations.
In a collaborative design activity, participants involved in the activity often employ parallel actions. For example, while architect A is drawing, architect B can talk to colleague C in the same environment about the drawing
architect A is producing. Thus, determining the participants in the WHO category is as important as to distinguish WHAT is being done or the content of conversation. This means one design session has to be coded separately for each participant’s actions. If there are three participants involved in the activity, the resulting coding list would include three versions with overlapping events representing each participant’s activity patterns. Those activities along the timeline can be represented with an action-timeline graph such as in Figure 5, so that the duration and sequences of multiple actions that are different for each participant can be inspected in one representation. These types of graphs are beneficial to discover and explore behavioural or conversational patterns in collaborative design activity.
In the following stages of the project where a more detailed coding is needed to analyse some collaborative activities, we are planning to document each participant’s actions along the timeline and represent the number of participants involved in the activity as explained above. We intend to use an elaborated version of the coding scheme, and additionally, transcriptions of the verbalizations will be attached to each event. The adaptability of the software to text attachments and longer recorded sessions has not been tested in this evaluation study. As further analysis will introduce heavier demands on the software, we might experience limitations. However, for the current study, the use of INTERACT was found to be effective and timesaving and appears to offer a significant advantage to the analyst and hence the efficiency of the research process.
CONCLUSIONS
This paper has described a study in the use of a software system for coding and analysing audio video data in the context of research studies that are being undertaken in a live commercial environment. The software application was selected after a survey of several available systems based on a set of requirements established for the particular research situation. We have established that the software system INTERACT performed well in the pilot study and was a clear enhancement to the task of the research analyst.
REFERENCES
Britton, J.H., Candy, L. and Edmonds, E.A. (1998) Software support for usability measurement: an application to systems engineering data exchange development, in H. Johnson, L. Nigay, C. Roast.(eds) Proceedings of HCI’98, People and Computers XIII, Springer-Verlag Berlin, 37-52.
Candy, L. and Harris, D. (2001) Evaluating model data exchange between system engineering tools, Journal of Systems Engineering 4 (1), 13-23.
Gabriel G. C. and Maher M. L. (2002) Coding and modelling communication in architectural collaborative design, Automation in Construction 11, 199–211.
Gero, J. and Mc Neill, T. M. (1998). An approach to the analysis of design protocols, Design Studies, 19, 21-61. How Designers Think (2003) Graduate Course (DESC9099) material, School of Architecture, Design Science
and Planning, University of Sydney.
INTERACT (2004) User Guide, Mangold Software and Consulting GmbH.
ACKNOWLEDGEMENTS
The work was partly funded by the CRC Sustainable Assets B, Construction Innovation Program, Project 2002-024-B "Team Collaboration in High Bandwidth Virtual Environments". The authors wish to thank the project partner companies whose contribution to the development and implementation of the methodology was invaluable.
COPYRIGHT
[Candy, Bilda, Maher, and Gero] © 2004. The author/s assign Griffith University a non-exclusive license to use this document for personal use provided that the article is used in full and this copyright statement is reproduced. The authors also grant a non-exclusive license to Griffith University to publish this document in full in the Conference Proceedings. Such documents may be published on the World Wide Web, CD-ROM, in printed form, and on mirror sites on the World Wide Web. Any other usage is prohibited without the express permission of the authors.