Web Security Manager 4.2
www.alertlogic.com
[email protected]
February, 2014
Alert Logic, the Alert Logic logo, the Alert Logic logotype and Web Security Manager are trademarks of Alert Logic Inc. Products mentioned herein are for identification purposes only and may be registered trademarks of their respective companies. Specification subject to change without notice.
1. Connect to the Web Security Manager web management interface 2 1.1. Navigating Web Security Manager web management interface 2
2. Basic system configuration 4
3. Website configuration 5
4. Testing if it works 8
4.1. Change / configure DNS for the website. 8
4.2. Test connectivity 8
5. View the website deny log 9
6. Change default passwords 10
6.1. admin user 10 6.2. operator user 10 7. Getting help 11 2. Dashboards ... 13 1. Deny Log 14 1.1. Interactive graph 14 1.2. Interactive list 14 2. Learning 18 3. System 19 3.1. System status 19 3.2. Interfaces 19 3.3. Modules 19 3.4. Disk I/O 20 3.5. Disk 20
3.6. Read-only monitor access 20
3.6.1. As HTML 20 3.6.2. XML format 20 4. Traffic 21 4.1. Interfaces 21 4.2. Traffic by website 21 3. Services ... 23 1. Websites 24 1.1. Websites list 24 1.1.1. Defined websites 24 1.2. Adding a website 24
1.2.1. Virtual web server 24
1.2.2. Real web servers 25
1.2.3. Default Proxy 26
1.2.4. Initial operating mode 27
1.2.5. Removing a proxy 27
1.3. Global 27
1.3.1. Server ID 27
1.3.2. HTTP request throttling 28
1.3.3. HTTP connection limiting 29
1.3.4. SSL Server Name Indication 31
2. Network 32
2.1. Blacklisted Source IPs 32
2.2.1. Allowing an IP address to bypass network controls 33
2.3. DoS mitigation 34
2.4. Attack source Auto blocking 34
2.5. Network routing 35
4. Application Delivery Controller (ADC) ... 37
1. Virtual host 38
1.1. Deployment 38
1.1.1. Reverse Proxy 38
1.1.2. Routing Proxy 38
1.2. Virtual web server 39
1.3. SSL Certificate 40
1.3.1. Importing the SSL certificate 40
1.3.2. Exporting certificate from web server 41
1.4. Virtual host aliases 41
1.4.1. Wildcards 42
1.4.2. Default Proxy 42
1.5. Timeouts 42
1.6. HTTP Request and Connection Throttling 43
1.6.1. HTTP request throttling 43 1.6.2. HTTP connection throttling 44 1.7. Client Source IP 44 1.7.1. X-Forwarded-For 44 1.7.2. Transparent Proxy 46 1.7.3. Trusted proxy 47 1.8. Redirects 47 1.8.1. Match types 47 1.8.2. Prefix match 48 1.8.3. Regex match 49
1.8.4. Vhost regex match 50
1.8.5. Examples summary 51
1.9. Lower button bar 52
2. Load balancing 53
2.1. Real web servers 53
2.2. Timeouts 54
2.3. Load balancing settings 54
2.4. Health Checking 56
2.5. Insert request headers 58
2.5.1. Request header variables 59
2.6. Advanced settings 59
2.7. Lower button panel 60
3. Caching 61
3.1. Static Caching 61
3.2. Dynamic caching 62
3.3. Lower button bar 63
4. Acceleration 64
4.1. Compression 64
4.1.1. Compression level 64
4.1.2. Compress response content-types 64
4.2. TCP connection reuse 65
5. Statistics 67
5.1. Interval selection 67
5.2. Summary section 67
5.3. Compression and served from cache graph 68
5.4. Requests total and served from cache graph 68
5.5. Original data and data sent graph 69
5.6. Lower button bar 69
5. Web application firewall (WAF) ... 71
1. Policy 72
1.1. Basic operation 73
1.1.1. WAF operating mode definitions 73
1.1.2. Request parsing 75
1.1.3. Attack class criticality 78
1.1.4. Source IP tracking and blocking 78
1.1.5. External notification 79
1.1.6. Deny log settings 81
1.1.7. Access log settings 83
1.1.8. Mirror proxy policy from master 86
1.2. Protocol restrictions 87
1.2.1. Allowed HTTP methods, protocol versions and web services 87
1.2.2. Headers, restrict length and number 89
1.2.3. Cookies, restrict length and number 90
1.2.4. Request, restrict length and number 91
1.2.5. File uploads, restrict size and number 92
1.2.6. Request parameters, restrict size and number 93
1.3. Website global policy 95
1.3.1. Validate static requests separately 95
1.3.2. URL path validation 96
1.3.3. Denied URL paths 97
1.3.4. Query and Cookie validation 97
1.3.5. Headers validation 99
1.3.6. Attack signatures usage 101
1.3.7. Session and CSRF protection 102
1.3.8. Trusted clients - IP whitelisting 105
1.3.9. Trusted domains 106
1.3.10. Evasion protection 107
1.3.11. Time restricted access 108
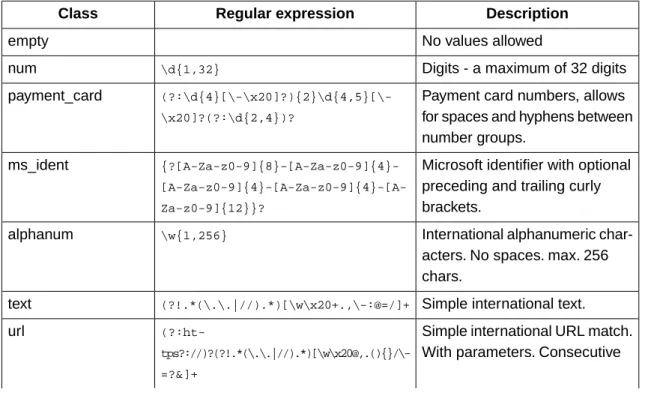
1.3.12. Input validation classes 109
1.4. Web applications 110
1.4.1. Web application settings 111
1.4.2. Global violation action override 112
1.4.3. Methods allowed 112
1.4.4. Session protection 112
1.4.5. Parameters 113
1.5. Output filter 115
1.5.1. Backend server cloaking 115
1.5.2. Output headers validation and rewriting 117
1.6. Authentication 119
1.6.1. SSL client authentication 119
1.6.2. SSL client Certificate Revocation Lists (CRLs) 120
1.6.3. SSL client authorization 121
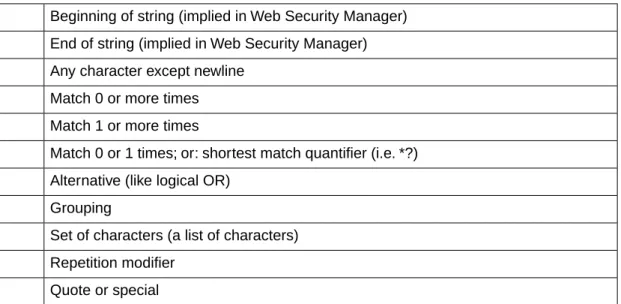
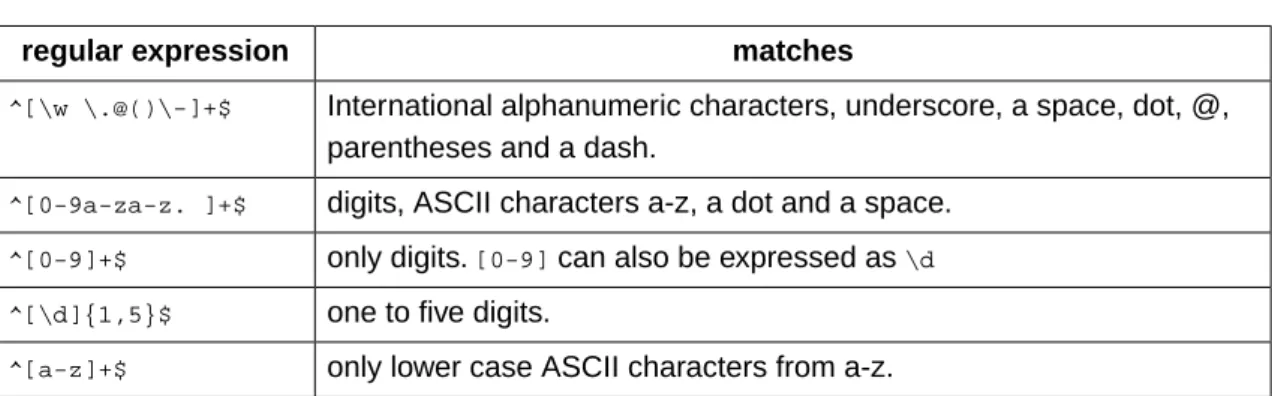
1.7. Regular expressions 123
1.7.1. What are regular expressions 123
1.7.2. Metacharacters 124
1.7.3. Repetition 124
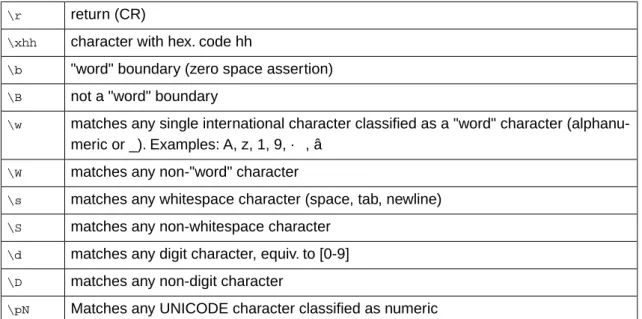
1.7.4. Special notations with \ 124
1.7.5. Character sets [...] 125
1.7.6. Lookaround 125
1.7.7. Examples 126
1.7.8. Further reading 128
2. Deny and error handling 130
2.1. Deny action 130
2.2. Error messages 130
2.2.1. Document not found (error 40x) 130
2.2.2. Authentication required (error 403) 133
2.2.3. Server error (error 50x) 135
2.3. Lower button bar 137
3. Learning 138
3.1. Learning data 138
3.1.1. Applications learned 138
3.1.2. Global parameters learned 139
3.1.3. Static content learned 140
3.1.4. Tools 140
3.1.5. Lower button bar 142
3.2. Learning status 142
3.2.1. Learning progress indicators 142
3.2.2. Policy history 143
3.2.3. Resulting policy 143
3.2.4. Sample run information 145
3.2.5. Lower button bar 145
3.3. Learning settings 146
3.3.1. Policy generation options 146
3.3.2. Global parameters 148
3.3.3. Policy verification 149
3.3.4. Learning thresholds 150
3.3.5. Learn data sampling 154
3.3.6. Lower button bar 155
4. Log 156
4.1. Deny log 156
4.1.1. Specifying filter criteria 156
4.1.2. Blocked and failed requests 158
4.1.3. Lower button bar 163
4.2. Access log 163
4.3. Access log files 163
5. Reports 165
5.2. Generated reports 165
6. System reference ... 167
1. Clustering 168
1.1. Cluster virtual IP configuration 168
1.2. Synchronization configuration 168
1.3. Cluster configuration examples 171
1.3.1. Configuring a fail-over cluster 171
1.4. VRRP Interfaces 172
1.5. Fail-over status information 173
2. Configuration 174
2.1. Network 174
2.2. Static routes 175
2.3. Syslog - logging to external host 176
2.3.1. Mapping of Web Security Manager System Logs to Syslog
facilit-ies 177
2.4. SNMP 177
2.5. Date and Time 178
2.6. Admin contact 179
2.7. Email system alerts 179
2.8. Forward HTTP proxy 180 2.9. Backup configuration 181 2.9.1. FTP configuration 181 2.9.2. SCP configuration 182 2.10. Auto-backup 183 2.11. Remote access 184 2.12. Management GUI 184 2.12.1. Password requirements 184
2.12.2. Login and session restrictions 185
2.12.3. SSL certificate 186
3. Information 188
3.1. System 188
3.2. Web Security Manager 188
3.3. Devices 188
3.4. Disks 188
3.5. Currently logged in users 189
4. Interfaces 190 4.1. IP configuration 190 4.2. Role 191 4.3. Media settings 192 5. Logs 193 6. Tools 194 6.1. Network tools 194 6.1.1. TCP connect test 194 6.1.2. Network debug 194
6.2. Reboot and Shutdown 195
6.3. Technical information for support 195
6.4. License information 195
7. Maintenance 197
7.1.1. Best effort - restoring to different platforms 197
7.1.2. Local backup 197
7.1.3. Restore 197
7.2. Website templates list 198
7.3. Databases 198
7.4. Website access logs list 198
8. Updates 200
8.1. Updates available for installation 200
8.1.1. Installing updates 200
8.2. Installed updates 200
8.3. Configuring for updates 200
9. Users 201
9.1. User accounts 201
9.1.1. Built in user accounts 201
9.1.2. Additional accounts 201
9.2. Current user 201
9.3. System users 201
7. The command line interface ... 203
1. Accessing CLI 204 1.1. Console access 204 1.2. SSH access 204 2. Command reference 205 2.1. show interfaces 205 2.2. show interface 205 2.3. show gateway 205 2.4. show hostname 205 2.5. show routes 205 2.6. show version 206 2.7. set gateway 206 2.8. set interface 206 2.9. set password 206 2.10. set user 206
2.11. system backup run 206
2.12. system cache flush 206
2.13. system ping 207
2.14. system updates fetch 207
2.15. system updates query pending 207
2.16. system updates query installed 207
2.17. system updates install 207
2.18. system status 207
2.19. system restart 208
2.20. system shutdown 208
2.21. system reboot 208
2.22. system remotesupport 208
2.22.1. View remote support status 208
2.22.2. Enable remote support 209
2.22.3. Disable remote support 209
2.23. quit 209
1. Simple single-homed Web Security Manager implementation 212 2. Firewalled single-homed Web Security Manager implementation 213 3. Firewalled Web Security Manager implementation with a fail-over/backup Web
Se-curity Manager 214
4. Dual-homed performance optimized Web Security Manager implementation 215
9. Frequently Asked Questions ... 217
1. Deployment 218
2. Client issues 219
3. SSL Certificates 220
4. Troubleshooting 221
5. Clustering 222
6. Accessing Web Security Manager management interfaces 223
7. Learning 224
Application Firewall
Web Security Manager Web Application Firewall is implemented in the network as a filtering gateway which validates all requests to the web systems.
Web Security Manager defends against all OWASP Top Ten vulnerabilities, supports XML web services and provides full PCI DSS Section 6.6 requirements compliance.
The following modules are included providing acceleration, scalability and proactive protection of web systems:
Load Balancer
Enabling scalability and acceleration of even complex SSL-enabled stateful web applications. Web Accelerator and cache
Reducing traffic cost, improving response time and off-loading web servers. Web Application Firewall
Proactive protection of web servers and web applications by employing a positive security model providing defenses against all OWASP top ten vulnerabilities.
Web Security Manager includes a hardened OS and installs on most standard hardware. The Web Security Manager software appliance installer turns a piece of general purpose application server hardware into a dedicated application acceleration and security gateway within minutes - with minimal interaction.
The Web Security Manager software appliance combines the flexibility and scalability advantages of software with the security advantages and administrative simplicity from dedicated hardware appliances.
Automated application profiling, adaptive learning, positive and negative filtering and support for XML based web services allow for out of the box protection against attacks from malicious hackers and worms.
As the website is learned Web Security Manager gradually turns towards a positive, white-list based, policy providing protection against attacks targeting undisclosed vulnerabilities in standard software and custom built applications.
1. Connect to the Web Security Manager web management
interface
Access the Web Security Manager management in-terface by opening a web-browser and entering URL https://websecuritymanager_ip_address:4849 (note HTTPS). The management address in the example installation is: https://192.168.3.20:4849.
If you are accessing the management interface for the first time, you will be asked for a license key.
Enter the license key provided in your License key and support contract information letter (PDF) and click the "Activate" button. After successfully entering the license key, you are asked to agree to the Web Security Manager license agreement. After you have read and agreed to the license agreement, you are redirected to the Web Security Manager management login screen.
Log in using username “admin” and password [last nine characters of license key in reverse order]. Please change the password after the initial login. Instructions for changing your password are found below.
1.1. Navigating Web Security Manager web management interface
Figure 1.1. The management interface
After successful login, you will be presented with the management interface website overview page. The management interface is divided into 4 main sections:
Dashboards
A quick overview of denied requests, traffic, system status and learning progression. Services
Configuration and management tool for all website proxies, including policy, caching, acceler-ation, load balancing, HTTP request throttling and DoS mitigation settings.
To add a website or to select a website for management click Services→Websites
System
Configuration of system parameters like network interfaces, IP addresses, fail-over, network settings (DNS, NTP, SMTP), viewing of system logs and status information, including admin-istration of updates, backup and configuration restore.
Main (vertical) menu system is on the left side of the screen. Content assigned to the menu item is displayed on the right side of the screen. An additional horizontal menu system appears where applicable.
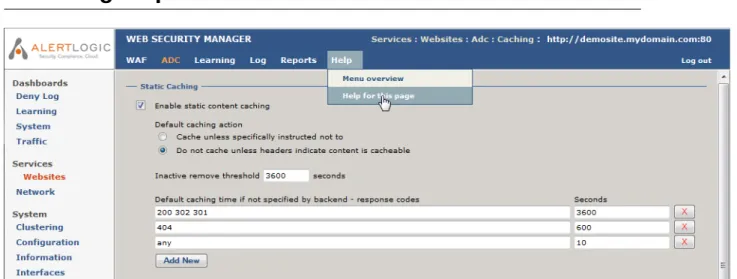
Help
Access to help and support related information including documentation, version information and support links. The complete manual is available in HTML and PDF versions on the Doc-umentation page.
On any page, clicking on Help in the horizontal menu will display the manual reference section specific for that page.
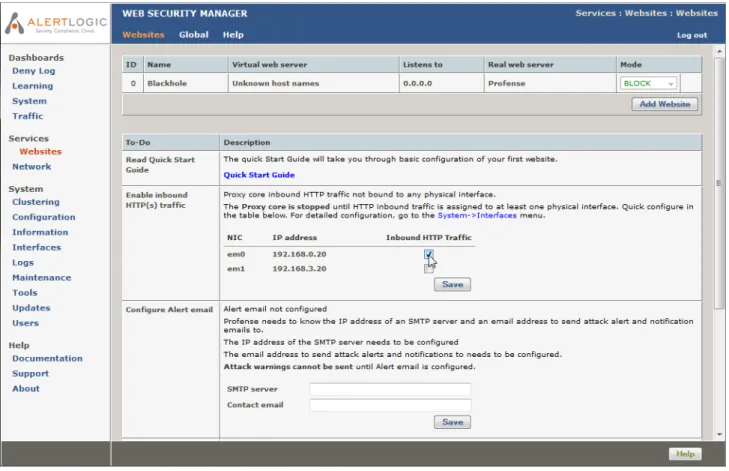
2. Basic system configuration
To make sure essential system configuration tasks are not forgotten, a to-do list basic system configuration tasks is displayed. When an item is done it will disappear from the list. When the first website is added the "read Quick Start Guide" item will disappear.
Select which network interfaces you want to respond to inbound HT-TP/HTTPS requests from clients.
Enable inbound HT-TP(s) traffic
Web Security Manager needs to know an SMTP server and an email address it can send log warnings, update notifications, etc. to.
Configure Alert email
SMTP server: Enter the address of an SMTP server that is reachable and accepts SMTP requests from Web Security Manager.
Contact email: Enter the email address to send notifications to. This item can be skipped but it is recommended.
IP address of one or more DNS servers.
Configure DNS
Valid input IP addresses
Use space to separate multiple hosts (only one required). Input example
192.168.0.1
IP address or host name of an NTP server.
Configure time
syn-chronization Remember to set up at least one DNS server if you enter a host name
here. Valid input
IP address or fully qualified domain name.
Use space to separate multiple hosts (only one required). Input example
3. Website configuration
Now configure a website.
1. Select Services→Websites in the left menu pane. This will take you to the websites overview page.
2. Click on the Add Website button.
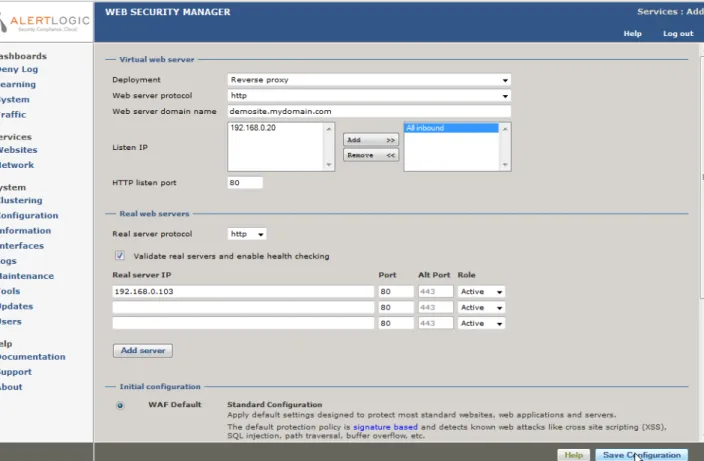
The Services→Add page is displayed.
Figure 1.2. Add website page
In the Virtual web server section you configure the part of the website proxy that the clients connect to.
1. In Deployment select either Reverse proxy or Routing proxy.
Both deployments terminate client requests and proxies requests to the backend real server but while Reverse proxy requires an IP address to be configured on the WSM node the Routing proxy deployment routes traffic to the backend server but intercepts traffic for the configured ports, processes it and proxies it to the backend.
For routing proxy deployments make sure that IP forwarding us enabled in Services→ Network→Network routing.
2. In Web server protocol select either HTTP, HTTPS or Both. The latter will create a website proxy that responds to both HTTP and HTTPS requests.
When selecting HTTPS or Both as the protocol a temporary certificate will be generated. When the new proxy is created the certificate can be replaced by importing the real certificate
in Services→Websites→ADC→Virtual host. Click Help in that section to get instruc-tions.
3. In Web server domain name enter the address of the web server you want to protect. The address is the one users enter in the browser to go to the website.
In the example demosite.mydomain.com is entered.
4. In Listen IP select the IP address(es) you want the web server to respond to. For HTTP websites All inbound can be selected. This will configure the website proxy to respond to all IP addresses that are configured to accept inbound requests. For HTTPS proxies it is mandatory to select a specific IP address.
5. In HTTP(s) listen port select the port(s) you want the website to listen to. For HTTP proxies the default is 80 and for HTTPS proxies the default is 443. When creating a website proxy that serves both HTTP and HTTPS two input fields will appear.
In the Real web servers section you configure how the website proxy communicates with the backend web servers.
1. In Real web server enter the address of the web server you want Web Security Manager to redirect allowed client requests to. This address is the address of the web server you want to protect. In the example 192.168.0.103 is entered.
2. In Real server protocol select the protocol you want Web Security Manager to use when connecting to the backend web servers. If you want the traffic to the backend web servers to be encrypted select HTTPS otherwise leave it at the default HTTP.
Note that you should only select HTTPS if it is necessary. HTTPS puts an extra burden on the backend web servers.
3. Decide on real servers health checking. When Validate real servers and enable health checking is checked Web Security Manager will connect to the backend servers automat-ically find a suitable target page to use for health checking. If health checking is not enabled backend server status will not be monitored by Web Security Manager.
4. For each backend web server that is serving the website (demosite.mydomain.com in this example) enter the IP address and port in the real servers list.
Real server IP and Port: the IP address / port combination the web server is listening on. Typically Address:80 for HTTP servers and Address:443 for HTTPS servers.
Role: Select Active, Backup or Down. Active means that requests will be forwarded to the server. When Backup is selected the server will only be used if no Active servers are in operation. Down means that the server should not be used - for instance if it is down for maintenance.
Finally, In the Initial configuration section, select the initial configuration template to apply to the website proxy.
Now click the Save Configuration button in the lower right corner of the page. This will save your configurations and take you back to the websites overview page.
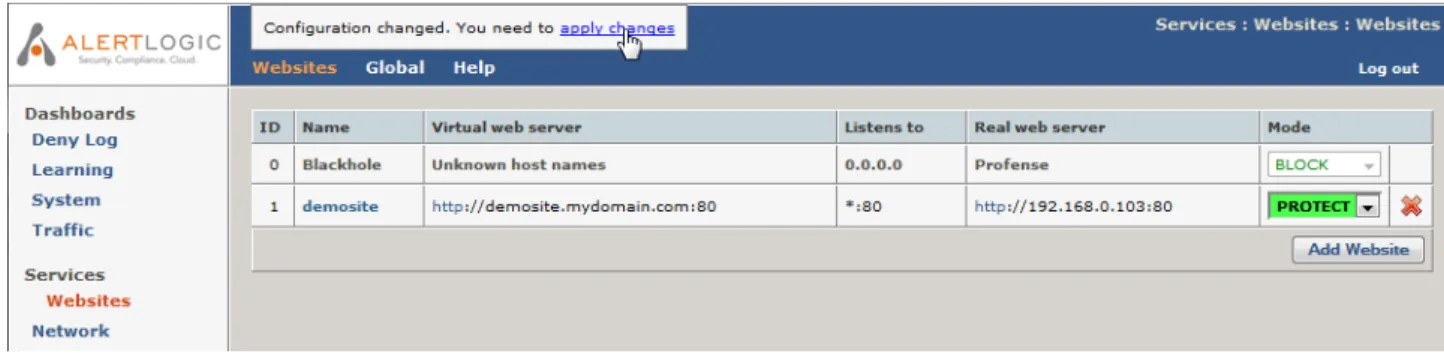
1. Click the blinking link apply changes that appears in the upper right corner of the page to apply those changes to your configuration of Web Security Manager.
Figure 1.3. Websites overview page
4. Testing if it works
Now test your newly configured website.
4.1. Change / configure DNS for the website.
For testing purposes, make the website domain name resolve to the Web Security Manager IP address for example by adding the IP address and domain name to the hosts file on your PC.
Figure 1.4. Editing the hosts file
4.2. Test connectivity
In a new browser page (or tab) enter the address of the website you configured.
You should see the home page of the website and it should be served by Web Security Manager. To check that Web Security Manager is serving the content, enter an URL that will match an attack signature. To match the path traversal signature (for instance) append the parameter
print=../../../etc/somefile to a page.
http://demosite.mydomain.com/testpage.php?print=../../../etc/somefile
If the page is served through Web Security Manager you will get:
Figure 1.5. Default deny page
If the above is not displayed, please restart your browser and / or flush your DNS cache by running cmd.exe (on your PC) and enter ipconfig /flushdns. Then try the request again.
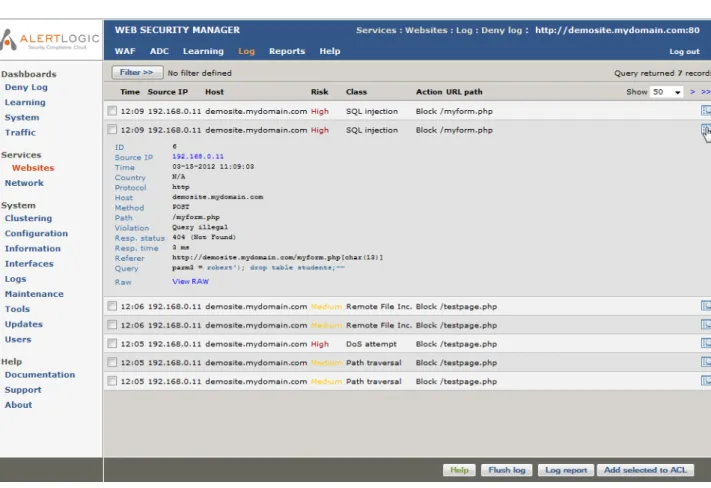
5. View the website deny log
Figure 1.6. Deny log
In the Web Security Manager management interface select Web Firewall→Websites in the left vertical tool bar . The websites overview page will be displayed. Select the website by clicking on it.
When selecting a website the landing page is the Deny Log.
To view details of a log entry click the Inspect icon in the right most column of the list as in the example above.
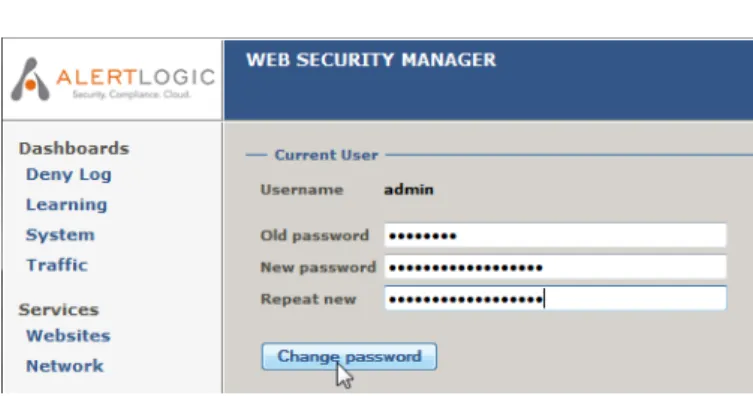
6. Change default passwords
Now change the default passwords for the admin user (web based management interface) and the operator user (the system console) by completing the following:
6.1. admin user
Figure 1.7. Password change page
Change the administrator password from the default value in:
System→Users
Change the password for the console user Operator in the console.
6.2. operator user
1. Log in to the console with user name: operator password: changeme
2. Enter the command set password
login: operator Password: changeme
Web Security Manager command-line management interface
psh> set password
Changing local password for operator. Old password: changeme
New password: R0dsQAVg
Retype new password: R0dsQAVg psh> quit
Web Security Manager/amd64 (ttyC0)
7. Getting help
Figure 1.8. Context specific help
By clicking the green Help menu item in the horizontal menu the relevant section in the manual is opened in a new window.
1. Deny Log
In Web Security Manager websites have separate security policies and deny logs. This allows for fine grained tuning of policies and makes it easy to provide detailed reporting to management and application/web site owners. For the security administrator it is necessary though to have the ability monitor the deny log for all websites. The deny summary window provides such functionality by summarizing log data for all configured websites. The window consists of two sections:
1. An interactive graph with drill down functionality which summarizes all deny log events in a column graph.
2. A more detailed interactive list with drill down functionality which shows deny log events for all websites above a configured risk level (default medium).
Both elements provide drill down functionality which will allow for narrowing in on events in the specific websites deny log.
1.1. Interactive graph
The interactive column allows for zooming in on log events through 3 levels.
For all three levels the date selector allows for scrolling through historic log events and Hovering the pointer over a column will display the exact number of requests for that category.
1. By date and risk.
For each date in the selected period deny log events are shown divided into the 5 risk cat-egories critical through none.
Clicking one of the columns will zoom in on that date taking you to level 2. 2. By website and risk.
For each website/application deny log events are shown divided into the 5 risk categories
critical through none.
Clicking one of the columns will zoom in on log events for that website for the specific date selected.
3. Single website by attack class.
The lowest level of the interactive graph shows log events for a specific website by attack class, sql injection, XSS, etc. By default log entries are only shown for one day but the in-terval can be extended by selecting a different inin-terval using the Show drop-down in the date selector.
Clicking on an attack class column will take you to the deny log of the website creating a filter that shows only log entries satisfying the selection in the interactive graph.
1.2. Interactive list
The interactive list shows log entries above a configurable risk level for all websites.
Blue column headings indicate that the result can be sorted by that column. Clicking the same column will toggle sort direction (asc/desc).
The top level of the list shows attacks summarized by either source IP or country. Clicking on a row will display a list showing the number of attacks showed in the attacks column. When the list is summarized by IP the list will show log records from all websites from that specific source IP.
When the list is summarized by country the list will display log records from all websites summarized by source IP. Clicking on a row will show details from that specific IP.
When showing IP details, clicking the details icon in the rightmost column of the list will display details from that log event.
The description of the columns below apply to all detail levels of the list. Some columns are spe-cific for a level and will not be visible in other.
By default the list shows all records for a maximum of 90 days. By checking Limit to Graph interval
the list can be set to only display records for the interval specified in the graph above. Source IP the requests originated from.
Source IP
Country the requests originated from.
Country
Total number of attacks recorded from country/IP.
Attacks
Click row to zoom in on attacks.
Date and time the last request from IP/Country was logged.
Last seen
By default results are sorted by date.
Risk classification of the log entry. Options are:
Risk • Critical • High • Medium • Low • None
Attack classification of the log entry. Options are:
Attack Class
• SQL injection • XPath injection • SSI injection • OS commanding
• XSS (Cross Site Scripting) • Path traversal • Enumeration • Format string • Buffer overflow • DoS attempt • Worm probe • Access violation • Malformed request • Session invalid • CSRF • Session expired
• Broken robot • Broken int. link • Broken ext. link • Other
• None
• False positive • Friendly
Shows the general violation description as defined by Web Security Manager. Options are:
Violation
• Generic violation • Header unknown • Header illegal • Path unknown
• Query unknown - no policy rules match the name of the parameter. • Query illegal - a policy rule is matching name of the parameter
but the parameter value does not match the corresponding regular expression for validating the input value.
• Header length • Missing hostname • Invalid hostname • Header failed • Path denied • Upload attempt • Payload length
• Session validation failed • Form validation failed • Session expired • Malformed XML
• Content type not enabled - Content type is supported but not en-abled.
• Negative match
Block action taken on the request. Options are:
Action
Showed only in IP de-tails view.
Allow
The request was allowed, either because the current mode and whitelist configuration or because the requests was allowed accord-ing to policy. If the request was allowed by policy the reason for the
request being logged in the deny log is typically that the backend server responded with an error. Expand the request to see details. Block
The request was blocked by Web Security Manager. Block-IP
The request was blocked by Web Security Manager and the source IP was blacklisted resulting in further requests from that source being blocked at the network level.
Strip
The offending part of the request was stripped before allowing the request. Used for instance to remove session cookies for expired sessions.
Date and time the request was logged.
Time
Offending method (if any)
Method
Detail - click details icon to view.
If applicable shows the response status from the backend server like
404 not found or 200 (OK).
Resp. status
Detail - click details icon to view.
The time from Web Security Manager received the request and forwarded it to the backend server until the response is sent to the client from Web Security Manager.
Resp. time
Detail - click details icon to view.
The refering source, internal or external, from which the request origin-ated.
Referer
Detail - click details icon to view.
Offending header fields and values (if any).
Header
Detail - click details icon to view.
Offending parameter names and values (if any).
Query
Detail - click details icon to view.
Shows the original request as send by the client. To view it, click on the
View RAW request button.
Raw
Detail - click details icon to view.
2. Learning
Key learning indicators for each website are displayed in an overview table. Website name as configured in Web Security Manager.
Website
The total number of requests processed during the learning process.
Samples
Total number of unique URL paths identified.
URL paths
Total number of unique parameter names identified. Uniqueness is de-termined by URL path. Two parameters with the same name but mapped
Parameters
as belonging to different URL paths are therefore identified as two unique parameters. When the policy is built Web Security Manager identifies parameters with similar names and input data as as global in scope and builds global patterns matching such parameters.
An indicator bar showing the progress of the sampling process.
Sampling progress
Sampling is the process of collecting information about the website in terms of what paths/applications are used, what parameters do they take as input, what extensions are used for static content, etc. An indicator bar showing the progress of the verification process.
Verification Progress
The verification process 1) validates the data samples using statistical methods like analyzing spread in IP sources and time, number of re-quests, etc. and 2) verifies that the resulting policy covers the requests sampled.
As the Web Security Manager Learner extracts characteristics like ex-tensions, specific directories in paths and global parameters (parameter names a number of applications take as input - like print=1) and even patterns used in global parameters the verification process may start before the Data sampling progress has reached 100%.
Verification is calculated as the number of sample runs in a row with no policy changes relative to the required number configured in learner settings.
When Verification has reached 100% Web Security Manager will either build and commit a new policy or notify the administrator by email that verification has reached 100% and a new policy can be built and com-mitted.
3. System
The Status Monitor page displays system monitoring information.
The monitor page can be viewed as a separate read-only page without the menu system. Also the information is available in XML-format. See velow for more information.
3.1. System status
Displays current system usage statistics. The window is constantly updated.
CPU load.
CPU usage
Average system load.
Load
Free and total system memory in megabytes.
Memory (physical)
Maximum and used swap memory in megabytes/kilobytes.
Memory (swap)
Open files and sockets.
Files/Sockets
Number of running processes.
Processes
Currently used network buffers, peak usage and available.
Network buffers
3.2. Interfaces
Displays various interface information parameters. Interface description/name.
Interface
Physical interface status.
Status
Current system IP address for the interface.
System IP
Incoming data.
In data
Outgoing data.
Out data
Incoming packets in packets per second.
In pkts.
Outgoing packets in packets per second.
Out pkts.
3.3. Modules
Displays status and memory usage for important system components.
In the graphical user interface in general daemons can have the values OK (in XML output 1) or
ERROR (in XML output -1). The Sync Daemon and Proxy core have some extra status codes that are explained below.
Proxy core components.
Proxy core
Status code can be STOPPED indicating that no physical interfaces are bound to the proxy core (XML output 2) or that Proxy core is stopped by the system since no proxies are defined (XML output 0).
Admd - The administrative layer.
ADM daemon
The subsystem recording proxy statistics.
Stats daemon
The subsystem handling logging.
The automated learner.
Learner daemon
The subsystem issuing attack alerts via Syslog and email.
Alert daemon
The subsystem which handles cluster synchronization.
Sync daemon
Status code can be INACTIVE indicating that synchronization is not enabled and the Sync daemon therefore is not running.
Daemon checking backend servers.
Health check daemon
3.4. Disk I/O
The Disk I/O section shows disk activity information. Data read from disk per second.
Read
Data written to disk per second.
Write
I/O operations per second.
I/O ops.
3.5. Disk
The disk section shows disk usage information per partition. Log partition.
/log
Content cache partition.
/cache
Access policy partition.
/db
Applications partition.
/wsm
3.6. Read-only monitor access
To view the monitor page directly or using an XML client follow the instructions below.
3.6.1. As HTML
Click the monitor button in the lower button bar on the monitor page. This will open a new window.
3.6.2. XML format
Access the address https://address_of_management_interface:4849/monitor.html?xml using an XML client.
An XML data structure with the values above will be returned. Note however that the units can be different from the HTML output. The XML keys therefore the unit the value is returned in.
4. Traffic
The monitor window provides an overview of configured proxies. The overview includes real time traffic information.
4.1. Interfaces
Displays various interface information parameters. Interface description/name.
Interface
Physical interface status.
Status
Current system IP address for the interface.
System IP
Incoming data.
In data
Outgoing data.
Out data
Incoming packets in packets per second.
In pkts.
Outgoing packets in packets per second.
Out pkts.
4.2. Traffic by website
Total number of requests.
Name
Number of services configured.
Services
Total number of HTTP requests received.
Requests
Total number of HTTP responses sent.
Responses
Total number of responses af type 40x (404 - Not Found, 403 - Forbid-den, etc). Unless denied requests are redirected 40x include denied requests.
40x
Total number of responses af type 50x (502 - Bad gateway, 500 - Internal Server Error, etc). These responses typically indicates that real servers
50x
are not responding withion the real server time out or that they are in error state.
Total data received.
Received
Total data sent.
Sent
Total compression ratio for the proxy.
Compression
Eg. 60% means that the total original data was compressed to the 60% of it's original size.
OK or ERROR.
Status
The mode the proxy is running in.
Mode
Click to manage proxy settings.
Details icon
Click to display traffic information graphs.
1. Websites
The Website menu gives access to all configuration options related to proxy management, ACL administration, security logging and settings.
To manage proxies select Services→Websites in the left menu pane. This will take you to the website overview page.
1.1. Websites list
1.1.1. Defined websites
Displays the list of configured website proxies in the system. The list shows the id, virtual host, real host and current running mode for each configured proxy.
1.1.1.1. Selecting a website proxy for management
To manage a configured proxy simply click on it in the defined proxies list.
1.1.1.2. Changing operating mode
In the list of configured website proxies select the new operating mode in the Mode drop-down box for the website proxy to be changed.
1.2. Adding a website
Path:Services→Websites+Add Website.
1.2.1. Virtual web server
The proxy deployment mode.
Deployment
Drop down list Valid input
Select option from list Default value
Reverse Proxy
For a description of the deployment options please refer to Deployment. Select the web server protocol.
Web server protocol
Drop down list HTTP
Standard non-encrypted HTTP site. HTTPS
SSL/TLS HTTPS website Both
Create e website that responds to both HTTP and HTTPS requests. Note that depending on the deployment architecture "HTTPS" and "Both" may not be available in cloud environments.
The public address of the web server you want to add a proxy for.
Web server domain name
Input field Valid input
A fully qualified domain name Input example
www.mydomain.com Default value
none
The IP address the virtual host is bound to.
Listen IP
Select combo Click Edit list to change the IP address configuration. Valid input
One or more IP addresses in the select list to the left. Default value
The IP address(es) configured when creating the website proxy. The port number the virtual HTTP host is listening to.
HTTP listen port
Input field Valid input
A valid TCP/IP Port number Input example
80
Default value
The port number set for the server when created. The port number the virtual HTTPS host is listening to.
HTTPS listen port
Input field Valid input
A valid TCP/IP Port number Input example
443
Default value
The port number set for the server when created.
1.2.2. Real web servers
HTTP or HTTPS
Real server protocol
Drop down list Valid input
Options from the drop down list
HTTP or HTTPS
Default value
The protocol initially set when the website proxy was created. When enabled Web Security Manager will 1) and 2)
Validate real servers and enable health checking
Check box
1. Verify that the real servers entered respond to requests 2. Enable health checking with an initial simple configuration If one or more of the real servers are not reachable Web Security Man-ager will return an error. To disable real server validation uncheck this option.
Default:<disabled>
Hostname or IP address of the web-server(s) Web Security Manager is proxying requests for.
Real server IP
Input field
Valid input
Fully qualified hostname (FQDN) or IP address. Input example
web1.mycompany.com
10.10.10.10
Default value
<none>
The port number the real server is listening to.
Port
Input Valid input
A valid TCP/IP Port number Default value
80
Define the servers role in the load balancing set.
Role
Drop down list Active
The server is operative and accepts requests. Backup
The server is operative but should only be sent requests if none of the other servers in the load balancing set are available.
Down
The server is nor operative and will not respond to requests.
1.2.3. Default Proxy
When enabled the proxy will be used as the default host for requests for the IP address the proxy is configured to listen to. The default proxy will respond to all requests for virtual hosts that are
not configured as primary host name or as a virtual host for other proxies listening to the same IP address. This way it is possible to configure a single proxy that serves requests for several host-names that are served by the same backend web server without having to add all the virtual host names in WSM.
1.2.4. Initial operating mode
Set the initial operating mode for the website proxy.
Operating modes are sets of configurations defining what violations to block and what violations to just log. Two configurable and one non-configurable presets are available.
Protect
The Protect mode preset by default blocks and logs all violations according to the access policy.
Detect
In the default Detect mode preset only logging occurs and no blocking protection is activated. Blocking protection that would occur in Protect is logged and available for review in the deny log. Operating in the default Detect preset is comparable to an intrusion detection system - it detects and logs activities but does not protect or prevent policy violations.'
Pass
In Pass mode all requests are passed through the website proxy. No requests are blocked and no logging is performed. As no filters are active in Pass mode this mode is not configurable. By default Detect mode is selected.
Note
Initial operating mode selection is only available in WAF licenses. For load balancer licenses the operating mode is Pass.
1.2.5. Removing a proxy
In the website overview, click on the trashcan symbol shown to the right of the website proxy you want to remove.
1.3. Global
Global HTTP settings that affect all websites.
Note
Settings like HTTP Throttling that work on the client IP are only effective when WSM is terminating the original request as received from the Internet. When WSM is deployed behind a Layer 7 device that hides the client IP at the network layer these settings should not be enabled.
1.3.1. Server ID
The server ID is the name of the server that will be sent in the response header "Server", also called the server banner. It is considered good practise to hide, mask or alter the server banner. The server id can be set for each website proxy or globally for all websites.
Enable / disable to enforce the global server id for all websites.
Enforce server id for all website proxies
Check box
Default:<disabled>
The global server ID.
Server ID
Input field An empty string will completely remove the server ID (prevent sending the Server header).
Valid input
alphanumeric, space, dash, slash, underscore, period and paren-theses
Default value
<empty>
1.3.2. HTTP request throttling
HTTP request throttling tracks client request rate across all websites and enforces configured limits.
Enable / disable HTTP request throttling for all websites.
Enable client HTTP request throttling
Check box
Default:<disabled>
1.3.2.1. Max HTTP request rate throttling zones
Client request rate is tracked across website proxies using four global databases, throttling zones. To account for different usage patterns throttling limits are defined separately for each global throttling zone.
Each zone defines a maximum request rate in seconds.
Zone T1, T2, T3 and T4
Input field
If for instance a website proxy is assigned Zone T3 client requests to that site will be throttled down to a maximum of 5 req/sec per IP. As the aim of throttling client requests typically is to prevent clients from consuming excessive system resources request throttling cannot is en-abled on a global basis and client requests are tracked and throttled across all websites. This means that in the above example client requests are tracked across all website proxies and that the Zone T3 limits en-forced for other websites using Zone T3.
By default Zone T1 is selected for all sites. Unit
Requests / second Valid input
Number in the range 0 - 1000000 Default value
1.3.2.2. Web site settings
How many requests the client is allowed to exceed the allowed request rate with.
Maximum burst rate
Input field
If for instance the maximum burst rate is set to 20 and the request rate is limited to 5 request per second then the client may issue 20 requests for one second but will then have to wait 4 seconds until the rate is bal-anced.
When a client for instance loads an html page it typically results in a lot of sub-requests for graphic elements, style sheets, javascript, etc. Setting a reasonable burst rate will allow for fast page loads when the request rate is limited.
Unit
requests / second Valid input
Number in the range 0 - 1000000 Default value
20
How to handle clients exceeding limits.
Throttling action
Drop down list Delay
Slow down the client by delaying responses Default selection
Error 503
Return HTTP error 503
Client request rate is tracked across website proxies using four global databases, throttling zones. To account for different usage patterns throttling limits are defined separately for each global throttling zone.
Throttling zone
Drop down list
The global website settings can either be default settings when a website is created or enforced settings for all websites.
Precedence
Drop down list
Default web site settings
When creating a website the settings will default to the global website settings.
Enforced for all websites
The global website settings will be enforced for all websites overrul-ing settoverrul-ings defined in website proxies.
1.3.3. HTTP connection limiting
HTTP connection limiting tracks client connection concurrency across all websites and enforces configured limits.
Enable / disable connection limiting for all websites.
Enable client HTTP connection limiting
Check box
Default:<disabled>
1.3.3.1. Max HTTP connections limiting zones
Client connection concurrency is tracked across website proxies using four global databases, connection limiting zones. To account for different usage patterns connection limits are defined separately for each global limiting zone.
Each zone defines maximum allowed concurrent connections per client IP.
Zone L1, L2, L3 and L4
Input field If for instance a website proxy is assigned Zone L1 client IPs are not allowed to establish more than 4 concurrent connections to the website proxy. However as client connections are tracked across all website proxies the limits will also be tracked and enforced for other websites using Zone L1.
Browsers will typically establish up to four concurrent connections when loading a web page, however many clients may access the website from behind the same gateway and this may result in a much higher concur-rency from that IP.
By default Zone L1 is selected for all sites. Unit
Requests / second Valid input
Number in the range 0 - 1000000 Default value
L1 = 100, L2 = 20, L3 = 10, L4 = 4
1.3.3.2. Web site settings
Client request rate is tracked across website proxies using four global databases, throttling zones. To account for different usage patterns throttling limits are defined separately for each global throttling zone.
HTTP connection throttling zone
Drop down list
The global website settings can either be default settings when a website is created or enforced settings for all websites.
Precedence
Drop down list
Default web site settings
When creating a website the settings will default to the global website settings.
Enforced for all websites
The global website settings will be enforced for all websites overrul-ing settoverrul-ings defined in website proxies.
1.3.4. SSL Server Name Indication
Allow several HTTPS sites using the same IP address.
If enabled Web Security Manager will allow binding an HTTPS virtual host to an IP address that is already in use by another HTTPS host.
Clients supporting TLS SNI (Server Name Indication) will include the requested hostname in the first message of the SSL handshake (connection setup). This allows the server to determine the correct named virtual host for the request and set the connection up accordingly using the correct vhost SSL certificate from the start. Clients not supporting SNI will not include the requested hostname and will be served the certificate from the first vhost using the shared IP.
The most common browsers support of SNI is: • Mozilla Firefox 2.0 or later
• Opera 8.0 or later (with TLS 1.1 enabled) • Internet Explorer 7.0 or later (not XP) • Google Chrome
• Safari 3.2.1 on Mac OS X 10.5.6
Since there is still a lot of XP based IE users out there it is not recommended to rely on SNI if broad SSL support is required.Create some more virtual IP addresses instead (cluster or virtual IPs.
2. Network
Web Security Manager can block hostile IP addresses at the network level. Addresses can be learned and automatically blocked in four different ways.
1. DoS Mitigation
If DoS Mitigation is enabled source IPs exceeding configurable request limits are automat-ically blocked for a configurable number of seconds (i.e. 86400 - 24 hours).
2. Attack source auto blocking
If Attack source auto blocking is enabled source IPs are tracked across all website deny logs. If a number requests above a certain risk level are recorded within a certain time span the source IP is automatically blocked for a configurable number of seconds.
3. Immediate source blocking.
Each website can be configured to immediately block a source IP if a log event above a certain risk level is recorded.
4. Manual entry
IP addresses can be added manually to the list of blocked source IPs.
Only traffic to inbound interfaces is blocked. Management interfaces are not blocked unless the management role has been bound to an interface which is also responding to inbound requests - typically the interface facing the Internet.
Blocking a source IP does not keep a determined attacker from accessing your website. Positive filtering at the application level, which is the core functionality of Web Security Manager is much better at stopping unauthorized intrusion attempts. It does however make it more difficult, especially if immediate source blocking is enabled as this will force the attacker to change IP every time he triggers an attack signature.
Note
Settings like blacklisting and DoS mitigation controls that work on the client IP are only effective when WSM is terminating the original request as received from the Internet. When WSM is deployed behind a Layer 7 device that hides the client IP at the network layer these settings should not be enabled.
2.1. Blacklisted Source IPs
The table shows which source IPs are currently blocked. Source IP
Source IP
The reason for / type of blocking. Can be:
Violation
DoS
The source IP has triggered the DoS mitigation by issuing too many requests within a too short time span.
Policy
The source IP has either triggered the general attack source auto blocking or a website specific block-IP policy.
Permanent
The source IP has been added to the list manually. Remove IP from the list.
Del
Button
2.2. Network blocking bypass
The table shows IP addresses which are allowed to bypass network protection like blacklisting and DoS mitigation controls.
The IP address which will bypass network controls.
Trusted Client Source IP
Number of incoming packets from the source IP
In packets
Number of incoming bytes from the source IP
In bytes
Number of outgoing packets to the source IP
Out packets
Number of outgoing bytes to the source IP
Out bytes
2.2.1. Allowing an IP address to bypass network controls
The network blocking bypass white list is compiled of1. the website trusted client lists, 2. the website trusted proxies, 3. the default gateway.
Website trusted client lists
IP addresses are added in Services→Websites+Policy→Website global policy+Trusted clients and network blocking bypass for trusted clients has to be checked in Services→ Websites+Policy→Website global policy+IP pass through. In addition network blocking bypass has to be enabled in general (below).
Website trusted proxies
Trusted proxies are added in Services→Websites+ADC→Virtual host+Trusted Proxy. The default gateway
This is enabled by default.
Note that this feature is only available on WAF licenses.
Enable / disable network blocking bypass for trusted clients.
Allow website Trus-ted Client IPs to
by-Default:<disabled>
pass network protec-tion
Check box
Enable / disable network blocking bypass for trusted proxies.
Allow trusted proxy IPs to bypass net-work protection
Check box Default:<disabled>
Enable / disable network blocking bypass for the default gateway.
Allow gateway IP to bypass network pro-tection
Check box
Note that this will not allow requests passing through the default gateway but only requests with the default gateway as source.
Default:<enabled>
2.3. DoS mitigation
When enabled the DoS mitigation system tracks source IP connections to inbound interfaces. If an IP exceeds the configurable limits it is added to the list of blocked IPs and further connection attempts are silently dropped at the network level.
Enable / disable DoS mitigation.
Enable DoS mitiga-tion
Check box
Default:<disabled>
Limit the rate of new connections to a certain amount per time interval.
Max src conn rate
Two input fields: num-ber and seconds.
Valid input
Both fields take an integer as valid input. Input example
50 / 5 - 50 connections in 5 seconds Default value
<60 / 10>
How long time IPs should be blacklisted in seconds.
Blacklist IPs for
Valid input An integer Input example <36000> - 10 hours Default value <86400> - 24 hours
IPs are automatically removed from the list when the blacklist period has ended.
2.4. Attack source Auto blocking
Attack source auto blocking tracks denied source IPs at the application level and blocks an IP at the network level if they reach configurable limits.
Enable / disable Enable Attack Source Auto Blocking.
Enable Attack Source Auto Blocking
Check box
Sets the maximum number of denied requests across all websites within a certain time frame (below).
Attack threshold
Input field
Only websites with source tracking enabled contribute to the attack threshold number and for each website a risk threshold is configured above which denied requests are added to this global counter. Valid input
Any integer Default value
<5>
Sets the time frame within attack threshold (above) is accepted.
Time threshold
Input field Valid input
Any integer Default value
<86400>
How long time IPs trigging the Attack source Auto blocking should be blacklisted in seconds.
Blacklist IPs for
Valid input An integer Input example <86400> - 24 hours Default value <604800> - 1 week
IPs are automatically removed from the list when the blacklist period has ended.
2.5. Network routing
In some network deployments it is desirable to have Web Security Manager perform routing functions by forwarding IP packets not destined for its own IP addresses and to allow these packets to pass between its interfaces. Enabling IP forwarding is a necessary prerequisite when websites are deployed in routing proxy mode.
A segmentation matrix allows for configuring policy rules for forwarding IP packets between network interfaces.
Enable / disable IP forwarding.
Enable IP forwarding
Check box IP forwarding is required when websites are deployed in routing proxy mode.
Enable / disable network segmentation.
Enforce network segmentation when routing
Check box
When enabled network segmentation rules as specified in the segment-ation policy matrix are enforced.
Segmentation has no effect unless IP forwarding is enabled. Default:<enabled>
The network segmentation matrix defines policy rules for traffic to travel across the Web Security Manager network interfaces. Policy rules are
Network segmenta-tion
defined as allow from interfaces in the leftmost column to interfaces in the upper horizontal row.
The segmentation matrix only shows physical interfaces. Cluster (VRRP) interfaces and virtual IP addresses inherit the policy rules applying to the physical interfaces to which they are bound.
Example
If a system has the interfaces em0, em1 and em2, to allow packets to travel from em0 to em1 check the cell em0,em1.
Default value
1. Virtual host
The virtual host is the website proxy that is accepting requests on behalf of the web servers serving the website the ADC is proxying requests for.
1.1. Deployment
Web Security Manager is designed to easily fit into complex data centers without sacrificing the inherent protection advantages of the reverse proxy deployment mode. This is achieved through the deployment options Reverse Proxy and Routing Proxy. Both deployment options offer the full set of WAF features including inspection and rewriting/blocking of outgoing server responses, accelerating, caching and compression.
The two deployment options can be used in combination on the same appliance as the deployment option applies to single websites. In other words the same appliance can at the same time serve websites deployed in Routing Proxy and Reverse Proxy mode.
1.1.1. Reverse Proxy
In reverse proxy the appliance terminates all traffic destined to the website it protects. For HTTP(S) traffic requests are validated and forwarded to the backend web server on behalf of the client. A number of IP addresses are assigned to the appliance. The number of IP addresses required depends on how many SSL websites are served and on which type of SSL certificates are used. As a rule of thumb one unique IP address is required for each certificate deployed on the appliance. To direct traffic through the reverse proxy either NAT rules or DNS has to be altered to point to the appliance. If it is required that traffic to other (non-http) services can reach the web server from the Internet and separate NAT rules has to be created for the ports serving those services that bypass the appliance.
Reverse proxy completely shields the web server infrastructure and allows for inspection of both client requests and server responses as well as rewriting/insertion of cryptographic tokens allowing for protection against session hijacking, cross site request forgery and similar attacks.
Reverse proxy is easy to implement but a number of extra IP addresses are required and for more complex data centers it may also be undesirable because of the number of changes that are re-quired to the network firewall NAT rules.
1.1.2. Routing Proxy
Routing proxy deployment has all the advantages of reverse proxy both in terms of protection, acceleration, caching and compression. In fact, there are no features that available for reverse proxy that are not also available in routing proxy deployment.
The major difference is that routing proxy deployment does not require more than one IP address for each of the Web Security Manager appliances network interfaces and the only change necessary on the network firewall (or router) is to configure it to route traffic to the protected web servers through Web Security Manager. Web traffic to the protected servers will be picked up and validated while traffic to other protocols like SSH, SMTP and FTP is routed through to the backend web servers.
The ability to route traffic to other services also means that it is only the HTTP services on the backend web servers that are protected by the appliance but small footprint in terms of IP addresses and network firewall policy rules makes it an attractive deployment option for complex data centers.
1.2. Virtual web server
Protocol and Fully qualified domain name (FQDN) for the website the proxy is configured for.
Web server
Read only
Controls if the website is served by the Web Security Manager node.
Website status
Drop down list Enabled
The Web Security Manager node serves requests to the website. Disabled
Requests to the website are served with a default 404 not found error message.
The name of the website proxy when listed in overview tables and re-ports. Proxy name Input field Valid input An alphanumeric string. Default value
The first part of the virtual host address - ie. if the host address is intranet.domain.tld, the proxy name defaults to "intranet".
The proxy deployment mode.
Deployment
Drop down list Valid input
Select deployment mode from list Default value
Reverse Proxy
For a description of the deployment options please refer to Deployment. The IP address the virtual host is bound to.
Listen IP
Select combo Click Edit list to change the IP address configuration. Valid input
One or more IP addresses in the select list to the left. Default value
The IP address(es) configured when creating the website proxy. The port number the virtual HTTP host is listening to.
HTTP listen port
Input field Valid input
A valid TCP/IP Port number Input example
Default value
The port number set for the server when created. The port number the virtual HTTPS host is listening to.
HTTPS listen port
Input field Valid input
A valid TCP/IP Port number Input example
443
Default value
The port number set for the server when created. Click to update or add SSL server certificate.
Update certificates
Button See Section 1.3, “SSL Certificate” for details.
1.3. SSL Certificate
In the SSL certificate section the current SSL certificate in use is displayed. To upload a new cer-tificate click the Manage certificates button.
The SSL section is only shown for SSL enabled website proxies.
1.3.1. Importing the SSL certificate
To import a certificate go to Web Firewall→Websites→Settings→Servers. In the section Virtual web server select Update certificates.
Depending on the format of the certificate select the appropriate action in the bullet list.
1.3.1.1. Importing the PKCS12 format
If the certicifate is in the PKCS12 format follow the guidelines below: 1. Enter the path to the certificate file in the PKCS12 file input field. 2. Enter Passphrase in the Passphrase input field.
3. Click Save settings in the lower button pane.
1.3.1.2. Importing the PEM format
If the certificate is in the PEM format follow the guidelines below:
1. Open the .PEM file in a text-editor. Copy the public certificate section of the certificate. The public key/certificate is the section of the certificate file between (and including) the certificate start and end tags. Example:
---BEGIN Certificate characters ---END CERTIFICATE---
2. Select Import SSL certificate In the Web Security Manager management interface Paste the SSL public key/certificate into the SSL-certificate field.
3. Now copy the (SSL) private key section of the certificate. The (SSL) private key is the section of the certificate file between (and including) the private key start and end tags. Example:
---BEGIN RSA PRIVATE Private key characters ---END RSA PRIVATE
KEY---4. Enter the passphrase for the private key in the passphrase field (if the original private key was encrypted).
5. If a certificate authority chain is provided with your certificate enter the entire list of certificates (more than one certificate may be provided) in the SSL authority certificate(s) chain field
1.3.2. Exporting certificate from web server
When creating a proxy for an existing HTTPS web server you need to move the SSL-certificate from the web server to Web Security Manager. This is done by exporting the SSL-certificate from the web server and importing it into Web Security Manager.
Web Security Manager supports importing of PKCS12 and PEM encoded server certificates. To export a certificate from the web server please refer to the vendors guidelines:
Microsoft
Microsoft guidelines can be found on these addresses: IIS 5.0
How to back up a server certificate in Internet Information Services 5.0
IIS 6.0
Exporting a Client Certificate for One-to-One Mapping
Export the certificate to a .PFX file (default) which is PKCS12 encoded.
Apache
For web servers running Apache:
1. Obtain the SSL-certificate file from the web servers file system. By default the file is PEM-encoded.
1.4. Virtual host aliases
To configure Web Security Manager to handle requests for host aliases to the proxied domain name (e.g. www.mydomain.com) add a list of aliases in this section.
For instance if the web system answering requests to www.mydomain.com also serves requests to mydomain.com, www.mydomain.net and mydomain.net with the same content of www.mydomain.com,
the alias domain names, when added in this section, will be proxied by Web Security Manager as aliases to the "main" virtual host.
A list of host names.
Virtual host aliases
Input area Valid input