MPRA
Munich Personal RePEc Archive
Credit risk tools: an overview
Francesco Paolo Esposito
10. December 2010
Online at
http://mpra.ub.uni-muenchen.de/28045/
Credit Risk Tools: an overview
Francesco P. Esposito
∗10/12/2010
Abstract
This document presents several Credit Risk tools which have been de-veloped for the Credit Derivatives Risk Management. The models used in this context are suitable for the pricing, sensitivity/scenario analysis and the derivation of risk measures for plain vanilla credit default swaps (CDS), standardized and bespoke collateralized debt obligations (CDO) and, in general, for any credit risk exposed A/L portfolio.
In this brief work we compute the market implied probability of default (PD) from market spreads and the theoretical CDS spreads from histor-ical default frequencies. The loss given default (LGD) probability distri-bution has been constructed for a large pool portfolio of credit obligations exploiting a single-factor gaussian copula with a direct convolution algo-rithm computed at several default correlation parameters. Theoretical CDO tranche prices have been calculated. We nally design stochastic cash-ow stream model simulations to test fair pricing, compute credit value at risk (CV@R) and to evaluate the one year total future potential exposure (FPE) and derive the value at risk (V@R) for a CDO equity tranche exposure.
Keywords: interest rate swap, spot rate term structure, credit default swap, probability of default, copula function, direct convolution, loss given default, collateralized debt obligation, exposure at default, stochastic cash-ow stream model, value at risk, credit value at risk, future potential exposure, Monte Carlo simulation.
∗The author has many years of experience in Risk Management for several asset
manage-ment companies. Recently he has been aliated with the School of Electronics and Computer Science at the University of Southampton (UK). Current aliation: INRA, Jouy-en-Josas, Paris (FR). Personal email address: [email protected]
1 Introduction
This brief note presents several applications of credit risk tools developed for the credit derivatives risk management.
The main ingredients are the PD of each single credit-risk bearing exposure, whose hazard rate are estimated with two dierent methods, and the LGD prob-ability distribution which is constructed via a direct method of calculation. The derivatives considered here synthetically embody the net exposures for dier-ent credit operations between two or more counter-parties. The CDS spread represents the fair payment for the stripped risk held by the creditor on a sin-gle counter-party's obligation which pays a libor plus cash ow up to maturity. The risk-neutral spread and/or upfront paid on a CDO tranche is the expected present value of the capital loss stood by the tier x capital layer of a nancial entity whose asset side is composed by a pool of credits.
The main risk components can be suitably adapted to the internal rating-based approach (IRB) to credit risk in order to include specic methods of estimation of the PD term structure, the LGD distribution and the EAD computation. Because of their structure and purposes, at the cost of light modications, the credit derivative algorithms developed so far can be exploited for the evaluation of the credit valuation adjustment (CVA) and the estimation of the Economic Capital for any credit risk exposed A/L portfolio.
The structure of each section is very concise and the formulas presented in this work certainly imply broader specications which have been kept aside to leave the treatment uent and bring the focus on the results. The organization of this work is as follows. Section 2 presents the main risk components, i.e. the market credit spreads and PD; an algorithm for switching from one to another is depicted. Section 3 expands the risk components with the development of the LGD distribution function and presenting the pricing function for a generic col-lateralized debt obligation. Section 4 incorporates previously developed credit risk tools to provide fairly general credit risk measures, which are the credit adjusted V@R and the FPE distribution.
2 CDS Spreads and Probability of Default
In this section an algorithm for estimating the PD from market spreads is pre-sented. On the other hand, given a PD term structure or a hazard rate function, theoretical CDS spreads can be calculated.
Assuming non-stochastic recovery rateRand continuous compounding regime,
the fair-valuation CDS spread on maturityT is thesT such that
sT Z T 0 dτ BτPτ= (1−R) ( 1−P0− Z T 0 dPτBτ ) (1) Where Pτ is the survival probability function (P Dτ = 1−Pτ) and Bτ is
the discounting factor at tenor τ implied in the term structure of the interest
rate swaps. The pricing formula (1) states that the expected present value of the total cash-ow stream equals the expected present loss for the derivative exposure, i.e. the exposure at default until the maturity of the swap contract. In order to estimate the market implied default probabilities from the set of market credit default swaps
sTj, j= 1, .., n at current time 0, a procedure of
forward induction pivoting on (1) has been constructed.
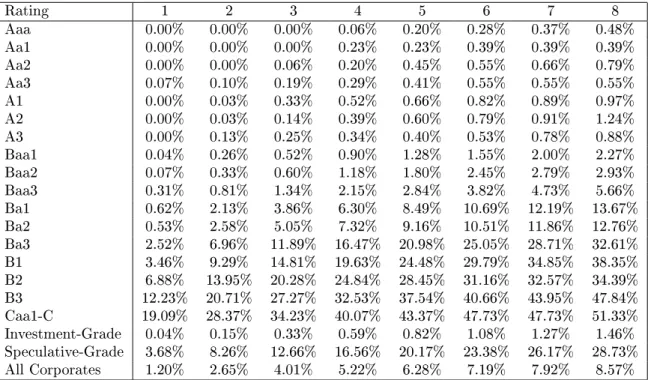
The gure 1 shows the market CDS spreads available on 22/06/2006 which have been interpolated at ISDA compliant cash-ow dates. The sample is provided by the Mark-it price data for the CDX.NA.HY series 6 index excluding two items, namely the Charter Comms Holdings and the Tembec Industrials, because of their extreme values in the available sample data. The companion gure 2 de-picts the (adjusted) implied default probabilities of the CDS market sample. The table 1 presents the Moody's estimated default frequencies (EDF) within the period 1983-1999. Assuming survival probability functions with constant hazard rate matching the 5 year EDF (g. 3), the equation (1) has been em-ployed to construct implied theoretical CDS spreads term structures for each rating class on 03/12/2010 (g. 4).
3 LGD distribution and CDO tranche pricing
In this section we present the algorithm for the estimation of the LGD distri-bution. Assuming a latent factors default correlation structure, the probability distribution function of the LGD of a credit basket portfolio can be computed as the convolution of the conditional PD of each single exposure weighted with the probability structure of the latent factors. Synthetically:
LGD(x) = Z
dP(m){g1(x1|m)? . . . ? gn(xn|m)} (2)
wheregj(xj|m)is the (conditional) PD of the jth asset. Thegj have been
constructed by mapping a gaussian copula onto the estimated credit event prob-abilities.
In the gure 5 we compute the LGD distribution for a large pool portfolio of credits ranging from Aaa to Caa1-C with equal weights on 03/12/2010 along a ve year horizon terminating on 20/12/2015.
Assuming continuous compounding regime, the fair-valuation CDO trancheA
upfront payment plus spread are theuandssuch that u+s Z T 0 dτ Bτ 1−ELτA F0 =EL0A F0 + Z T 0 BτdELτA F0 (3) TheE[·|F0]is the expectation operator conditional on the information set
available at current time. The symbolLA
τ indicates theτ horizon LGD of the
layerAnotional capital invested in the SPV.
Again, the pricing formula (3) states that the expected present value of the total cash-ow stream equals the expected present loss for the derivative exposure, i.e. the exposure at default until the maturity of the swap contract. In gure 6 theoretical full upfront prices at dierent levels of correlation have been com-puted for the rst two tranches, the 0−4% and the 4−8% notional layers,
for a theoretical basket portfolioQcontaining 90 equally weighted names
rang-ing between Aaa and Baa2 Moody's ratrang-ing buckets and constant recovery rate
R= 40%. The valuation has been performed with respect to the reference date
03/12/2010 and maturity 20/12/2013. The price are expressed in percentage units of the unitary tranche.
4 CV@R and Future Potential Exposure
In order to evaluate the correct CDO pricing on a stochastic basis, we have de-signed and implemented a cash-ow stream model simulation. The basic model components consist in the mapping of the complete portfolio ow of payments and the measurement of the balance sheet consistences during time evolution. The received/paid cash amounts are accumulated/deducted from a synthetic in-terest rate generating cash account which can run negative. Stochastic default times τ(ω) are generated via single-factor gaussian copula random numbers
mapped onto the prescribed PD. Every random time for each generated cash-ow history sample terminates the corresponding residual cash-cash-ow stream if it happens before maturity. The gure 7 shows the theoretical (bars) and simu-lated (crosses) frequencies of the number of defaults generated for the sample basketQ with 0.3 default correlation along the 3 years time horizon running
from the settlement date 03/12/2010 to the maturity date 20/12/2013. Because of the high exibility of their structure, Monte Carlo simulations are suitable to allow the user to investigate important characteristics of complex stochastic systems. Indeed, the system which has been just designed can achieve the estimation of several important measures for the credit risk management.
According to (3) the expected present value of a CDO tranche must match the expected present loss, i.e. 22.25%. In economic terms this means that if at time 0 the CDO value is paid into the synthetic cash account, its forward expected value would be zero. The rst simulation of this work is run under the described framework plus uniform stochastic recovery centered atR= 40%.
The investor is assumed to have sold protection on the0−4% equity tranche
on the basket of credits Q. The full upfront paid by the protection buyer is
poured into the cash account on time 0. As it was expected, the average ter-minal cash value is not signicantly dierent from zero. The gure (8) shows the histogram details of the CDO tranche terminal value at maturity, excluding the 0 defaults sub-sample. The tranche consists in the0−4%(40e notional
and 8.9e upfront) of the basketQ worth 1,000e notional. The sample
tri-als which incur 0 defaults terminate at +9.2e with an empirical frequency of 49.3%. The gure (8) presents the remaining 50.7% of the sample forward val-ues which concentrate in the neighborhoods of the portfolios corresponding to each of the sustainable 6 default events. The simulation output consists in the portfolio forward exposure at default. Finally the Monte Carlo study allows us to compute the Credit Value at Risk (CV@R) of the portfolio at any probability level, which specically has been calculated at 5% and 10% probability over the time horizon of 3 years.
The sought values are CV@R(5%, 3y)=-31.66e and CV@R(10%, 3y)=-18.86e. The system which has just been described can be easily modied to study the balance-sheet evolution of a nancial entity which invests into libor plus paying obligors and redistributes the revenues between obligees with dierent seniorities. This program can be regarded as a fully funded cash-ow CDO, with a prescribed cascade redemption scheme. The results of this simulation have not been reported by this work.
The last Monte Carlo study, combines together the features of the previously illustrated credit risk tools with a market risk estimation ability in order to pro-vide an instrument capable of deriving measures of the total future potential exposure (FPE) and the V@R of a portfolio of credit derivatives.
With the term Future Potential Exposure we mean here the probability distri-bution of the exposure to a nancial obligation evaluated at a future instant in time. By the term exposure is intended the market value or replacement cost of the obligation plus the total P/L to date.
Building up on the previous simulation, the total cash-ow stream of the un-funded synthetic portfolio is evaluated at 1 year since settlement, immediately after the ISDA payment date, i.e. on 21/12/2011, when the tranche is assumed to be unwond purchasing an equivalent protection on the residual tranche. Regarding the simulated dynamics, although the model assumptions are quite restrictive, the understanding of the structure of the stochastic system and the sensitivity/scenario analysis can provide great insight for the sake of timely and eective risk capital allocation and risk management. The market factors which determines the CDO tranche prices are the CDS spreads and the
de-fault correlations, which are a direct expression of the credit conditions of the nancial markets. In this study the credit conditions remain unchanged dur-ing the 1 year simulation, while at the evaluation time the markets spreads are uniformly shocked by a multiplicative stochastic factor that has a 10% yearly volatility. The default correlation parameter (0.3) remains unchanged. In order to drastically reduce the computational time, another assumption is taken. The manners in which 6 items can be drawn from a 90 items pool is about 670 mil-lions, therefore only two hypothesis are investigated: the rst one, when defaults are assumed to happen from the least likely forward and the second one, when defaults are assumed to happen from the most likely backward, respectively, providing the highest and lowest prices. The number of defaults that happen on the evaluation date conform to the expected frequencies. Actually, consider-ing the low spread levels at the shortest maturities and the relatively small time horizon, the simulated market price distribution for the pool components under the two scenarios are not signicantly dierent. Hence, we take into account only the conservative hypothesis.
In gure 9 the unwinding price frequency distribution of the equity tranche of theQbasket on 21/12/2011. In the nal gure (10) the future potential total
exposure of the equity tranche under the simulation dynamics. We have esti-mated the forward V@R measures, comprehensive of the credit and market risk embedded into the derivative exposure.
Figure 1: Market-it spreads on 22/06/2006 of the CDX.NA.HY series 6 basket components.
Figure 2: Implied probability of defaults of the Market-it spreads on 22/06/2006 of the CDX.NA.HY series 6 basket components.
Figure 3: PD with constant hazard rate matching the 5 years PD of the Moody's credit ratings from Aaa to Caa1-C
Figure 4: PD implied theoretical spreads. The PD are obtained constructing constant hazard rate survival probability functions matching the 5 years PD of
Figure 5: Loss given default distribution function for an equally weighted 1400 items basket (Aaa to Caa1-C) at dierent levels of correlations. The LGD is evalued over the 5 year period 03/12/2010 to 20/12/2015.
Figure 6: Full upfront CDO tranche prices at dierent default correlations of the tranches0−4%and 4−8%of the portfolio Q.
Figure 7: Theoretical probabilities (blue bars) and empirical frequencies (red crosses) of the number of defaults of the portfolioQon maturity.
Figure 8: Detail of the histogram of the forward value of the 0−4% equity
sub-Figure 9: Histogram of the simulated market prices (full upfront) of the evolu-tion of the0−4%equity tranche on the portfolioQgenerated on 21/12/2011.
Figure 10: Total FPE of the0−4%equity tranche on the portfolioQgenerated
Rating 1 2 3 4 5 6 7 8 Aaa 0.00% 0.00% 0.00% 0.06% 0.20% 0.28% 0.37% 0.48% Aa1 0.00% 0.00% 0.00% 0.23% 0.23% 0.39% 0.39% 0.39% Aa2 0.00% 0.00% 0.06% 0.20% 0.45% 0.55% 0.66% 0.79% Aa3 0.07% 0.10% 0.19% 0.29% 0.41% 0.55% 0.55% 0.55% A1 0.00% 0.03% 0.33% 0.52% 0.66% 0.82% 0.89% 0.97% A2 0.00% 0.03% 0.14% 0.39% 0.60% 0.79% 0.91% 1.24% A3 0.00% 0.13% 0.25% 0.34% 0.40% 0.53% 0.78% 0.88% Baa1 0.04% 0.26% 0.52% 0.90% 1.28% 1.55% 2.00% 2.27% Baa2 0.07% 0.33% 0.60% 1.18% 1.80% 2.45% 2.79% 2.93% Baa3 0.31% 0.81% 1.34% 2.15% 2.84% 3.82% 4.73% 5.66% Ba1 0.62% 2.13% 3.86% 6.30% 8.49% 10.69% 12.19% 13.67% Ba2 0.53% 2.58% 5.05% 7.32% 9.16% 10.51% 11.86% 12.76% Ba3 2.52% 6.96% 11.89% 16.47% 20.98% 25.05% 28.71% 32.61% B1 3.46% 9.29% 14.81% 19.63% 24.48% 29.79% 34.85% 38.35% B2 6.88% 13.95% 20.28% 24.84% 28.45% 31.16% 32.57% 34.39% B3 12.23% 20.71% 27.27% 32.53% 37.54% 40.66% 43.95% 47.84% Caa1-C 19.09% 28.37% 34.23% 40.07% 43.37% 47.73% 47.73% 51.33% Investment-Grade 0.04% 0.15% 0.33% 0.59% 0.82% 1.08% 1.27% 1.46% Speculative-Grade 3.68% 8.26% 12.66% 16.56% 20.17% 23.38% 26.17% 28.73% All Corporates 1.20% 2.65% 4.01% 5.22% 6.28% 7.19% 7.92% 8.57%