A Software System for Spatial Data Analysis and Modeling
*Aleksandar Lazarevic
1, Tim Fiez
2and Zoran Obradovic
1 1School of Electrical Engineering and Computer Science
2
Department of Crop and Soil Sciences
Washington State University, Pullman, WA 99164, USA
[email protected], [email protected], [email protected]
* Partial support by the INEEL University Research Consortium project No. C94-175936 to
T. Fiez and Z. Obradovic is gratefully acknowledged.
The corresponding author is Z. Obradovic, phone: +509-335-66-1, fax: +509-335-3818.
Abstract
Advances in geographical information systems (GIS) and supporting data collection technology has resulted in the rapid collection of a huge amount of spatial data. However, known data mining techniques are unable to fully extract knowledge from high dimensional data in large spatial databases, while data analysis in typical knowledge discovery software is limited to non-spatial data. Therefore, the aim of the software system for spatial data analysis and modeling (SDAM) presented in this article was to provide flexible machine learning tools for supporting an interactive knowledge discovery process in large centralized or distributed spatial databases. SDAM offers an integrated tool for rapid software development for data analysis professionals as well as systematic experimentation by spatial domain experts without prior training in machine learning or statistics. When the data are physically dispersed over multiple geographic locations, the SDAM system allows data analysis and modeling operations to be conducted at distributed sites by exchanging control and knowledge rather than raw data through slow network connections.
1. Introduction
In recent years, the contemporary data mining community has developed a plethora of algorithms and methods used for different tasks in knowledge discovery within large databases. Yet few are publicly available, and a researcher who wishes to compare a new algorithm with existing algorithms, or analyze real data, finds the task daunting. Furthermore, as algorithms become more complex, and as hybrid algorithms combining several approaches are suggested, the task of implementing such
algorithms from scratch becomes increasingly time consuming.
It is also known that there is no universally best data mining algorithm across all application domains. To increase the robustness of data mining systems, one can use an integrated data mining architecture to apply different kinds of algorithms and/or hybrid methods to a given data set. The most common are toolbox architectures where several algorithms are collected into a package, from which the most suitable algorithm for the target problem is somehow chosen. An example is the Machine Learning Library (MLC++) [1], which is designed to provide researchers with a wide variety of tools that can accelerate algorithm development, increase software reliability, provide comparisons, and display information visually. This is achieved through a library of C++ classes and functions implementing the most common algorithms. In addition, the array of tools provided by MLC++ gives the user a good starting basis for implementing new algorithms. Another example, Clementine [2], is an integrated tool that implements data mining algorithms of two knowledge discovery paradigms, namely rule induction and neural networks. It is designed to enable non-specialists to extract valuable information from their historical data. With respect to rule induction, Clementine includes two decision-tree building algorithms. One is based on ID3 [3] extended to predict continuous goal attributes so the algorithm can perform regression as well as classification tasks. The another one is the well-known C4.5 algorithm [4]. With respect to neural networks, Clementine includes the back-propagation algorithm [5], extended with a “pruning” method mainly for classification tasks and a Kohonen network [6] for clustering tasks.
Advances in spatial databases have allowed for the collection of huge amounts of data in various GIS applications ranging from remote sensing and satellite
telemetry systems, to computer cartography and environmental planning. A subfield of data mining that deals with the extraction of implicit knowledge and spatial relationships not explicitly stored in spatial databases is called spatial data mining. However, it appears that no GIS system with significant spatial data mining functionality is currently available. There has been some spatial data mining software development, but most systems are primarily based on minor modifications of the previous non-spatial data mining systems. The GeoMiner system [7] is a spatial extension of the relational data mining system DBMiner [8], which has been developed for interactive mining of multiple-level knowledge in large relational databases and data warehouses. The DBMiner system implements a wide spectrum of data mining functions, including characterization, comparison, association, classification, prediction and clustering. By incorporating several interesting data mining techniques, including OLAP (On-line Analytical Processing) and attribute-oriented induction, the system provides a user-friendly, interactive data mining environment with good performance. GeoMiner uses the SAND (Spatial and Nonspatial Data) architecture for the modeling of spatial databases and includes the spatial data cube construction module, spatial on-line analytical processing (OLAP) module, and spatial data mining modules. Another effort in spatial data mining software is a S-PLUS interface for ArcView GIS [9]. This software package provides tools for analyzing specific classes of spatial data (e.g. geostatistical data, lattice data, spatial point patterns). However, since S-PLUS is an interpreted language, functions written in this package seem to be much slower than their equivalents implemented in C and C++, thus limiting the practical applications to fairly small databases.
In addition, different data mining algorithms for spatial data are implemented in different programming environments. To allow end-users to benefit from multiple spatial data mining approaches, there is a need for the development of a software system, which will integrate all implemented methods in a single environment and thus reduce the user’s efforts in planning their management actions.
Precision agriculture is one of the applications which may prosper from novel spatial data mining techniques [10]. Agricultural producers are collecting large amounts of spatial data using global positioning systems to geo-reference sensor readings and sampling locations. It is hoped that these data will result in improved within-field management and lead to greater economic returns and environmental stewardship. However, as it is known, standard data mining methods are insufficient for precision agriculture, because of the spatial dimension of data. Therefore, for precision agriculture and other applications mentioned above, spatial data mining
techniques are necessary in order to successfully perform data analysis and modeling.
Furthermore, precision agriculture data are inherently distributed at multiple farms and cannot be localized on any one machine for a variety of practical reasons including physically dispersed data sets over many different geographic locations, security services and competitive reasons. With the growth of networks this is often seen in other domains. In such situations, it is advantageous to have a distributed data mining system that can learn from large databases located at multiple data sites. The JAM system [11], intended for learning from such databases, is a distributed, scalable and portable agent-based data mining software package that employs a general approach to scaling data mining applications. JAM provides a set of learning programs that compute models from data stored locally at a site, and a set of methods for combining multiple models learned at different sites. However, the JAM software system doesn’t provide any tools for spatial data analysis.
Therefore, our software system attempts to support flexible spatial data mining in centralized or distributed scenarios. In addition to providing an integrated tool for more systematic experimentation to data mining professionals, our project aims to offer an easy-to-use data mining software system for non-technical people, usually experts in their fields but with little knowledge of data analysis and intelligent data mining techniques.
Our main goal was to construct a test environment for both standard and spatial data mining algorithms, that could quickly generate performance statistics (e.g. prediction accuracy), compare various algorithms on multiple data sets, implement hybrid algorithms (e.g. boosting, non-linear regression trees) and graphically display intermediate results, learned structure and final prediction results. To efficiently achieve this goal, we have developed a SDAM (Spatial Data Analysis and Modeling) software system that executes programs developed in different environments (C, C++, MATLAB) through a unified control and a simple Graphical User Interface (GUI).
A detailed description of software organization and architecture is presented in Section 2. Software functionalities are described in Section 3. A summary and discussion of our on-going research is given in Section 4.
2. Software Organization and Architecture
2.1. Software Organization
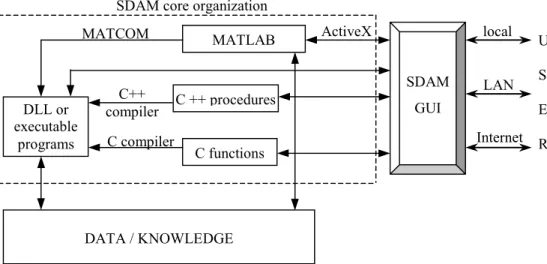
The organization of the SDAM software system, shown in Figure 1, represents an integration of data mining algorithms in different programming environments under a unique GUI.
Figure 1. An organization of SDAM software system under unified GUI The interface allows a user to easily select data mining
algorithms and methods. This interface is implemented using the Visual Development Studio environment. The majority of the algorithms have been developed in the MATLAB programming environment [12], but some of them have been implemented using C and C++. Many of the implemented algorithms represent our research activities in the past few years. Since MATLAB is an interpreter and cannot generate executable code, we used Visual MATCOM software [13] and ActiveX controls to incorporate algorithms developed in MATLAB into our system. This allowed us to fully utilize functions that could be more quickly developed in MATLAB than in a language such as C/C++.
Visual MATCOM software compiles MATLAB functions into corresponding C++ or DLL (Dynamic Link Library) procedures. These C++ procedures as well as original C and C++ implementations of data mining algorithms, were then compiled into executable programs or DLL procedures (see Figure 1) which can be easily invoked from our software system. Thus, the software system avoids running the slow MATLAB interpreter and uses fast DLL procedures. Using different optimization and configuration options, computation speed can be 1.5 to 18 times faster than using MATLAB [13].
Not all MATLAB procedures can be processed through Visual MATCOM. For these procedures, we established an inter-program connection between SDAM and MATLAB using ActiveX controls. This requires that the MATLAB package is available on a machine running our software. Each ActiveX control object supports one or more named interfaces. An interface is a logically related collection of methods, properties and events. Methods are similar to function calls in that they are a request for the object to perform some action. Properties are state
variables maintained by the ActiveX object, and the events are notifications that the control object forwards back to the main application. Therefore, the software system simply creates a MATLAB object, sends a request to it to perform some function and waits for a notification relating to the performed function.
The SDAM software system can be run from a local machine, or remotely through connection software (e.g. VNC [14] in our case) from any machine in a Local Area Network (LAN) or from any Internet connected machine (Figure 1). At the present stage of development only one user at a time can remotely control the SDAM software system on a remote machine. This user can use data from the remote machine and from the user’s local machine (local data). Since the user’s data may be confidential, security services are implemented through the password, which the user must enter at the beginning of a session. A challenge-response password scheme is used to make the initial connection: the server sends a random series of bytes, which are encrypted using the typed in password, and then returned to the server, which checks them against the 'right' answer. After that the data is decrypted and could, in theory, be watched by other malicious users, though it is a bit harder to snoop this kind of session than other standard protocols.
The user can remotely use learning algorithms to build prediction models for each remote data set. These models can be combined later into a new “synthesized” model in order to use the knowledge from all available data sets with the aim of achieving higher prediction accuracy than from using local prediction models built on individual sites.
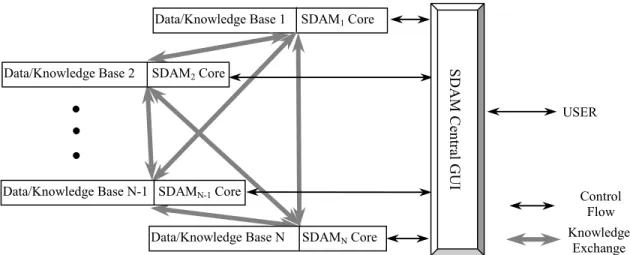
A more advanced distributed SDAM software system includes model and data management over multiple distributed sites under central GUI (Figure 2).
DLL or executable programs MATLAB C ++ procedures C functions SDAM GUI DATA / KNOWLEDGE MATCOM C++ compiler C compiler ActiveX local LAN Internet U S E R SDAM core organization
Figure 2. The organization of the distributed SDAM software system In this scenario, each distributed site has its own local
data, the SDAM package, file transfer and remote connection software. The user is able to perform spatial data mining operations at distributed data sites from the central GUI machine to build local models without moving raw data through slow network connections. The central GUI allows transferring learned models among sites in order to apply them at other locations or to integrate them to achieve better global prediction accuracy. In general, there are several ways for combining predictions by exchanging models. In first approach, each user i, i = 1,…N (Figure 2) uses some learning algorithm on one or more local spatial databases DBi, to produce a
local classifier Ci. Now, all local classifiers can be sent to
a central repository, where these classifiers can be combined into a new global classifier GC using majority or weighted majority principle. This classifier GC is now sent to all the individual users to use it as a possible method for improving local classifiers. Another possibility is that each user i sends to every other user the local classifier Ci. Now, these classifiers Ci can be
combined at local sites using the same methods as before. More complex methods for combining classifiers include boosting over very large distributed spatial data sets. One approach is for each boosting iteration to select a small random sample of data at each distributed site. When it is possible we transfer these data sets to a central repository site to build a global classifier. However, this is not possible or desirable for some applications and is inefficient in general. For real distributed learning over many sites, more sophisticated methods for exchanging boosting parameters among dispersed sites is required [15], and this is one of our current research focuses.
2.2. Software Architecture
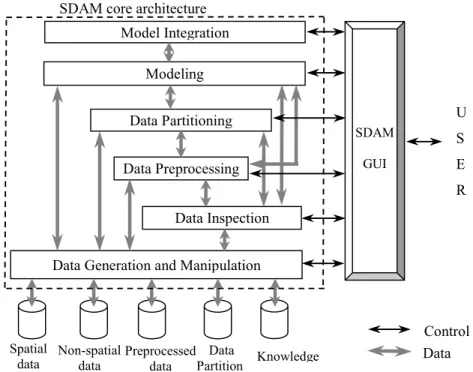
Due to the complex nature of spatial data analysis and modeling, the implemented algorithms are subdivided to six process steps: data generation and manipulation, data inspection, data preprocessing, data partitioning, modeling and model integration (Figure 3). Since not all spatial data analysis steps are necessary in the spatial data mining process, the data flow arrows in Figure 3 show which preprocessing steps can be skipped. The Figure also outlines how the modules are connected among themselves, how they use the original data, and how they manipulate the data with intermediate results and constructed models. An important issue in our software design is an internal file organization to document the results of SDAM processes. Two types of process are documented: pre-modeling and model construction. To save pre-modeling information, the following files are saved:
1) An operation history file, which contains the information about the data file from which the resulting file is constructed, the performed operation, the name with its parameters, and also the eventual resulting parameters of the performed operation.
2) The resulting file containing the data generated by the performed operation
To document the model construction process, two files are saved for every model:
1) A model parameters file with sufficient information for saving or transforming the model to a different site. 2) A model information file contains all information necessary to describe this model to the user.
Data/Knowledge Base 1 SDAM1 Core
USER Control Flow Knowledge Exchange
.
.
.
Data/Knowledge Base 2 SDAM2 Core
Data/Knowledge Base N-1 SDAMN-1 Core
Data/Knowledge Base N SDAMN Core
SDAM Cen
Figure 4. A generation of nitrogen attribute in the spatial data simulator
3. Software Functionalities
The SDAM software system is designed to support the whole knowledge discovery process. Although SDAM
includes numerous functions useful for nonspatial data, the system is intended primarily for spatial data mining, and so in this section we focus on spatial aspects of data analysis and modeling.
Model Integration Modeling Data Partitioning Data Preprocessing
Data Inspection Data Generation and Manipulation
Spatial
data Non-spatialdata Preprocesseddata Data Partition Knowledge Control Data SDAM GUI U S E R
Figure 3. Internal architecture of SDAM software SDAM core architecture
3.1. Data Generation and Manipulation
Loading data from existing real-life spatial databases into the SDAM software requires specifying the database and a list of attributes. In addition, SDAM includes a recently developed spatial data simulator which generates driving attribute layers with spatial properties determined by the user and target layers according to functions specified by the user [16]. The data generator can easily simulate the spatial characteristics of real-life spatial datasets as shown in Figure 4 where an attribute with nitrogen-like statistics from a wheat-field has been generated and its influence on yield variability has been simulated. Thus, a user can evaluate and experiment with SDAM using simulated data sets of desired complexity and size.
The data manipulation module can partition available data randomly into spatially disjoint training, validation and test subsets instead of the random (therefore spatially random) splits common in nonspatial data mining problems (Figure 5). This avoids overestimating true generalization properties of a predictor in an environment where attributes are often highly spatially correlated [17].
Figure 5. Splitting the data into training and test subregions
After the data are loaded the user can apply available algorithms according to a default sequence suggested on the GUI screen or in a user controlled sequence.
3.2. Data Inspection
This module includes several methods for providing basic and spatial statistics on a region and its attributes. The basic statistical information includes first order parameters (mean, variation, etc.) and standard measures like histograms, scatterplots between two attributes, QQ plots (for comparing sample distributions with a normal distribution, as well as for comparing two sample distributions), and correlation among attributes. All
implemented operations use a graphical interface for displaying results in form of charts, plots and tables. The spatial statistical information includes the plot of the region, and the spatial auto-correlation between data points in attribute space shown through 2-D and 3-D perspective figures as well as through different types of variograms and correlograms [18].
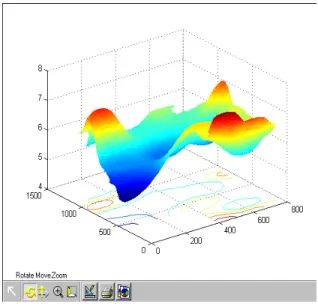
Since our primary concern is related to the spatial characteristics of the region, we provide 2-D and 3-D plots, which visually show how the attributes change through space (Figure 6). Three-dimensional perspective plots including contour lines can be rotated, panned and zoomed in order to observe all relevant surface characteristics of the region.
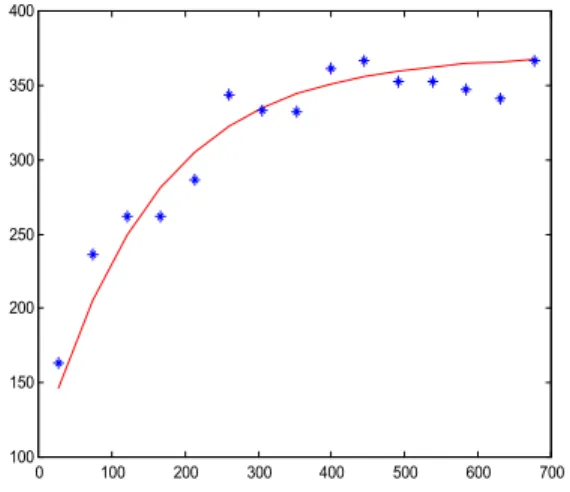
Figure 6. 3D perspective of feature layers The variograms and correlograms are used to characterize the spatial relationship between data points for specified attribute. In variograms, a measure of the dissimilarity between data points for distance h apart is obtained. This is repeated for all pairs of data points that are h distance apart and the average squared difference is obtained. This similarity measure is called g(h). These values are plotted on an x-y plot with the x axis representing the distance h, and the y axis representing g(h) (Figure 7). The software system first plots the estimated variograms obtained from the experimental data, and then fits the theoretic variograms to the estimated ones (Figure 7). The correlograms give the same information as variograms, except in correlograms, a measure of similarity between data points is considered.
3.3. Data Preprocessing
Spatial data sets often contain large amounts of data arranged in multiple layers. These data may contain errors and may not be collected at a common set of coordinates.
Therefore, various data preprocessing steps are often necessary to prepare data for further modeling steps. This module includes the functions shown in Figure 8, which are described in the rest of this section.
Figure 7. Fitting theoretical variograms to experimental data
Data Cleaning and Filtering. Due to the high possibility of measurement noise present in collected data sets, there is a need for data cleaning. Data cleaning consists of removing duplicate data points, and removing value outliers, as well spatial outliers. Data can also be filtered or smoothed by applying a median filter with a window size specified by the user.
Figure 8. Data Preprocessing functions
Data Interpolation. In many real life spatial domain applications, the resolution (data points per area) will vary among data layers and the data will not be collected at a common set of spatial locations. Therefore, it is
necessary to apply an interpolation procedure to the data to change data resolution and to compute values for a common set of locations. Deterministic interpolation techniques such as inverse distance [19] and triangulation [20] can be used but they do not take into account a model of the spatial process, or variograms. Interpolation techniques appropriate for spatial data such as kriging [19] and interpolation using the minimum curvature method [21], are often preferable and are provided in the software system in addition to the regular interpolation techniques mentioned above.
Data Normalization. The SDAM software system supports two normalization methods: the transformation of data to a normal distribution and the scaling of data to a specified range.
Data Discretization. This step is necessary in some modeling techniques (association rules, decision tree learning and all classification problems), and includes different attribute and target splitting criteria.
Generating New Attributes. Users can generate new attributes by applying supported operators to a set of existing attributes.
Feature Selection. In domains with a large number of attributes this step is often beneficial for reducing attribute space by removing irrelevant attributes. Several selection techniques (Forward Selection, Backward Elimination, Branch and Bound) and various criteria (inter-class and probabilistic selection criteria) are supported in order to identify a relevant attribute subset.
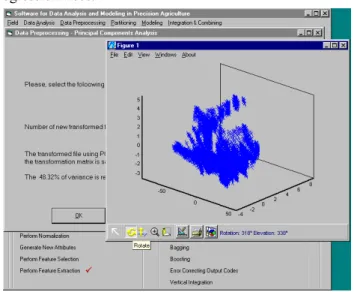
Feature Extraction. In contrast to feature selection where a decision is target-based, variance-based dimensionality reduction through feature extraction is also supported. Here, linear Principal Components Analysis [22] and non-linear dimensionality reduction using 4-layer feedforward neural networks (NN) [23] are employed. The transformed data can be plotted in d-dimensional space (d = 2, 3) and resulting plots can be rotated, panned and zoomed to better view possible data groupings as shown in Figure 9.
3.4. Data Partitioning
Partitioning allows users to split the data set into more homogenous data segments, thus providing better modeling results. In a majority of spatial data mining problems, there are subregions wherein data points have more similar characteristics and more homogenous distributions than in comparison to data points outside these regions. In order to find these regions, SDAM supports data partitioning according to landscape attributes or a target value as well as using a quad tree to split a spatial region along its x and y dimensions into 4 subregions [24] as shown in Figure 10. It also supports k-means-based and distribution-based clustering designed for spatial databases [25] and the use of entropy and
0 100 200 300 400 500 600 700 100 150 200 250 300 350 400
Data Cleaning & Filtering Data Interpolation Data Normalization Data Discretization Generating New Attributes
Feature Selection Feature Extraction Data Preprocessing Module
information gain to partition attribute space by means of regression trees.
Figure 9. GUI to data preprocessing operation PCA
Figure 10. Splitting the region using a quad tree SDAM also supports our recently proposed data partitioning methods for identifying more homogeneous sub-fields based on merging multiple fields to identify a set of spatial clusters using parameters that influence a target attribute but not the target attribute itself. This is followed by fitting target prediction models to each cluster in a training portion of the merged field data and a similarity-based identification of the most appropriate regression model for each test point [26]. The another advanced data partitioning approach in SDAM is based on developing a sequence of local regressors each having a good fit on a particular training data subset, constructing distribution models for identified subsets, and using these to decide which regressor is most appropriate for each test data point [27]. The system also implements our iterative
data partitioning scheme based on an analysis of spatially filtered errors of multiple local regressors and the use of statistical tests for determining if further partitioning is needed for achieving homogeneous regions [28].
3.5. Modeling
This module is used to build models which describe relationships between attributes and target values. For novice users, an automatic configuration of the parameters used in the data mining algorithms is supported. The most appropriate parameters are suggested to the user, according to the data sets and the selected model. More experienced data mining experts may change the proposed configuration parameters and experiment with miscellaneous algorithm settings. It is important to emphasize that the application of prediction methods to spatial data sets requires different partitioning schemes than simple random selection like in standard data mining techniques. Therefore, the learning algorithms use spatial block validation sets during the training process [17]. Modeling problems are divided into classification and regression, as shown in Figure 11.
Figure 11. Modeling algorithms organization The user can select from multiple classification and regression procedures (Fig. 11). For validity verification, the user can test learned prediction models on unseen (test) regions. All prediction results are graphically displayed, as well as the neural network (NN) learning process and the learned structures of NN’s and regression trees. An example of the NN learning process and NN learned architecture is shown in the Figure 12.
3.6. Models Integration
Given different prediction models, several methods for improving their prediction accuracy are implemented through different integration and combining schemes. The most common integration methods including both majority and weighted majority are available in the SDAM software system.
Association Rules k-Nearest Neighbor
Neural Networks
Classification
Linear Regression Models CART Regression Trees Weighted k-Nearest Neighbor
Neural Networks
Regression
Figure 12. The GUI of the SDAM process for Neural Networks learning The more complex bagging method [29] is improved
using spatial block sampling [17]. The boosting algorithm [30] is also modified in order to successfully deal with unstable driving attributes which are common in spatial domains [31].
4. Conclusions and Future Work
This paper introduces a distributed software system for spatial data analysis and modeling in an attempt at providing an integrated software package to researchers and users both in data mining and spatial domain applications. From the perspective of data analysis professionals, numerous spatial data mining algorithms and extensions of non-spatial algorithms are supported under a unified control and a flexible user interface. We have mentioned several problems researchers in data mining currently face when analyzing spatial data, and we believe that the SDAM software system can help address these. On the other side, SDAM methods for spatial data analysis and modeling are available to domain experts for real-life spatial data analysis needed to understand the impact and importance of driving attributes and to predict appropriate management actions.
The most important advantage of the SDAM software system is that it preserves the benefits of an easy to design and use Windows-based Graphical User Interface (GUI), quick programming in MATLAB and fast execution of C and C++ compiled code as appropriate for data mining purposes. Support for the remote control of a centralized SDAM software system through LAN and World Wide Web is useful when data are located at a distant location (e.g. a farm in precision agriculture), while a distributed SDAM allows knowledge integration from data located at multiple sites.
The SDAM software system provides an open interface that is easily extendible to include additional data mining algorithms. Hence, more data mining functionalities will be incrementally added into the system according to our research and development plan. Furthermore, more advanced distributed aspects of the SDAM software system will be further developed. Namely, simultaneous multi-user connections and real time knowledge exchange among learning models in a distributed system are some of our important coming tasks.
Our current experimental and development work on the SDAM system addresses the enhancement of the power and efficiency of the data mining algorithms on very large databases, the discovery of more sophisticated
algorithms for spatial data modeling, and the development of effective and efficient learning algorithms for distributed environments. Nevertheless, we believe that the preliminary SDAM software system described in this article could already be of use to users ranging from data mining professionals and spatial data experts to students in both fields.
5. References
[1] Kohavi, R., Sommerfield D., Dougherty J., “Data Mining using MLC++, a Machine Learning Library in C++”, International Journal of Artificial Intelligence Tools, Vol. 6, No. 4, pp. 537-566, 1997.
[2] Khabaza, T., Shearer, C., "Data Mining with Clementine", IE Colloquium on Knowledge Discovery in
Databases”, Digest No. 1995/021(B), pp. 1/1-1/5.
London, IEE, 1995.
[3] Quinlan, J. R., “Induction of decision trees,” Machine Learning, Vol. 1., pp. 81-106, 1986.
[4] Quinlan, J. R., C4.5: Programs for Machine Learning, The Morgan Kaufmann Series in Machine Learning, Pat Langley Series Editor, 1993.
[5] Werbos, P., Beyond Regression: New Tools for Predicting and Analysis in the Behavioral Sciences, Harvard University, Ph.D. Thesis, 1974. Reprinted by Wiley and Sons, 1995.
[6] Kohonen, T, “The self-organizing map,” Proceedings of the IEEE, 78, pp. 1464-1480, 1990.
[7] Han, J., Koperski, K., Stefanovic, N., “GeoMiner: A System Prototype for Spatial Data Mining”, Proc. 1997 ACM-SIGMOD Int'l Conf. on Management of Data(SIGMOD'97), Tucson, Arizona, May 1997. [8] Han, J., Chiang, J., Chee, S., Chen, J., Chen, Q., Cheng,
S., Gong, W., Kamber, M., Koperski, K., Liu, G., Lu, Y., Stefanovic, N., Winstone, L., Xia, B., Zaiane, O. R., Zhang, S., Zhu, H., “DBMiner: A System for Data Mining in Relational Databases and Data Warehouses”,
Proc. CASCON'97: Meeting of Minds, Toronto, Canada, November 1997.
[9] S-PLUS for ArcView GIS, User’s Guide, MathSoft Inc., Seattle, July 1998.
[10] Hergert, G., Pan, W., Huggins, D., Grove, J., Peck, T., "Adequacy of Current Fertilizer Recommendation for Site-Specific Management", In Pierce F., "The state of Site-Specific Management for Agriculture," American Society for agronomy, Crop Science Society of America, Soil Science Society of America, chapter 13, pp. 283-300, 1997.
[11] Stolfo, S.J., Prodromidis, A.L., Tselepis, S., Lee, W., Fan, D., Chan, P.K., “JAM: Java Agents for Meta-learning over Distributed Databases,” Proc. KDD-97 and AAAI97 Work. on AI Methods in Fraud and Risk Management, 1997.
[12] MATLAB, The Language of Technical Computing, The
MathWorks Inc., January 1998.
[13] MIDEVA, MATCOM & Visual Matcom, User’s Guide,
MathTools Ltd., October 1998.
[14] Richardson, T., Stafford-Fraser, Q., Wood, K. R., Hopper, A., "Virtual Network Computing", IEEE Internet Computing, Vol.2 No.1, pp33-38, Jan/Feb1998. [15] Fan W., Stolfo S. and Zhang J. "The Application of
AdaBoost for Distributed, Scalable and On-line Learning", Proceedings of the Fifth ACM SIGKDD International Conference on Knowledge Discovery and Data Mining, San Diego, California, August 1999. [16] Pokrajac, D., Fiez, T. and Obradovic, Z. “A Spatial Data
Simulator for Agriculture Knowledge Discovery Applications,” in preparation.
[17] Vucetic, S., Fiez, T. and Obradovic, Z. “A Data Partitioning Scheme for Spatial Regression,” Proc. IEEE/INNS Int'l Joint Conf. on Neural Neural Networks, Washington, D.C., July 1999, in press.
[18] Isaaks, E. H. and Srivastava, R. M., An Introduction to Applied Geostatistics, Academic press, London, 1989. [19] Cressie, N. A. C., Statistics for Spatial Data, Revised
edition., John Wiley and Sons, New York, 1993. [20] Lee, D. T., Schachter, B. J., “Two algorithms for
constructing a Delaunay Triangulation,” International Journal of Computer and Information Sciences, Vol. 9, No. 3, pp. 219-242, 1980.
[21] Burrough, P. A., McDonnell, R. A., Principles of Geographical Information Systems, Oxford University Press, 1998.
[22] Fukunaga, K., Introduction to Statistical Pattern Recognition, Academic Press, San Diego, CA, 1990. [23] Bishop, C., Neural Networks for Pattern Recognition,
Oxford University Press, 1995.
[24] Finkel, R., Bentley, J., “Quad trees: A data structure for retrieval on composite keys,” Acta Informatica, Vol. 4, pp. 1-9, 1974.
[25] Ester M., Kriegel H.-P., Sander J., Xu X., “A Density-Based Algorithm for Discovering Clusters in Large Spatial Databases with Noise,” Proc. 2nd Int. Conf. on
Knowledge Discovery and Data Mining (KDD-96), pp.
226-231, Portland, OR, 1996.
[26] Lazarevic, A., Xu, X., Fiez, T. and Obradovic, Z., “Clustering-Regression-Ordering Steps for Knowledge Discovery in Spatial Databases,” Proc. IEEE/INNS Int'l Conf. on Neural Neural Networks, Washington, D.C., July 1999, in press.
[27] Pokrajac, D., Fiez, T., Obradovic, D., Kwek, S. and Obradovic, Z.: “Distribution Comparison for Site-Specific Regression Modeling in Agriculture,'' Proc. IEEE/INNS Int'l Conf. on Neural Networks, Washington, D.C., July 1999, in press.
[28] Vucetic, S., Fiez, T. and Obradovic, Z.” Discovering Homogeneous Regions in Spatial Data Through a Competition,” in preparation.
[29] Breiman, L., “Bagging Predictors,” Machine Learning, Vol. 24, pp. 123-145, 1996.
[30] Freund, Y., Shapire, R. E., “A Decision Theoretic Generalization of On-Line Learning and an Application to Boosting,” Journal of Computer and System Sciences, Vol. 55, pp. 119-139, 1997.
[31] Lazarevic, A., Fiez, T. and Obradovic, Z., “Learning Spatial Functions with Unstable Driving Attributes,” in preparation.
![Figure 12. The GUI of the SDAM process for Neural Networks learning The more complex bagging method [29] is improved](https://thumb-us.123doks.com/thumbv2/123dok_us/9783723.2470102/9.918.122.830.125.571/figure-process-neural-networks-learning-complex-bagging-improved.webp)
