ePub
WU
Institutional Repository
Torsten Hothorn and Achim Zeileis
Generalized Maximally Selected Statistics
Working Paper
Original Citation:
Hothorn, Torsten and Zeileis, Achim (2007) Generalized Maximally Selected Statistics.
Research
Report Series / Department of Statistics and Mathematics, 52.
Department of Statistics and
Mathematics, WU Vienna University of Economics and Business, Vienna.
This version is available at:
http://epub.wu.ac.at/1252/
Available in ePub
WU: April 2007
ePub
WU, the institutional repository of the WU Vienna University of Economics and Business, is
provided by the University Library and the IT-Services. The aim is to enable open access to the
scholarly output of the WU.
Generalized Maximally Selected
Statistics
Torsten Hothorn, Achim Zeileis
Department of Statistics and Mathematics
Wirtschaftsuniversität Wien
Research Report Series
Report 52
April 2007
Generalized Maximally Selected Statistics
Torsten Hothorn
Ludwig-Maximilians-Universit¨at M¨unchenAchim Zeileis
Wirtschaftsuniversit¨at Wien AbstractMaximally selected statistics for the estimation of simple cutpoint models are embedded into a generalized conceptual framework based on conditional inference procedures. This powerful framework contains most of the published procedures in this area as special cases, such as maximally selected χ2 and rank statistics, but also allows for direct construction of new test procedures for less standard test problems. As an application, a novel maximally selected rank statistic is derived from this framework for a censored response partitioned with respect to two ordered categorical covariates and potential interactions. This new test is employed to search for a high-risk group of rectal cancer patients treated with a neo-adjuvant chemoradiotherapy. Moreover, a new efficient algorithm for the evaluation of the asymptotic distribution for a large class of maximally selected statistics is given enabling the fast evaluation of a large number of cutpoints.
Keywords: asymptotic distribution, changepoint, conditional inference, maximally selected statis-tics.
1. Introduction
Dichotomization of variables measured at higher scale levels prior to model building is bad practice (Royston et al. 2006, among many others). It will result in loss of power and sophisticated regression models that adapt itself to the complexity of the regression problem at hand are widely available. However, simple regression models capturing step-shaped relationships between two variables are valuable for the implementation of scientific results into the real world: a one-parameter ‘good–poor’ or ‘high–low’ decision rule is attractive to practitioners because of its simplicity.
Such rules of thumb are frequently used to investigate new predictor variables for patient survival in oncology. Galon et al. (2006) estimate cutpoints for various characteristics of immune cells within colorectal tumor samples, such as type, density or location, with respect to their ability to differentiate between patients with good and poor prognosis. Buccisano et al. (2006) follow a similar approach, obtaining a threshold for residual leukemic cells in acute myeloid leukemia patients. The ability for expression levels of HER2 and co-amplified genes to predict breast cancer survival is investigated by Vinatzeret al. (2005) utilizing maximally selected log-rank statistics. Beyond applications in oncology, the identification of ecological thresholds is of increasing interest (see Huggett 2005), e.g., the estimation of cutpoints for habitat factors discriminating between ecosystems with low and high abundance of certain indicator species (M¨uller and Hothorn 2004). Two questions arise from a statistical point of view. In a first step, we have to make sure that there is some relevant association between response and covariate and in a second step we want to estimate the ‘best’ cutpoint in order to approximate this relationship by a simple model. It is convenient to deal with both problems separately. The first problem needs to be addressed by a formal hypothesis test for the null hypothesis of independence between covariate (to be dichotomized) and response variable. A test with power against shift alternatives, i.e., departures from the null hypothesis where the distribution of the response variable varies between two groups of observations, is of special interest. Once we are able to reject the null hypothesis, we are
2 Generalized Maximally Selected Statistics
interested in the alternative which lead to the rejection, i.e., want to estimate a cutpoint or partition.
The first procedure of this kind, utilizing the maximum over multiple χ2 statistics for 2 ×2
tables, was described byMiller and Siegmund (1982). Lausen and Schumacher(1992) derived an approximation for the asymptotical distribution of maximally selected rank statistics, extending the area of application to continuous and censored response variables. Betensky and Rabinowitz (1999) propose a maximally selectedχ2test for nominal response variables measured atk >2 levels and ordered categorical data (maximally selected Cochran-Armitage test). Finally,Rabinowitz and Betensky(2000) suggested a maximally selected McNemar’s test. Lausen et al.(2004) extended maximally selected rank statistics to more than one covariate.
Based on the ideas underlying these established techniques, we suggest a new generalized class of maximally selected statistics that contains the tests above as special cases but also allows for direct construction of new test procedures for less standard test problems. For evaluating the distribution of the test statistics, a conditional inference approach is adopted by embedding the tests into the theory of permutation tests ofStrasser and Weber (1999). This permits efficient computation of the complete correlation structure of the statistics to be maximized. For statistics derived from cutpoints, the correlations have a special product form which we exploit for evaluation of the conditional asymptotic distribution: A linear-time algorithm is described which enables the fast assessment of a large number of cutpoints and and improves significantly upon approximations for the asymptotic distribution currently in use.
Since no assumptions on the scale level of neither the covariate to be dichotomized nor the response variable are necessary, the class of generalized maximally selected statistics can not only be used to implement already published procedures but also extend the methodology to new areas of application. We do so by constructing a maximally selected log-rank statistic for a censored response partitioned with respect to two ordered categorical covariates and potential interactions. This new test is employed to search for a high-risk group determined by the T and N-category of rectal cancer patients.
2. Binary partitions and two-sample statistics
We are provided with independent and identically distributed observations (Yi,Xi) fori= 1, . . . , n
and are interested in testing the null hypothesis of independence of the response variable Y∈ Y
and and covariate(s)X∈ X
H0:D(Y|X) =D(Y)
against shift alternatives. That is, departures from the null hypothesis where the distribution of the response variable varies between two groups of observations are of special interest. Such binary partitions are defined in advance by psets A1, . . . , Ap partitioning the observations into
two groups based on theXmeasurements only. For ordered covariates X, these sets are typically constructed via cutpoints, i.e.,Aj ={X|X≤ξj}. Here,
gj(X) = I(X∈Aj)
denotes the indicator function partitioning the observations into two groups. Only partitions satisfying a size constraintP
igj(Xi)∈(nε, n−nε) for some fixedε∈(0,0.5) are considered.
The two-sample problem associated with the jth binary partition can be tested using a linear statistic Tj = vec n X i=1 gj(Xi)h(Yi)> ! ∈Rq×1
where h : Y → Rq×1 is an influence function applied to the responses. The function h(Yi) =
Torsten Hothorn and Achim Zeileis 3
a permutation symmetric way, i.e., the value of the function must not depend on the order in which Y1, . . . ,Yn appear. For example, with h being a rank transformation for a continuous
response Y, the linear statistic Tj is the sum of the ranks for observations fromAj, i.e., equals
the Wilcoxon-Mann-Whitney statistic. A joint linear statistic for all binary partitions is
T = (T1, . . . ,Tp) = vec n X i=1 g(Xi)h(Yi)> ! ∈Rpq×1
including allptwo-sample partitions, as defined byg(X) = (g1(X), . . . , gp(X)), simultaneously for
testingH0.
3. Standardization and estimation
To assess the partitions/cutpoints on a common scale, the corresponding statisticsTj are typically
standardized using some location and scale measure. Consequently, inference can be based on the maximally selected absolute standardized statistics and the best separating partition is the one for which the maximum is attained.
For obtaining valid estimates of the mean and covariance ofT, either a parametric model needs to be specified or non-parametric techniques can be employed, such as permutation or re-sampling approaches. Here, we adopt the latter and utilize the permutation test framework established by Strasser and Weber(1999). Thus,Tis standardized via its conditional expectationµ=E(T|S)∈
Rpq×1 and covariance Σ = V(T|S) ∈ Rpq×pq, derived under H0 by conditioning on all possible
permutations S of the responsesY1, . . . ,Yn. Closed-form expressions for µand Σ are available,
seeStrasser and Weber(1999) orHothorn et al.(2006).
The key step for the construction of a maximally selected statistic based on the multivariate linear statisticTis its standardization utilizing the conditional expectationµand the diagonal elements of the covariance matrix Σ: the maximum of the absolute values of the standardized linear statistic is used as test statistic
Tmax = max
|T−µ|
p
diag(Σ).
When the test statistic is large enough to indicate a deviation from the null hypothesis we are interested in determining the partition with largest standardized statistic: the best separating partition Aj? is the one for which the maximum is attained, i.e., for which the absolute value of the standardized statisticTj? equalsTmax.
4. Inference
For testingH0the conditional distribution ofTmax given all permutations of the responses is used
as reference distribution. Ideally, we want to compute the exact conditional distribution but this is only possible in special small sample situations (Boulesteix 2006a,b). Conditional Monte-Carlo methods can be used to approximate the exact conditional distribution rather easily (evaluate the test statisticTmax for randomly shuffled responsesY and compute the proportion of random
permutations whereTmax exceeds the test statistic for the permutation 1, . . . , n).
Moreover, the exact conditional distribution can be approximated by its limiting distribution. Forn→ ∞the distribution of the multivariate linear statistic Ttends to a multivariate normal distribution with meanµand covariance matrix Σ (Strasser and Weber 1999, Theorem 3). Thus, in order to approximateP(Tmax> c) we have to evaluate the probabilityP(max(|Z1|, ...,|Zpq|)> c)
for standard normal random variablesZ1, . . . , Zpq with correlation matrixR= cor(Σ) and some
c > 0. The computation of this probability is possible using Quasi-Monte-Carlo methods (Genz 1992) for moderate dimensions (pq < 100, say) but remains infeasible for higher dimensions.
4 Generalized Maximally Selected Statistics
However, for the most important case of statistics maximally selected over cutpoints induced by an ordered covariate X and an ordered or binary response Y, the distribution of the maximum of standard normal variables can be evaluated numerically by an algorithm with computing time being linear in the number of cutpoints considered as will be shown in the following.
LetAj = (−∞, ξj] withξj < ξk for 1≤j < k≤pdenote the partitioning sets and letq= 1 (i.e.,
ordered or binary response variable). Then, the correlation betweenTj andTk is given by
ρj,k= Σj,k p Σj,jΣk,k = s (n−P igk(Xi))Pigj(Xi) (n−P igj(Xi))Pigk(Xi) .
It follows that the correlation matrix is completely determined by the subdiagonal elements ρj,j−1, j= 2, . . . , pand it holds that
ρ1,k= k
Y
j=2
ρj,j−1.
Withv= (ρ1,1, . . . , ρ1,p) the lower triangular part of the correlation matrixRcan be written as v(1/v)> and it follows (fromMeurant 1992, Section 2.1) that the inverseR−1 of the correlation
matrix is a tridiagonal symmetric band matrix:
R−1= r1,1 r1,2 0 0 . . . 0 r1,2 r2,2 r2,3 0 . . . 0 0 r2,3 r3,3 r3,4 . . . 0 0 0 r3,4 r4,4 . .. 0 .. . ... ... . .. . .. ... 0 0 0 0 rp−1,p−1 rp−1,p 0 0 0 0 rp−1,p rp,p .
We have to evaluate the probability that any of|Z1|, . . . ,|Zp|exceedsc >0, i.e., the probability
P(Tmax> c) = 1− 1 p |R|(2π)p c Z −c exp −1 2z >R−1z dz.
Because of the special band structure ofR−1 the quadratic formz>R−1zsimplifies to
z>R−1z=r1,1z12+ 2r2,1z1z2+r2,2z22+· · ·+ 2rp,p−1zpzp−1+rp,pzp2.
and one can make use of this structure when evaluating the multivariate normal distribution numerically (Genz and Kahaner 1986). Withφ(z) = exp (−z/2) we have
c Z −c φ z>R−1z dz = c Z −c φ(r1,1z21) c Z −c φ(2r2,1z1z2+r2,2z22) c Z −c . . . c Z −c φ(2rp,p−1zpzp−1+rp,pzp2)dz
and with recursively defined functionsfj (j= 2, . . . , p+ 1) with
fj(z) = c
Z
−c
φ 2rj,j−1zz˜+rj,jz˜2fj+1(˜z)d˜z ∀j = 2, . . . , p
andfp+1(z)≡1, the above integral can be re-formulated recursively:
P(Tmax> c) = 1− 1 p |R|(2π)p c Z −c φ z>R−1z dz = 1−p 1 |R|(2π)p c Z −c φ(r1,1z2)f2(z)dz.
Torsten Hothorn and Achim Zeileis 5
This integral can be evaluated numerically in O(p) starting with fp utilizing the techniques
de-scribed byMiwaet al.(2000): For a two-dimensional grid ofz∈[−c, c] and ˜z∈[−c, c] values, the functionfj is evaluated and aggregated over ˜zonly, yielding values offj(z) for a grid ofz values.
These values are then re-used when computingfj−1.
5. Applications and illustration
Maximally selected statistics as described in Section2can be applied to covariatesXand responses
Y measured at arbitrary scales; appropriate influence functionshfor nominal, ordered, numeric, censored and multivariate response variables are given in the sequel (further details can be found in Hothornet al.2006), followed by a description of how to partition the covariate space for nominal, ordered and multivariate covariates and the derivation of a novel maximally selected statistic. For nominal responses,his typically a straightforward dummy coding of thekfactor levels (where it is sufficient to code for the first k−1 levels only). For ordinal responses, scores are usually attached to each of the k levels and h is the vector of those numeric scores. Many possible influence functions are available for discrete or continuous covariates: The identity transformation is the most natural choice; square root, log, or rank transformations are possible as well. When a numeric response is censored, the log-rank transformation or Savage scores can be applied. For a multivariate response, possibly consisting of variables with different scale levels, the influence function his a combination of influence functions appropriate for any of the univariate response variables as suggested above. In the presence of a grouping of the observations into independent blocks, only permutations within blocks are eligible and the conditional expectation and covariance matrix need to be computed separately for each block. Therefore, it is easily possible to take a block randomization scheme in a randomized clinical trial into account.
The most important situation of a univariate and at least ordinally measured covariateX leads to partitions, and thus functionsgj, induced by cutpoints defined by the realizationsX1, . . . ,Xn.
More specifically, Aj = (−∞, ξj], where ξj is the jth element of the increasingly sorted unique
realizations of X(the sample size constraints apply, of course). Thus, having identified the best separating partition Aj?, the estimated cutpoint is ξj?. For nominal covariates, all 2k−1 binary partitions of theklevels that meet the sample size constraints are taken into account. For multiple covariates, we simply look at all binary partitions induced by all covariates simultaneously. This flexible framework can know be utilized to implement the conditional versions of already published maximally selected statistics and to develop new maximally selected statistics for other applications. For binary responses and ordered covariates, the statistic Tmax is equivalent to a
maximally selectedχ2 statistic (Miller and Siegmund 1982;Koziol 1991). For nominal responses
withk >2 levels, theTmaxstatistic is the maximum over the maximum of standardizedk×2 tables,
an alternative to maximally selectedχ2statistics for larger tables (Betensky and Rabinowitz 1999).
For equidistant scores 1, . . . , kattached to an ordered response, the statisticTmax is equivalent to
a maximally selected Cochran-Armitage statistic (Betensky and Rabinowitz 1999), however, no restrictions to the choice of scores apply here. For numeric or censored responses,Tmaxcorresponds
to maximally selected rank statistics (Lausen and Schumacher 1992). In the extreme case of each observation being a block in repeated measurements, our test statisticTmax for binary responses
corresponds to maximally selected McNemar’s statistics (Rabinowitz and Betensky 2000). The special case of maximally selected rank statistics for multiple covariates has first been studied by Lausenet al.(2004).
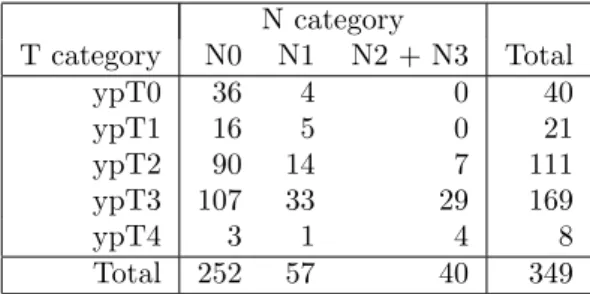
Going beyond these established techniques is also easily possibly in less standard situations: New tests can be constructed by choosing an influence function h(·) determined by the scale level of the response, and selecting a set of potential partitionsg(·) determined by the available covariates. As an illustration, we attempt to identify a high- and low-risk groups of rectal cancer patients— treated with a neo-adjuvant chemoradiotherapy regime—by differentiating them with respect to their combination of pathological T and N category. Survival times ofn= 349 patients from the preoperative arm of the CAO/ARO/AIO-94 trial (Saueret al.2004) are under test (48 patients
6 Generalized Maximally Selected Statistics N category T category N0 N1 N2 + N3 Total ypT0 36 4 0 40 ypT1 16 5 0 21 ypT2 90 14 7 111 ypT3 107 33 29 169 ypT4 3 1 4 8 Total 252 57 40 349
Table 1: Pathological T and N category of 349 rectal cancer patients treated with a preoperative chemoradiotherapy.
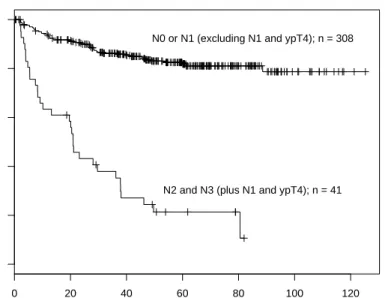
with distant metastases found at surgery were excluded from this analysis). Therefore, we propose a new maximally selected statistic for a censored response and two ordered covariates with potential interactions. Log-rank scores are used as influence function hfor the censored response and the potential partitionsg are constructed from all combinations of the five T and three N categories. As both categories are ordered, only those partitions are used which are ordered in T given N and vice versa. This yields 194 potential partitions, 187 of which meet the sample size constraints. The maximum of the absolute values of the corresponding 187 standardized statistics is 8.69 (p-value smaller than 0.0001). The partition chosen by the algorithm identifies all patients with N category N2 or N3 as being under high risk and almost all patients from N0 and N1 as being under low risk. As an exception, a single patient with ypT4 and N1 is assigned to the high risk group as well—whether or not this decision is sensible or results from random variation cannot be judged based on one observation alone. Figure1depicts Kaplan-Meier estimates of the survival times in the two risk groups.
6. Discussion
Maximally selected statistics for the estimation of simple cutpoint models have been in use since many years. Many researchers appreciate a model that is easy to communicate and easy to implement in practical situations. Of course, the tradeoff between between simplicity and accuracy has to be carefully investigated.
The new class of generalized maximally selected statistics based on the conditional inference frame-work ofStrasser and Weber(1999) allows for a unified treatment of different kinds of maximally selected statistics. Test procedures from this framework can be adapted to new test problems by specifying an influence function h, suitable for the scale level of the response, and setting up a set of potential partitionsgdetermined from the available covariates. As the number of potential partitions can become large, efficient algorithms are required for evaluating the distribution of the maximum statistic. For partitions based on cutpoints, we provide such an algorithm that computes the asymptotic distribution in linear time by exploiting the special product structure of the correlation matrix and utilizing numerical integration techniques.
The implementation of (known and newly designed) maximally selected statistics only requires the specification of the binary partitions, via a functiong, and a problem-specific influence function h. Linear statisticsTand the test statisticTmax can be computed in theRsystem for statistical
computing (R Development Core Team 2007) utilizing the function maxstat_test() from the add-on packagecoin(Hothorn et al.2006, 2007). The distribution ofTmax can be approximated
by its asymptotic distribution or by Monte-Carlo methods (also in the presence of a grouping of the observations into independent blocks) readily available from the same package.
In summary, a unified treatment of maximally selected statistics for nominal, ordered, discrete and continuous numeric, censored and multivariate response variables as well as nominal, ordered and multivariate covariates to be dichotomized is now possible both conceptually and practically.
Torsten Hothorn and Achim Zeileis 7 0 20 40 60 80 100 120 0.0 0.2 0.4 0.6 0.8 1.0
Time (in months)
Overall Survival Probability
N0 or N1 (excluding N1 and ypT4); n = 308
N2 and N3 (plus N1 and ypT4); n = 41
Figure 1: Survival times of rectum cancer patients in two risk groups identified by a maximally selected log-rank statistic.
Acknowledgments
We would like to thank A. Genz for pointing out the special product structure of the covariance matrix. C. R¨odel kindly gave us permission to use the CAO/ARO/AIO-94 trial data. The work of T. Hothorn was supported by Deutsche Forschungsgemeinschaft (DFG) under grant HO 3242/1-3.
References
Betensky RA, Rabinowitz D (1999). “Maximally Selectedχ2Statistics fork×2 Tables.”Biometrics,
55, 317–320.
Boulesteix AL (2006a). “Maximally Selected Chi-square Statistics and Binary Splits of Nominal Variables.”Biometrical Journal,48, 838–848.
Boulesteix AL (2006b). “Maximally Selected Chi-square Statistics for Ordinal Variables.” Biomet-rical Journal,48, 451–462.
Buccisano F, Maurillo L, Gattei V, Del Poeta G, Del Principe MI, Cox MC, Panetta P, Consalvo MI, Mazzone C, Neri B, Ottaviani L, Fraboni D, Tamburini A, Lo-Coco F, Amadori S, Venditti A (2006). “The Kinetics of Reduction of Minimal Residual Disease Impacts on Duration of Response and Survival of Patients with Acute Myeloid Leukemia.”Leukemia,20, 1783–1789. Galon J, Costes A, Sanchez-Cabo F, Kirilovsky A, Mlecnik B, Lagorce-Pages C, Tosolini M, Camus
M, Berger A, Wind P, Zinzindohoue F, Bruneval P, Cugnenc PH, Trajanoski Z, Fridman WH, Pages F (2006). “Type, Density, and Location of Immune Cells Within Human Colorectal Tumors Predict Clinical Outcome.”Science,313, 1960–1964.
8 Generalized Maximally Selected Statistics
Genz A (1992). “Numerical Computation of Multivariate Normal Probabilities.”Journal of Com-putational and Graphical Statistics,1, 141–149.
Genz A, Kahaner DK (1986). “The Numerical Evaluation of Certain Multivariate Normal Inte-grals.”Journal of Computational and Applied Mathematics, 16, 255–258.
Hothorn T, Hornik K, van de Wiel MA, Zeileis A (2006). “A Lego System for Conditional Infer-ence.”The American Statistician,60(3), 257–263.
Hothorn T, Hornik K, van de Wiel MA, Zeileis A (2007).coin: Conditional Inference Procedures in a Permutation Test Framework. Rpackage version 0.5-2, URLhttp://CRAN.R-project.org/. Huggett AJ (2005). “The Concept and Utility of ‘Ecological Thresholds’ in Biodiversity
Conser-vation.”Biological Conservation,124, 301–310.
Koziol JA (1991). “On Maximally Selected Chi-square Statistics.”Biometrics,47, 1557–1561. Lausen B, Hothorn T, Bretz F, Schumacher M (2004). “Assessment of Optimal Selected Prognostic
Factors.”Biometrical Journal,46(3), 364–374.
Lausen B, Schumacher M (1992). “Maximally Selected Rank Statistics.”Biometrics,48, 73–85. Meurant G (1992). “A Review on the Inverse of Symmetric Tridiagonal and Block Tridiagonal
Matrices.”SIAM Journal on Matrix Analysis and Applications,13(3), 707–728.
Miller R, Siegmund D (1982). “Maximally Selected Chi Square Statistics.”Biometrics,38, 1011– 1016.
Miwa T, Hayter AJ, Liu W (2000). “Calculations of Level Probabilities for Normal Random Variables with Unequal Variances with Applications to Bartholomew’s Test in Unbalanced One-Way Models.”Computational Statistics & Data Analysis,32, 17–32.
M¨uller J, Hothorn T (2004). “Maximally Selected Two-Sample Statistics as a New Tool for the Identification and Assessment of Habitat Factors with an Application to Breeding-Bird Com-munities in Oak Forests.”European Journal of Forest Research,123, 219–228.
Rabinowitz D, Betensky RA (2000). “Approximating the Distribution of Maximally Selected McNemar’s Statistics.”Biometrics,56, 897–902.
R Development Core Team (2007). R: A Language and Environment for Statistical Computing. R Foundation for Statistical Computing, Vienna, Austria. ISBN 3-900051-07-0, URL http: //www.R-project.org/.
Royston P, Altman DG, Sauerbrei W (2006). “Dichotomizing Continuous Predictors in Multiple Regression: A Bad Idea.”Statistics in Medicine,25, 127–141.
Sauer R, Becker H, Hohenberger W, R¨odel C, Wittekind C, Fietkau R, Martus P, Tschmelitsch J, Hager E, Hess CF, Karstens JH, Liersch T, Schmidberger H, Raab R (2004). “Preoperative Versus Postoperative Chemoradiotherapy for Rectal Cancer.”New England Journal of Medicine,
351, 1731–1740.
Strasser H, Weber C (1999). “On the Asymptotic Theory of Permutation Statistics.”Mathematical Methods of Statistics,8, 220–250. Preprint available fromhttp://epub.wu-wien.ac.at/dyn/ openURL?id=oai:epub.wu-wien.ac.at:epub-wu-01_94c.
Vinatzer U, Dampier B, Streubel B, Pacher M, Seewald MJ, Stratowa C, Kaserer K, Schreiber M (2005). “Expression of HER2 and the Coamplified Genes GRB7 and MLN64 in Human Breast Cancer: Quantitative Real-Time Reverse Transcription-PCR as a Diagnostic Alternative to Immunohistochemistry and Fluorescence In Situ Hybridization.”Clinical Cancer Research,11, 8348–8357.